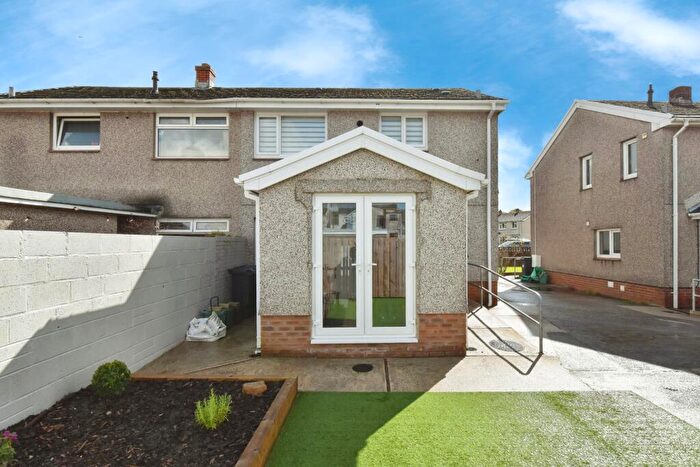
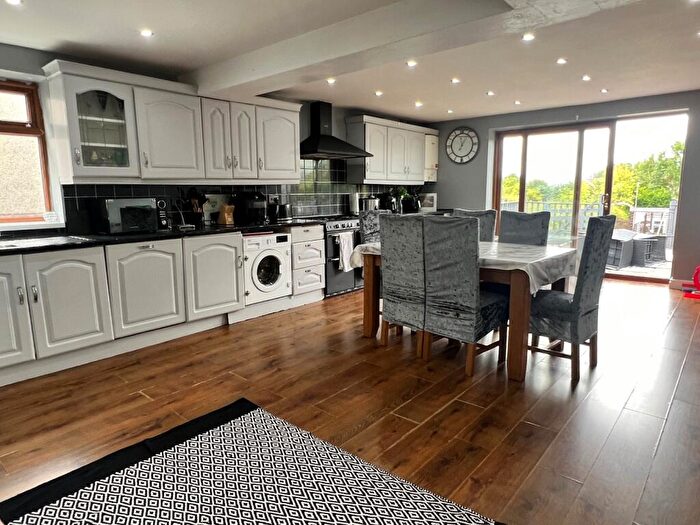
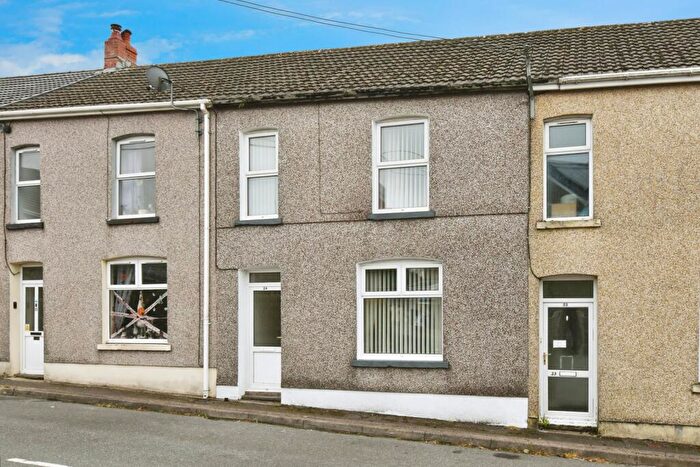
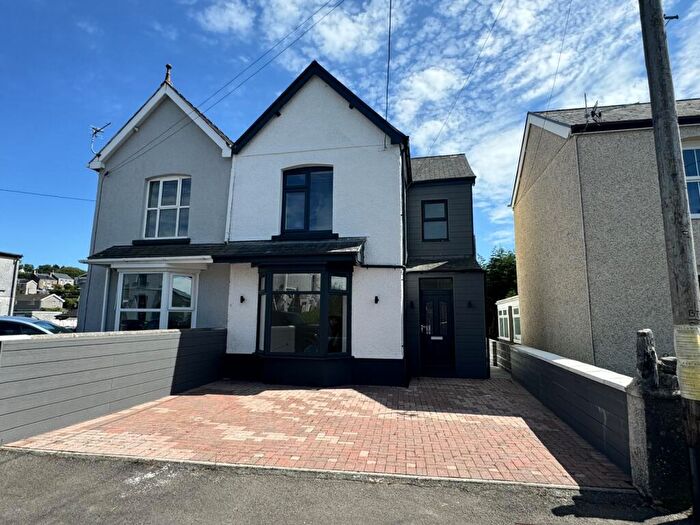
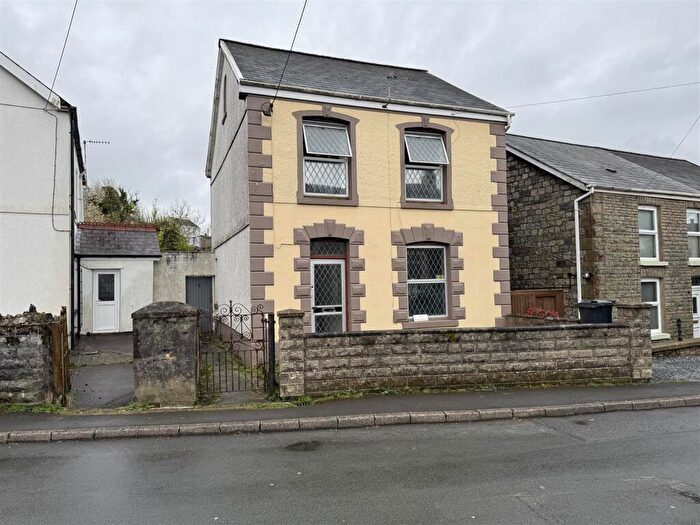
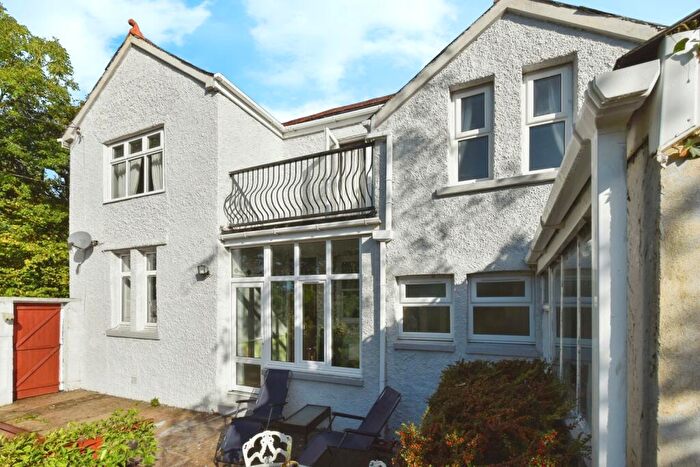
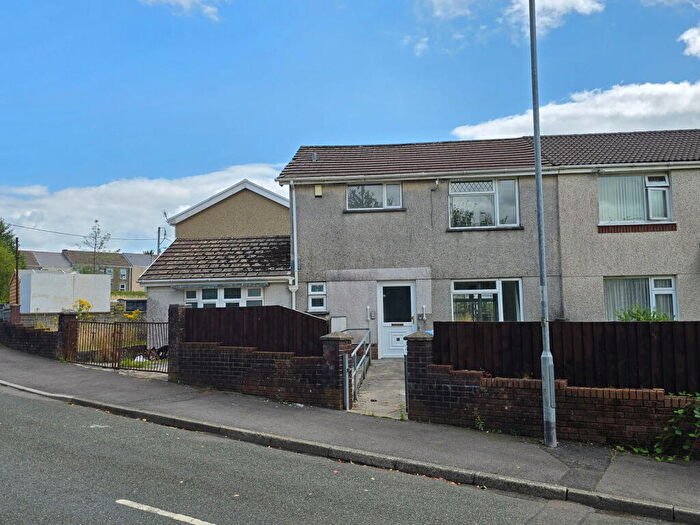
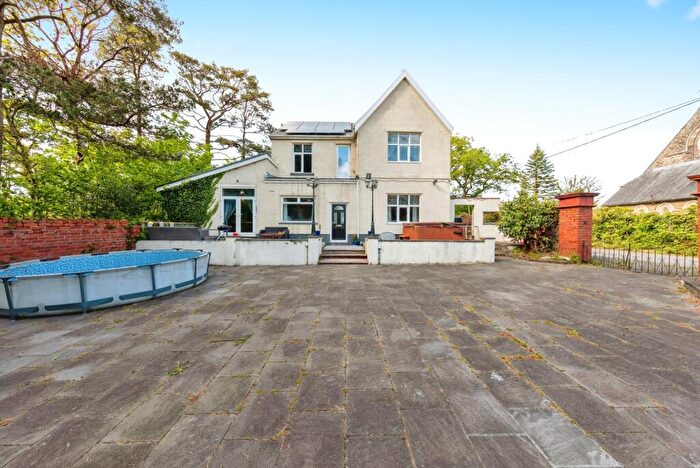
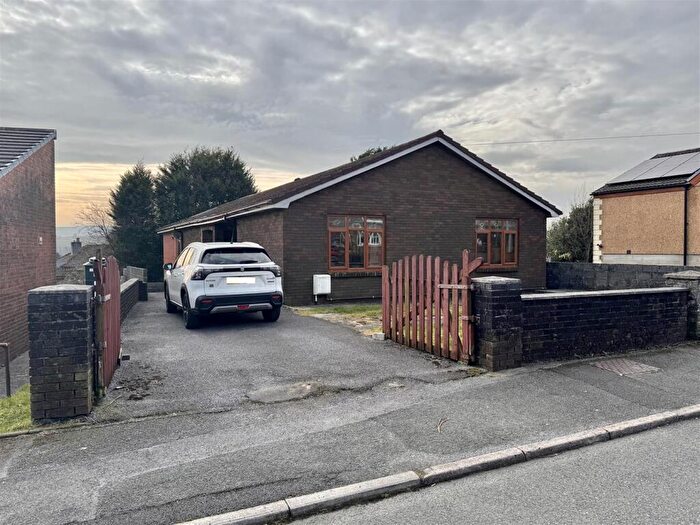
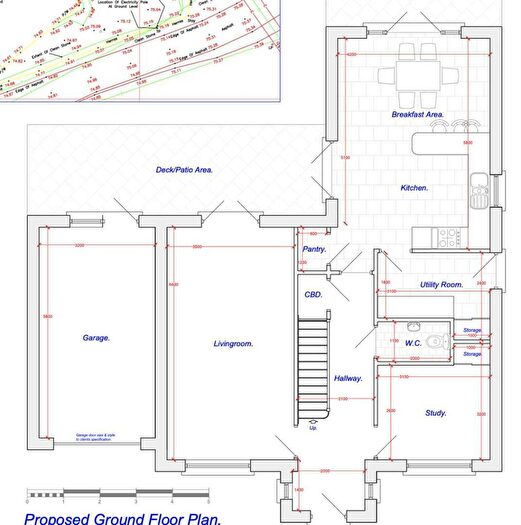
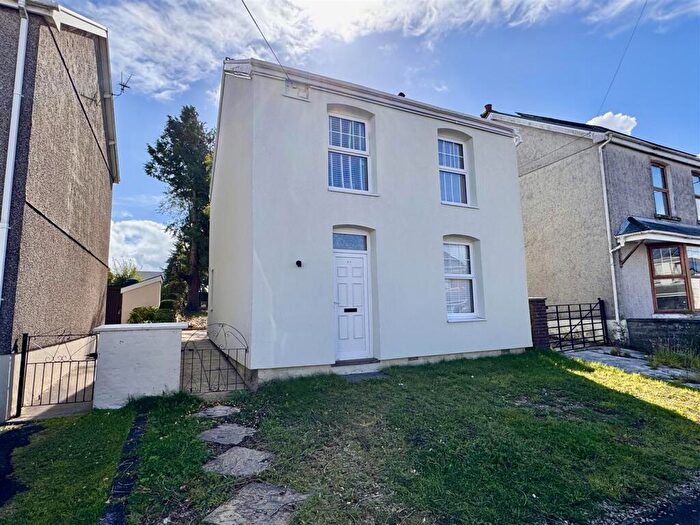
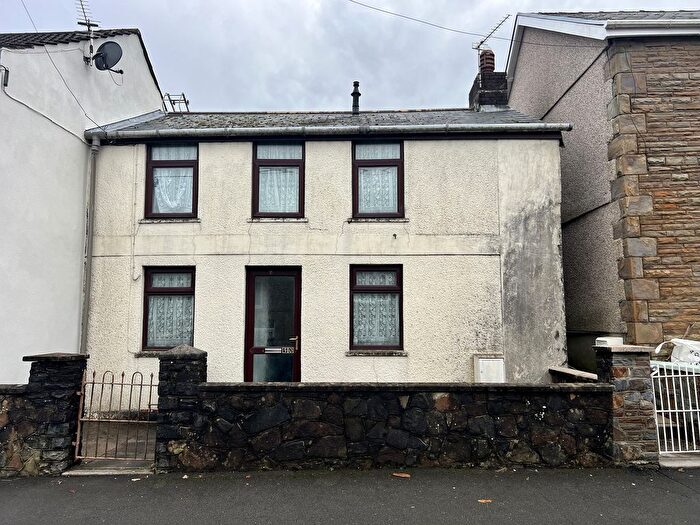
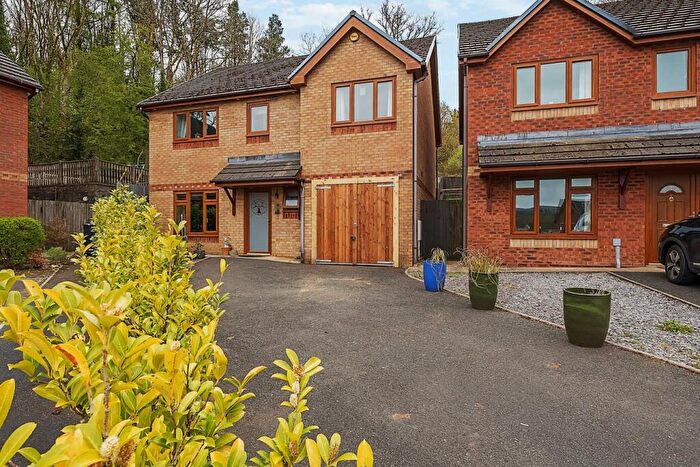
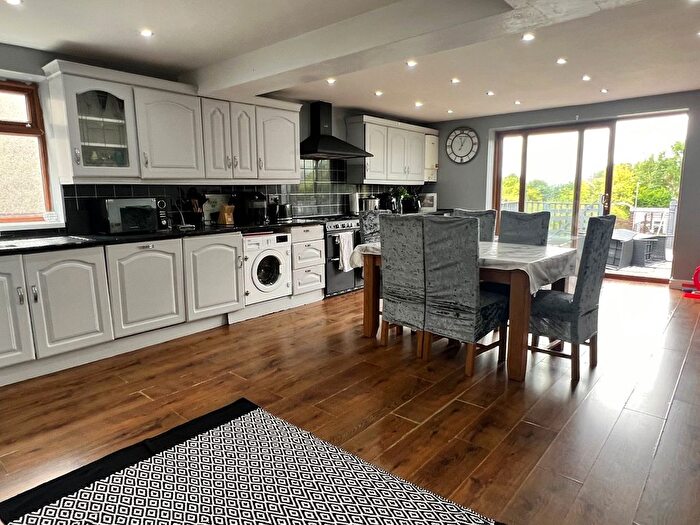
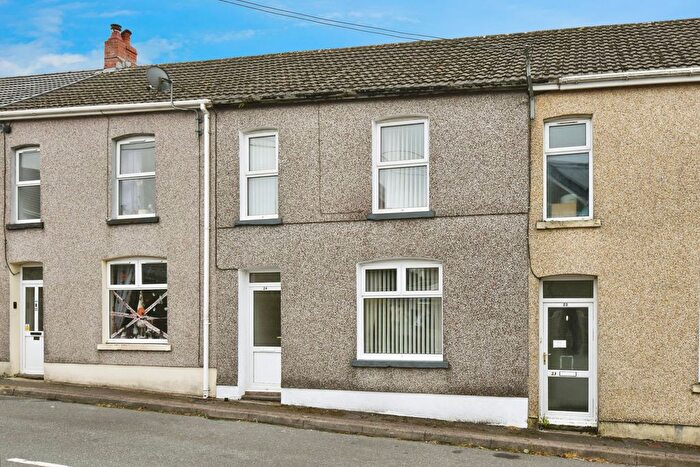
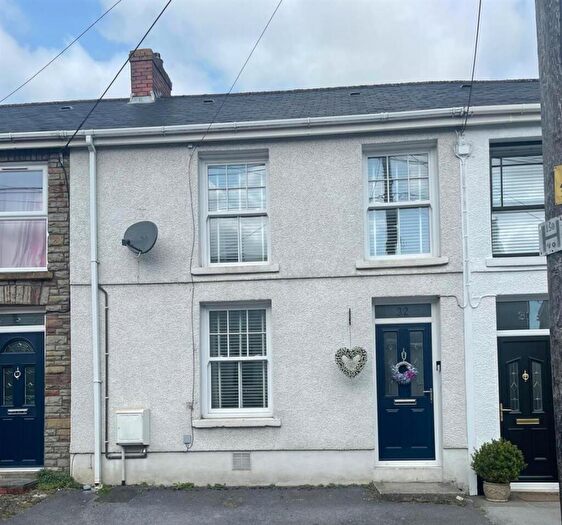
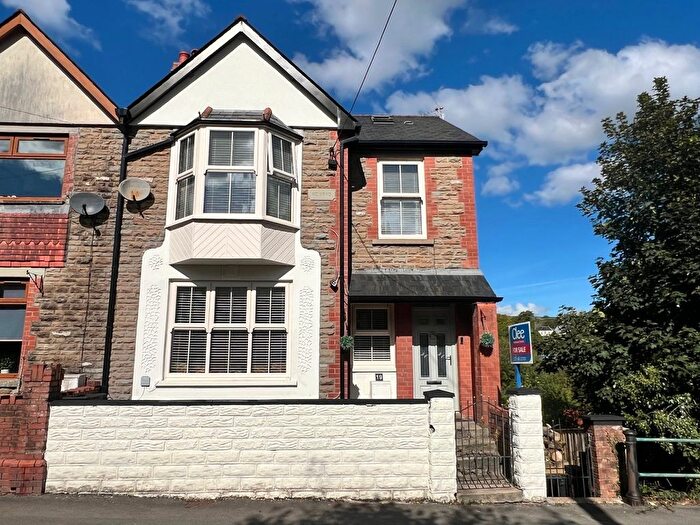
Houses for sale & to rent in Lower Brynamman, Ammanford
House Prices in Lower Brynamman
Properties in Lower Brynamman have an average house price of £155,315.00 and had 51 Property Transactions within the last 3 years¹.
Lower Brynamman is an area in Ammanford, Castell-nedd Port Talbot - Neath Port Talbot with 559 households², where the most expensive property was sold for £388,000.00.
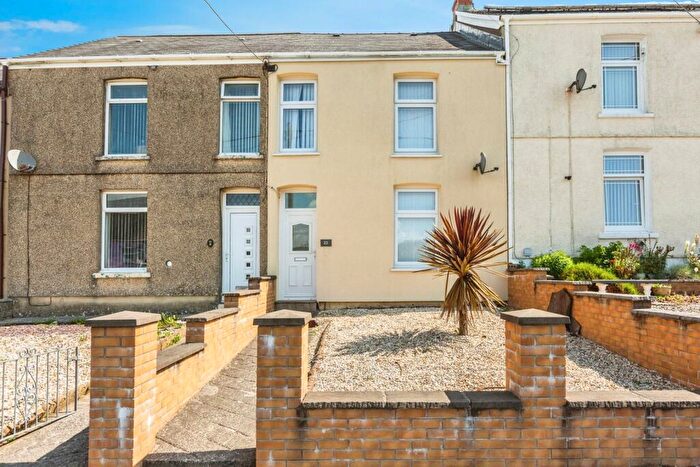
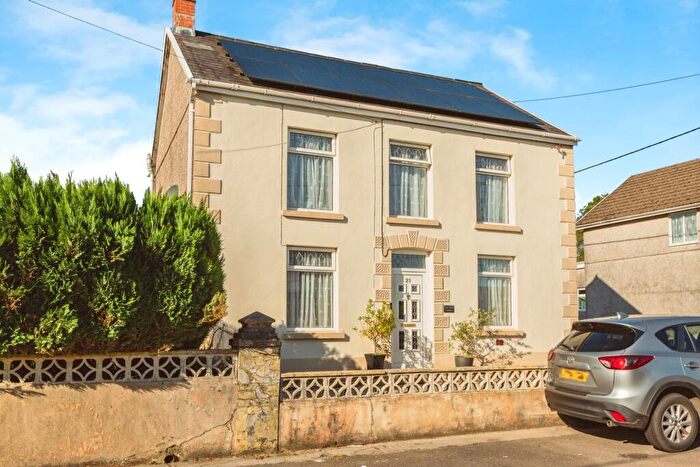
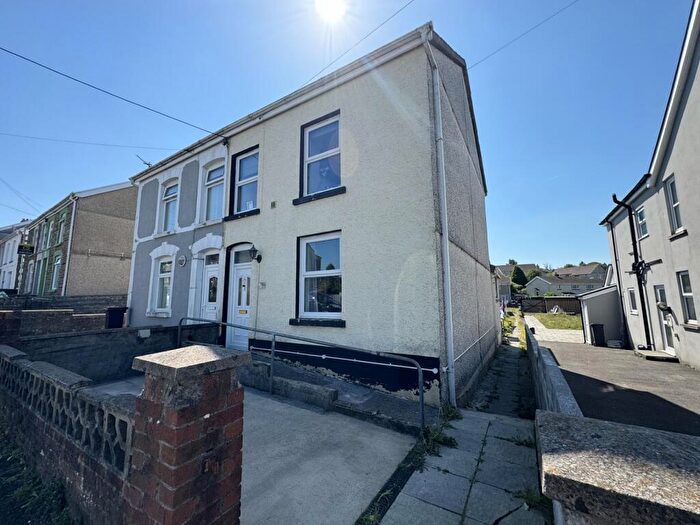
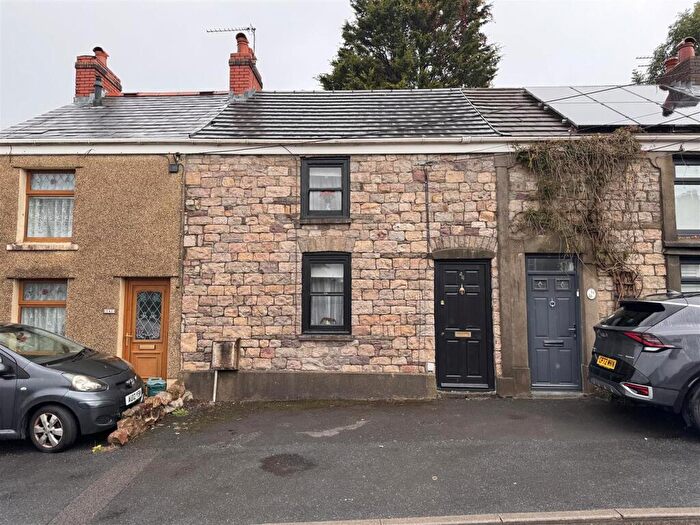
Properties for sale in Lower Brynamman
Previously listed properties in Lower Brynamman
Roads and Postcodes in Lower Brynamman
Navigate through our locations to find the location of your next house in Lower Brynamman, Ammanford for sale or to rent.
| Streets | Postcodes |
|---|---|
| Amman Cottages | SA18 1SL |
| Amman Road | SA18 1SW |
| Banwen Place | SA18 1SP |
| Barry Road | SA18 1TU SA18 1TY |
| Brook Terrace | SA18 1YA |
| Brynamman Road | SA18 1TP SA18 1TR |
| Brynglas | SA18 1YN |
| Cannon Street | SA18 1TW |
| Crud Yr Awel | SA18 1SX |
| Cwm Nant Hir Terrace | SA18 1YF |
| Garth Road | SA18 1UY |
| Glyn Road | SA18 1SJ SA18 1SR SA18 1SS SA18 1ST SA18 1BJ |
| Gors Goch Road | SA18 1TN |
| Harlech Street | SA18 1YH |
| Heol Godfrey | SA18 1TB |
| King Edward Road | SA18 1YD SA18 1YL |
| Lauderdale Road | SA18 1YG |
| Llwyncelyn Road | SA18 1UU |
| Maes Y Glyn | SA18 1SY |
| Morriston Place | SA18 1UT |
| Park Lane | SA18 1TE |
| Park Street | SA18 1TF SA18 1TG |
| School Road | SA18 1SU |
| St Davids Road | SA18 1YE |
| SA18 1SN SA18 1TL SA18 1DD SA18 1YB |
Transport near Lower Brynamman
-
Ammanford Station
-
Pantyffynnon Station
-
Llandybie Station
-
Ffairfach Station
-
Llandeilo Station
-
Pontarddulais Station
-
Llansamlet Station
-
Skewen Station
-
Llangadog Station
-
Neath Station
- FAQ
- Price Paid By Year
- Property Type Price
Frequently asked questions about Lower Brynamman
What is the average price for a property for sale in Lower Brynamman?
The average price for a property for sale in Lower Brynamman is £155,315. This amount is 2% higher than the average price in Ammanford. There are 284 property listings for sale in Lower Brynamman.
What streets have the most expensive properties for sale in Lower Brynamman?
The streets with the most expensive properties for sale in Lower Brynamman are Llwyncelyn Road at an average of £270,998, King Edward Road at an average of £217,475 and Brynamman Road at an average of £165,325.
What streets have the most affordable properties for sale in Lower Brynamman?
The streets with the most affordable properties for sale in Lower Brynamman are Park Lane at an average of £101,000, Cwm Nant Hir Terrace at an average of £105,000 and Brook Terrace at an average of £116,500.
Which train stations are available in or near Lower Brynamman?
Some of the train stations available in or near Lower Brynamman are Ammanford, Pantyffynnon and Llandybie.
Property Price Paid in Lower Brynamman by Year
The average sold property price by year was:
| Year | Average Sold Price | Price Change |
Sold Properties
|
|---|---|---|---|
| 2025 | £135,571 | -10% |
7 Properties |
| 2024 | £149,496 | 1% |
14 Properties |
| 2023 | £147,949 | -15% |
10 Properties |
| 2022 | £169,983 | 34% |
20 Properties |
| 2021 | £112,586 | 13% |
36 Properties |
| 2020 | £97,710 | -15% |
19 Properties |
| 2019 | £112,645 | 23% |
23 Properties |
| 2018 | £86,539 | -6% |
24 Properties |
| 2017 | £91,441 | -11% |
17 Properties |
| 2016 | £101,944 | 22% |
19 Properties |
| 2015 | £79,295 | -13% |
21 Properties |
| 2014 | £89,281 | 11% |
16 Properties |
| 2013 | £79,041 | 22% |
12 Properties |
| 2012 | £61,600 | -22% |
10 Properties |
| 2011 | £74,896 | -17% |
13 Properties |
| 2010 | £87,500 | 24% |
7 Properties |
| 2009 | £66,687 | -21% |
8 Properties |
| 2008 | £80,766 | -18% |
15 Properties |
| 2007 | £95,285 | -13% |
33 Properties |
| 2006 | £107,802 | 14% |
24 Properties |
| 2005 | £92,173 | 15% |
23 Properties |
| 2004 | £77,932 | 42% |
25 Properties |
| 2003 | £45,284 | 18% |
27 Properties |
| 2002 | £37,234 | 15% |
25 Properties |
| 2001 | £31,552 | 2% |
21 Properties |
| 2000 | £30,777 | -9% |
27 Properties |
| 1999 | £33,617 | 24% |
17 Properties |
| 1998 | £25,706 | -9% |
16 Properties |
| 1997 | £27,923 | 21% |
13 Properties |
| 1996 | £22,166 | 12% |
15 Properties |
| 1995 | £19,596 | - |
15 Properties |
Property Price per Property Type in Lower Brynamman
Here you can find historic sold price data in order to help with your property search.
The average Property Paid Price for specific property types in the last three years are:
| Property Type | Average Sold Price | Sold Properties |
|---|---|---|
| Semi Detached House | £142,868.00 | 16 Semi Detached Houses |
| Terraced House | £116,757.00 | 19 Terraced Houses |
| Detached House | £213,550.00 | 16 Detached Houses |

