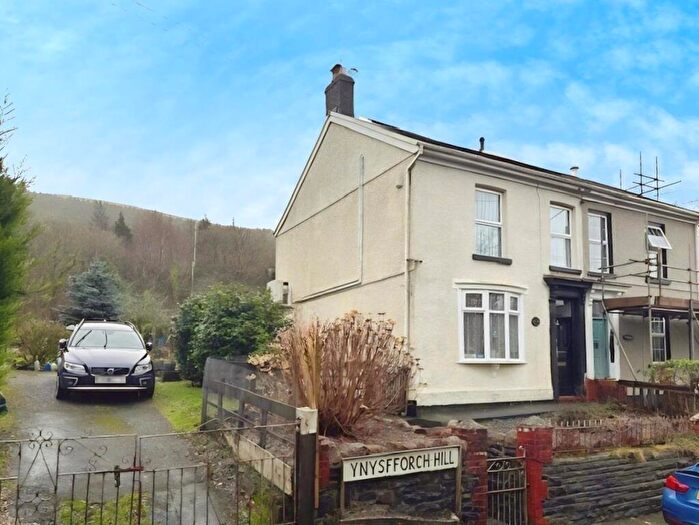
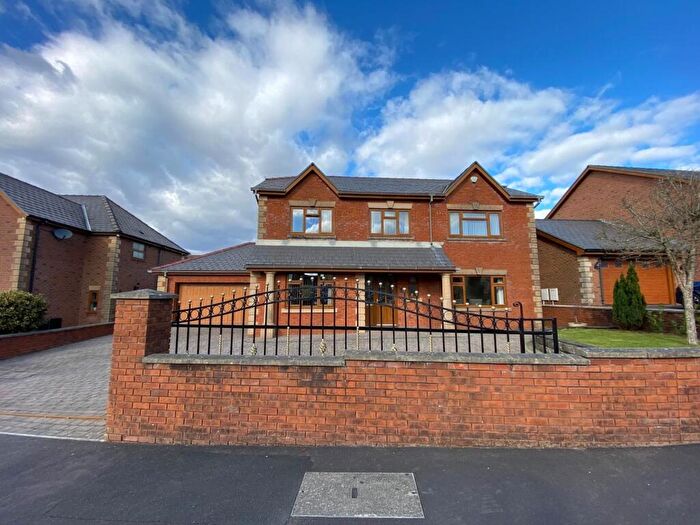
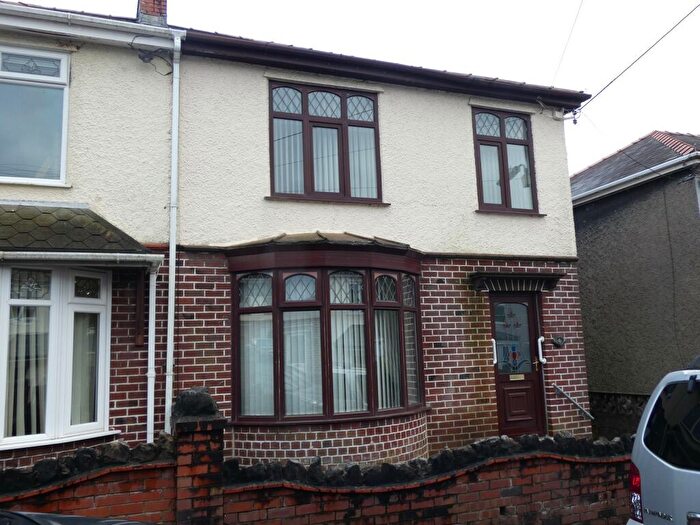
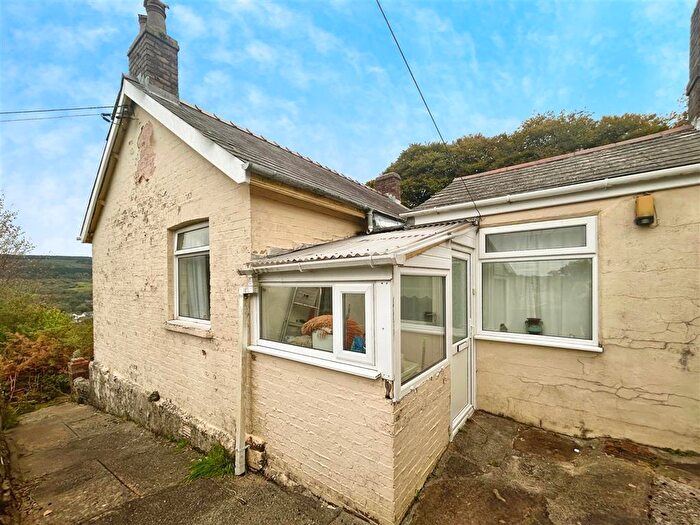
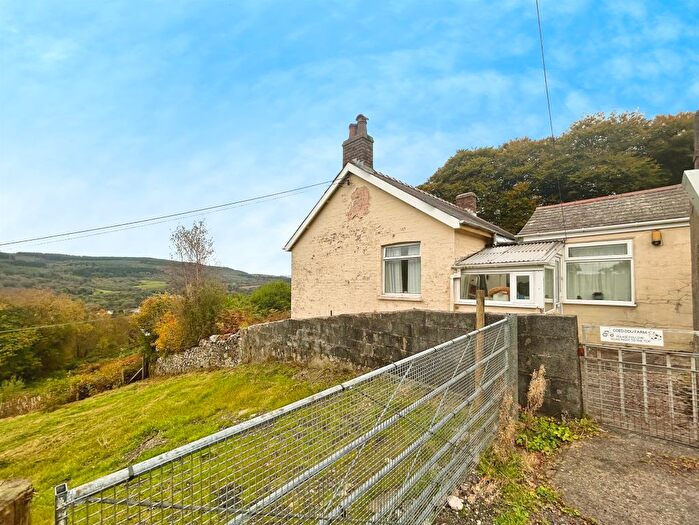
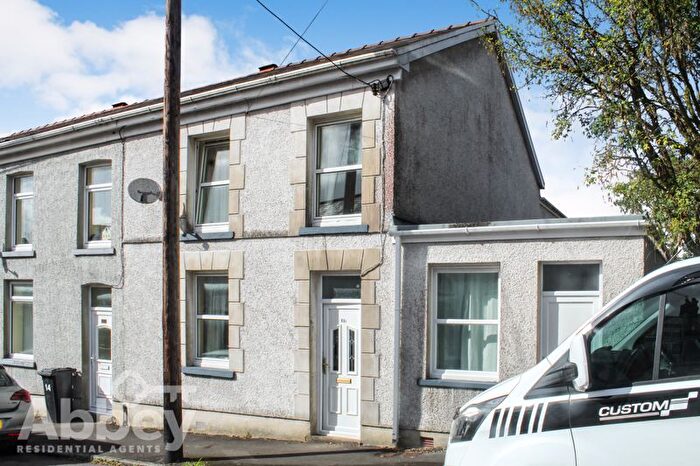
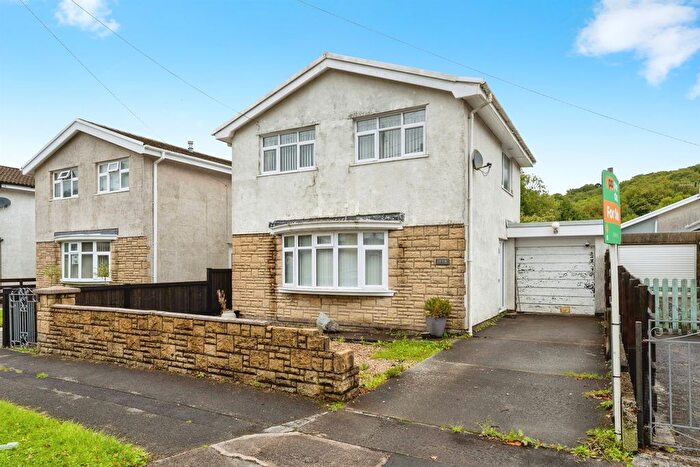
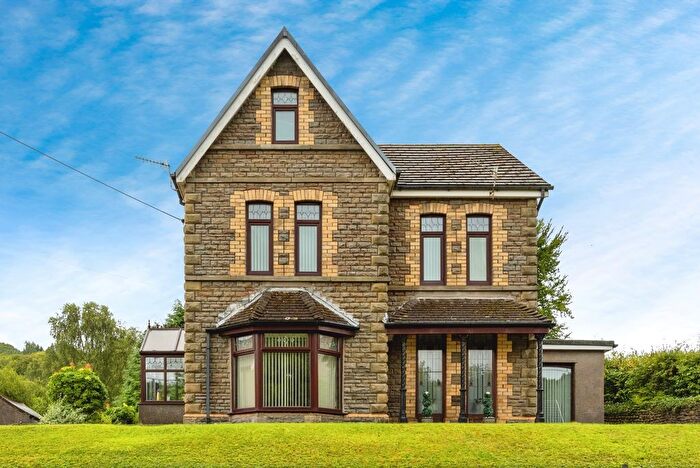
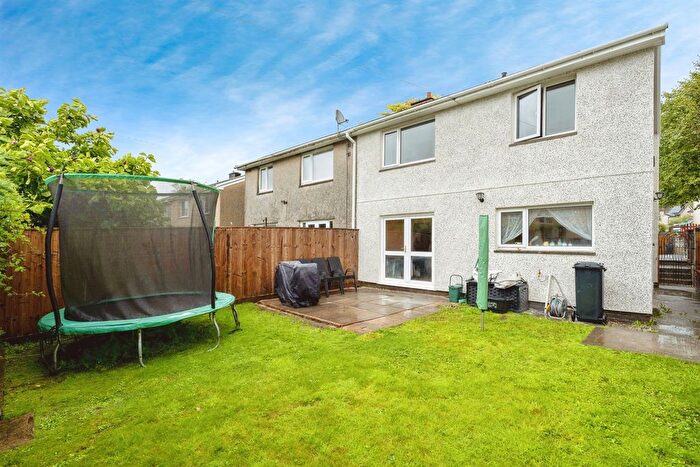
Houses for sale & to rent in Crynant, Neath
House Prices in Crynant
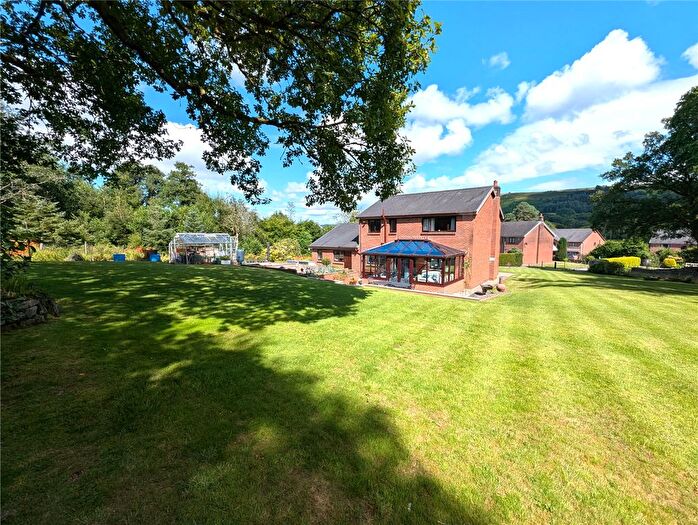
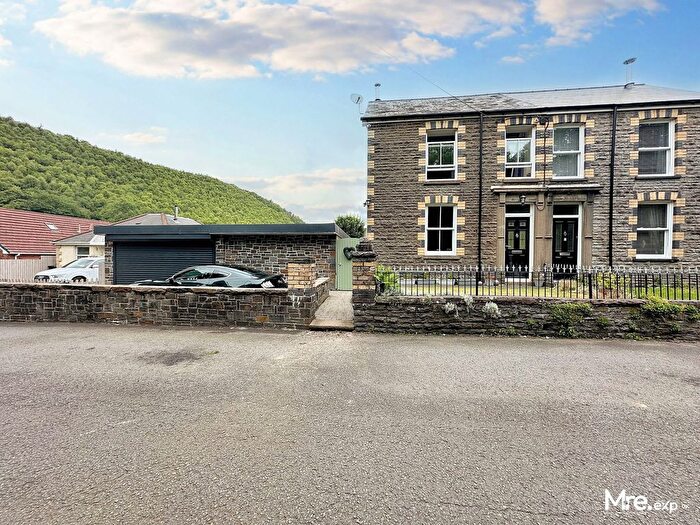
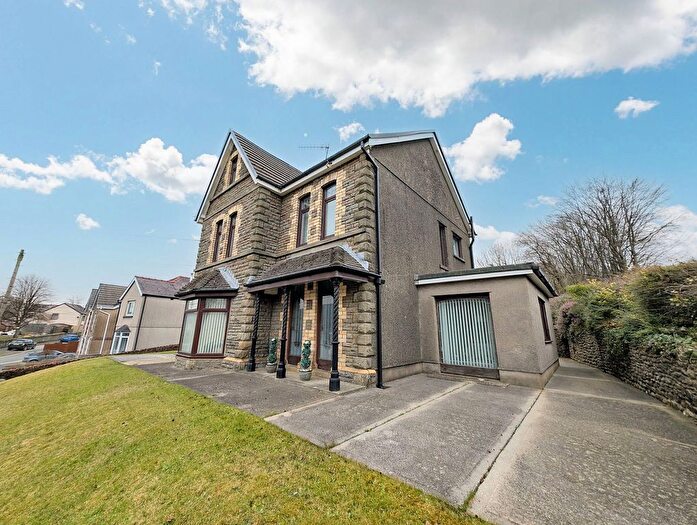
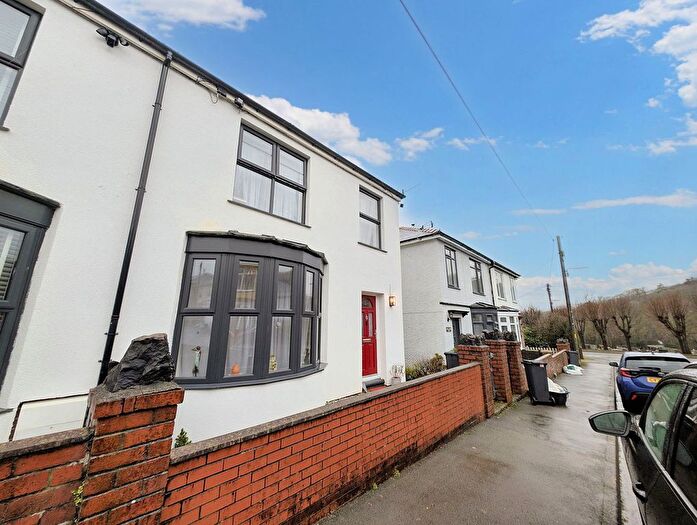
Properties in Crynant have an average house price of £190,260.00 and had 75 Property Transactions within the last 3 years¹.
Crynant is an area in Neath, Castell-nedd Port Talbot - Neath Port Talbot with 842 households², where the most expensive property was sold for £565,000.00.
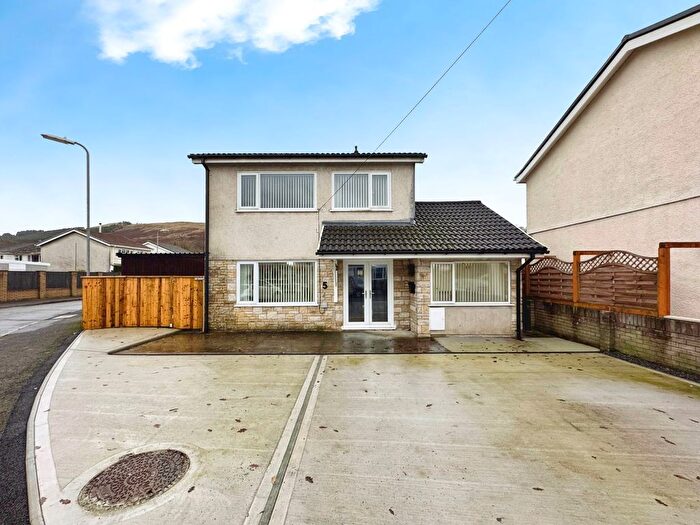
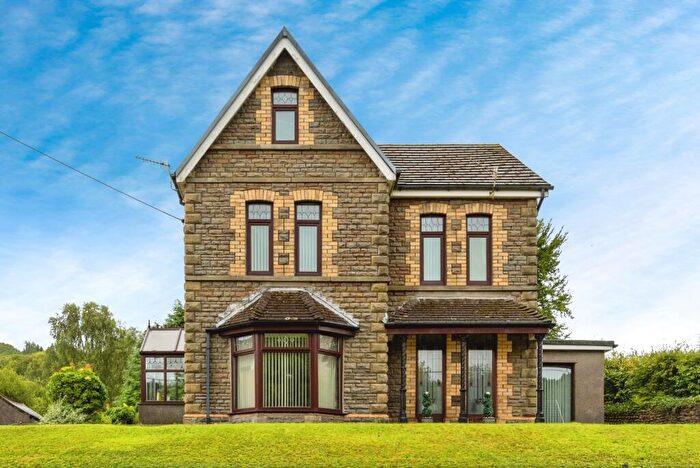
Properties for sale in Crynant
Previously listed properties in Crynant
Roads and Postcodes in Crynant
Navigate through our locations to find the location of your next house in Crynant, Neath for sale or to rent.
| Streets | Postcodes |
|---|---|
| Alderwood Close | SA10 8PY |
| Bron Allt | SA10 8TE |
| Bryn Awel | SA10 8SR |
| Brynawel Close | SA10 8TG |
| Cefn Coed Cottages | SA10 8SL |
| Coed Du Road | SA10 8SU |
| Crynant Business Park | SA10 8PX |
| Garbett Place | SA10 8PQ |
| Golwg Yr Graig | SA10 8RY |
| Gwyn Terrace | SA10 8SB |
| Heol Las Fawr | SA10 8PB |
| Heol Y Berllan | SA10 8PD |
| Heol Y Graig | SA10 8TF |
| Lewis Road | SA10 8SD |
| Llwynllanc Lane | SA10 8BJ |
| Llys Dulais | SA10 8RN |
| Maes Mawr Road | SA10 8SY |
| Main Road | SA10 8NP SA10 8NT SA10 8NY SA10 8PF SA10 8RD SA10 8RE |
| Mary Street | SA10 8SA |
| Nant Celyn | SA10 8PZ |
| Neath Road | SA10 8RS SA10 8SE SA10 8SG SA10 8SP |
| Pen Pentre | SA10 8SS |
| Pen Y Bont Terrace | SA10 8PS |
| Rhos Cottages | SA10 8PR |
| School Road | SA10 8NR SA10 8NS |
| Station Road | SA10 8NW SA10 8RB |
| Swn Y Nant | SA10 8PA |
| The Crescent | SA10 8RT |
| The Square | SA10 8RR |
| Treforgan Road | SA10 8PL SA10 8PW SA10 8PH |
| Tyn Y Graig | SA10 8TB |
| Woodland Road | SA10 8RF SA10 8RG SA10 8RH SA10 8RL SA10 8RW SA10 8RP |
| Ynys Y Bont | SA10 8PG |
| Ynyswen Terrace | SA10 8PT |
| SA10 8NG SA10 8NU SA10 8PE SA10 8PP SA10 8PU SA10 8SF SA10 8SH SA10 8ST SA10 8SW SA10 8TD SA10 9HB |
Transport near Crynant
-
Neath Station
-
Skewen Station
-
Briton Ferry Station
-
Llansamlet Station
-
Baglan Station
-
Maesteg Station
-
Maesteg (Ewenny Road) Station
-
Port Talbot Parkway Station
- FAQ
- Price Paid By Year
- Property Type Price
Frequently asked questions about Crynant
What is the average price for a property for sale in Crynant?
The average price for a property for sale in Crynant is £190,260. This amount is 15% higher than the average price in Neath. There are 149 property listings for sale in Crynant.
What streets have the most expensive properties for sale in Crynant?
The streets with the most expensive properties for sale in Crynant are Nant Celyn at an average of £495,333, Bryn Awel at an average of £284,666 and School Road at an average of £255,000.
What streets have the most affordable properties for sale in Crynant?
The streets with the most affordable properties for sale in Crynant are Heol Y Graig at an average of £72,000, The Square at an average of £106,600 and Main Road at an average of £136,833.
Which train stations are available in or near Crynant?
Some of the train stations available in or near Crynant are Neath, Skewen and Briton Ferry.
Property Price Paid in Crynant by Year
The average sold property price by year was:
| Year | Average Sold Price | Price Change |
Sold Properties
|
|---|---|---|---|
| 2025 | £192,500 | 2% |
12 Properties |
| 2024 | £189,528 | - |
19 Properties |
| 2023 | £189,522 | -0,4% |
20 Properties |
| 2022 | £190,333 | 13% |
24 Properties |
| 2021 | £165,582 | 15% |
23 Properties |
| 2020 | £140,026 | 7% |
19 Properties |
| 2019 | £130,500 | 3% |
22 Properties |
| 2018 | £126,100 | -1% |
35 Properties |
| 2017 | £127,902 | -25% |
37 Properties |
| 2016 | £159,915 | 33% |
30 Properties |
| 2015 | £106,903 | -31% |
26 Properties |
| 2014 | £140,488 | 22% |
22 Properties |
| 2013 | £108,953 | -1% |
16 Properties |
| 2012 | £109,578 | -22% |
19 Properties |
| 2011 | £134,166 | 21% |
18 Properties |
| 2010 | £105,655 | 14% |
19 Properties |
| 2009 | £91,250 | -20% |
6 Properties |
| 2008 | £109,920 | -19% |
25 Properties |
| 2007 | £130,562 | 17% |
32 Properties |
| 2006 | £108,137 | 7% |
36 Properties |
| 2005 | £100,509 | 17% |
38 Properties |
| 2004 | £83,869 | 11% |
30 Properties |
| 2003 | £74,483 | 33% |
38 Properties |
| 2002 | £49,754 | 1% |
37 Properties |
| 2001 | £49,029 | -1% |
24 Properties |
| 2000 | £49,743 | 27% |
20 Properties |
| 1999 | £36,396 | -23% |
15 Properties |
| 1998 | £44,708 | 16% |
24 Properties |
| 1997 | £37,571 | 17% |
14 Properties |
| 1996 | £31,326 | -6% |
19 Properties |
| 1995 | £33,158 | - |
12 Properties |
Property Price per Property Type in Crynant
Here you can find historic sold price data in order to help with your property search.
The average Property Paid Price for specific property types in the last three years are:
| Property Type | Average Sold Price | Sold Properties |
|---|---|---|
| Semi Detached House | £175,244.00 | 47 Semi Detached Houses |
| Detached House | £306,566.00 | 15 Detached Houses |
| Terraced House | £117,318.00 | 11 Terraced Houses |
| Flat | £72,000.00 | 2 Flats |

