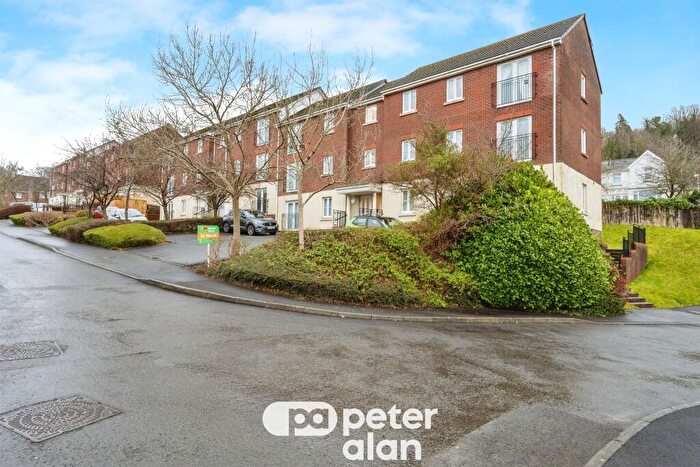
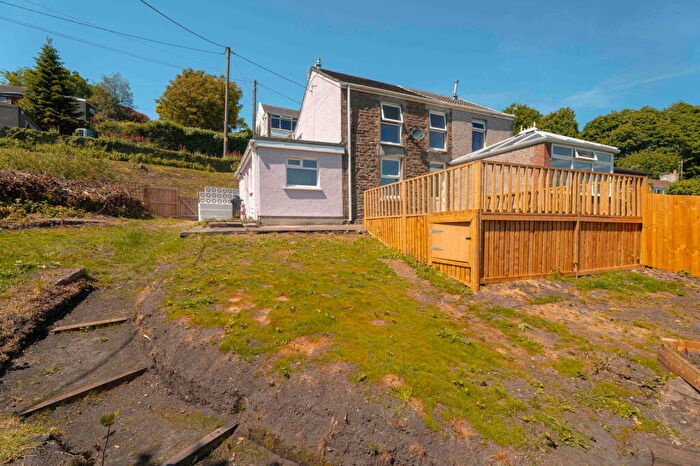
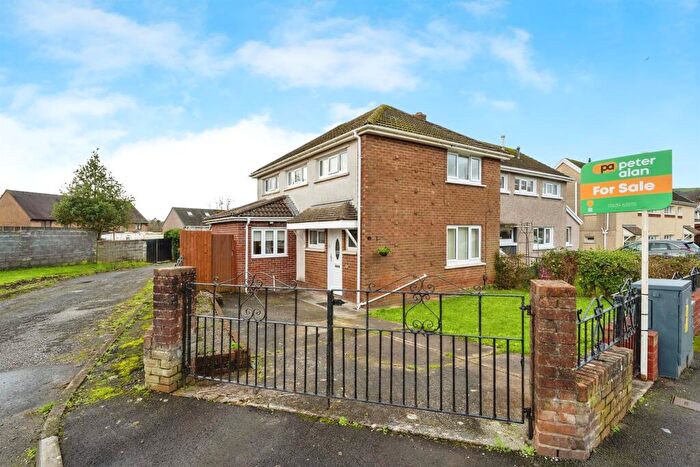
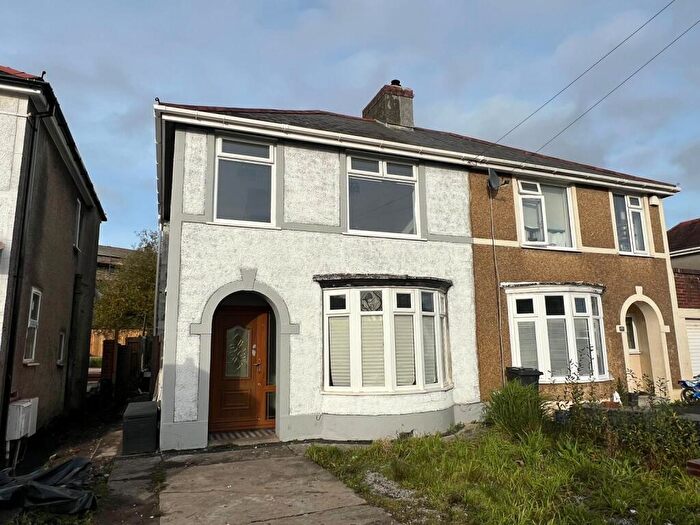
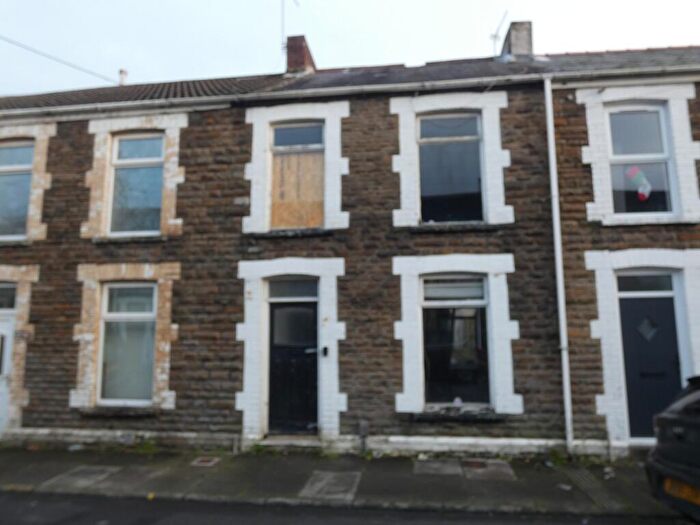
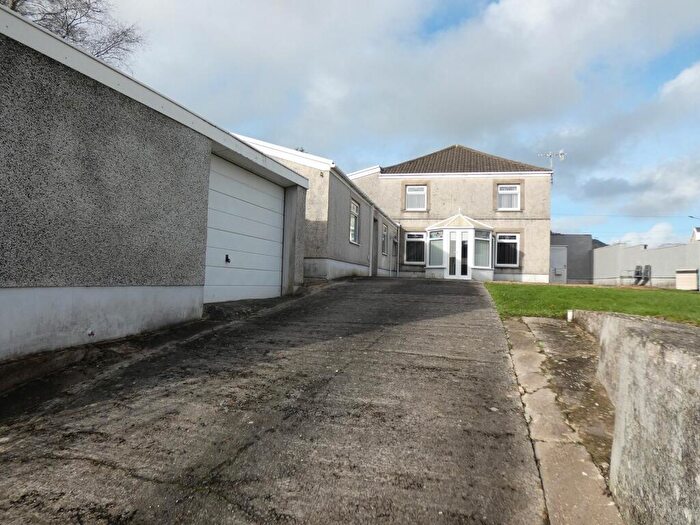
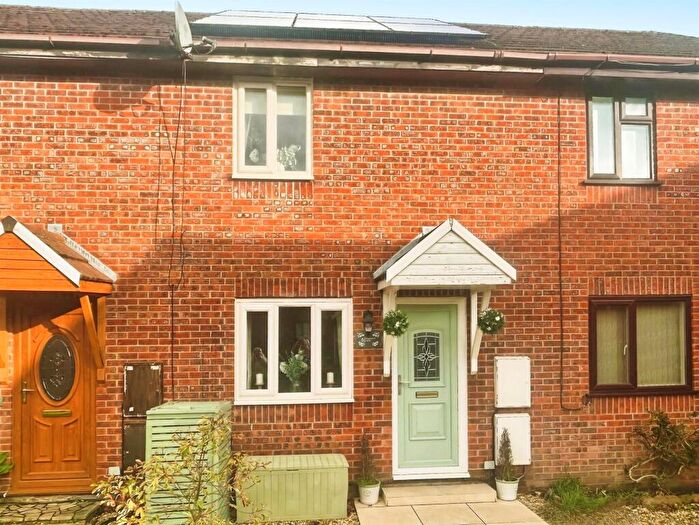
Houses for sale & to rent in Dyffryn, Neath
House Prices in Dyffryn
Properties in Dyffryn have an average house price of £178,201.00 and had 147 Property Transactions within the last 3 years¹.
Dyffryn is an area in Neath, Castell-nedd Port Talbot - Neath Port Talbot with 1,369 households², where the most expensive property was sold for £570,550.00.
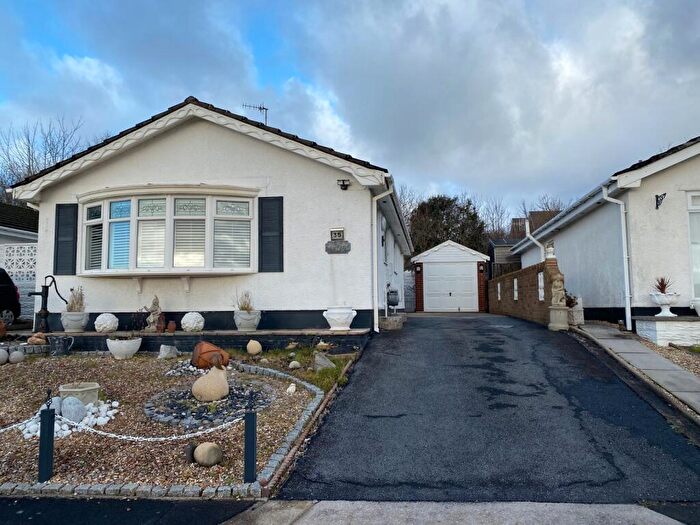
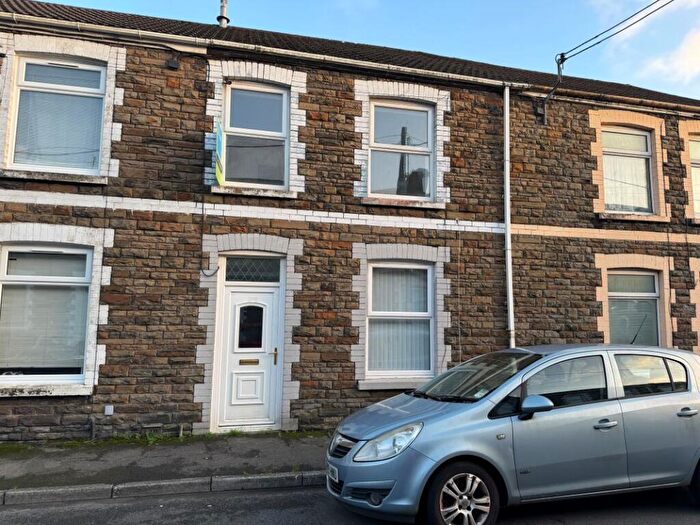
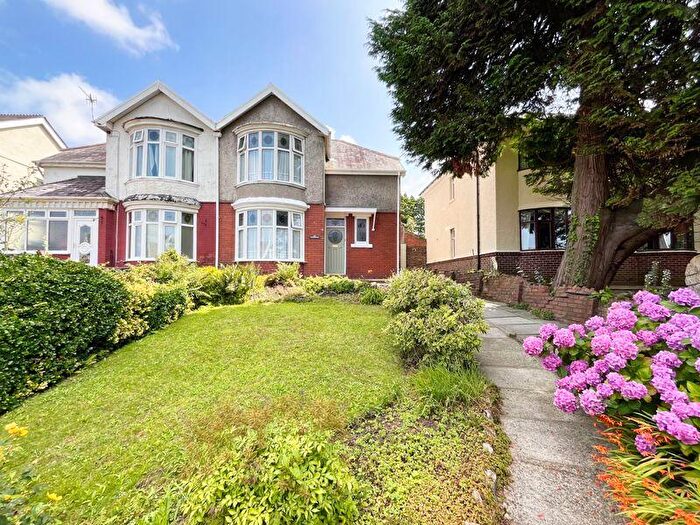
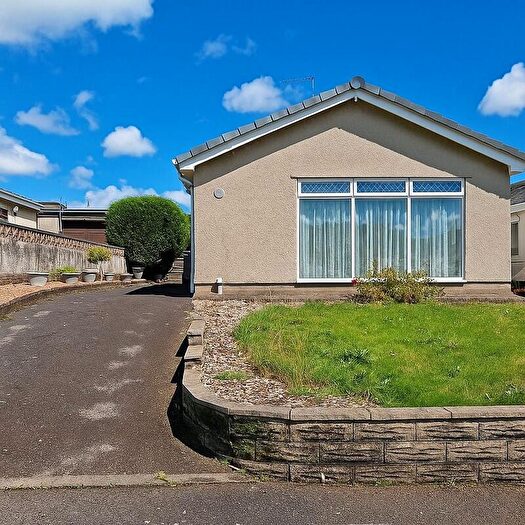
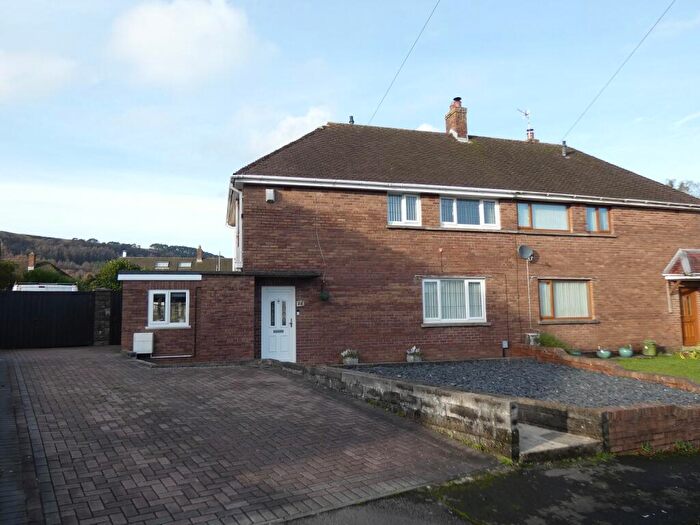
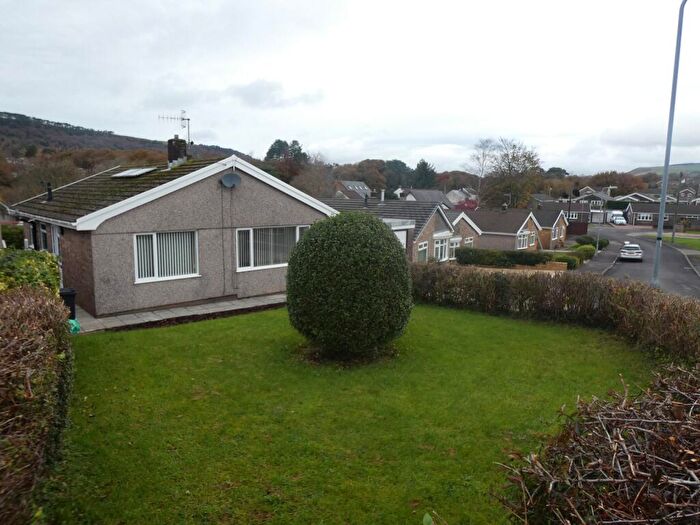
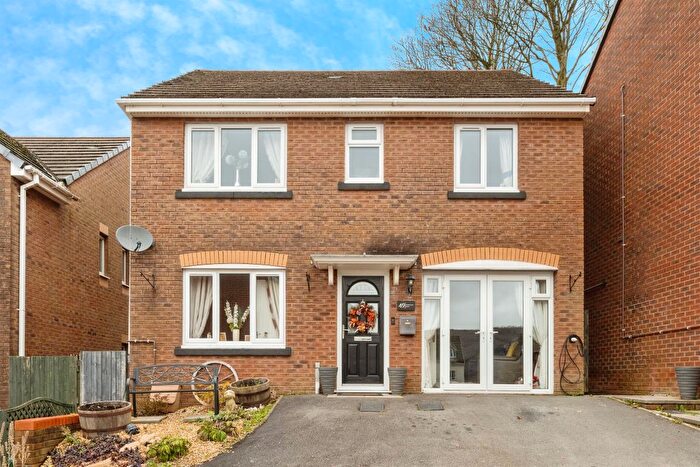
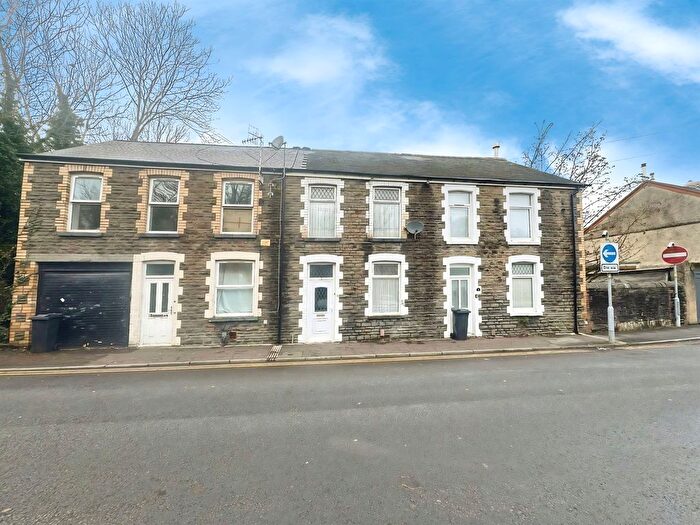
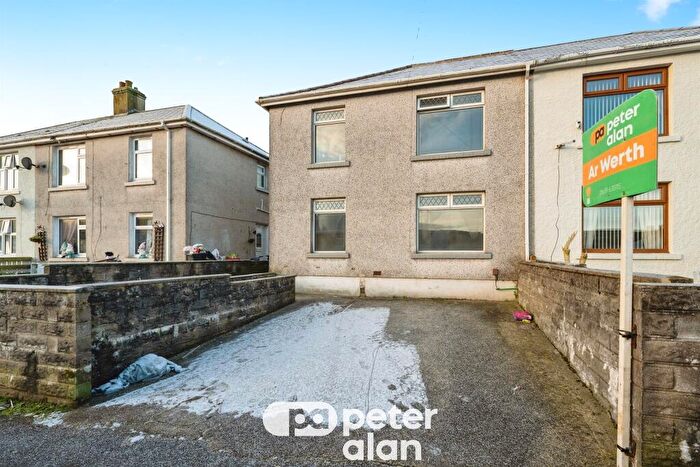
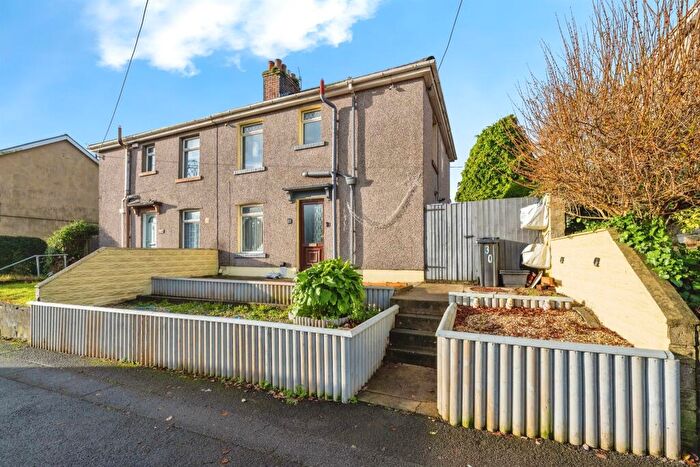
Properties for sale in Dyffryn
Roads and Postcodes in Dyffryn
Navigate through our locations to find the location of your next house in Dyffryn, Neath for sale or to rent.
| Streets | Postcodes |
|---|---|
| Abbey Road Industrial Estate | SA10 7DN |
| Abbots Walk | SA10 7DB |
| Adams Walk | SA10 7DA |
| Ballards Court | SA10 6PN |
| Benedict Close | SA10 7JA |
| Carey Walk | SA10 7DD |
| Court Walk | SA10 7BS |
| Cwm Clydach Cottages | SA10 7YY |
| Danygraig Road | SA10 7HA |
| Darran Close | SA10 6PR |
| Darran Park | SA10 6PX SA10 6PY |
| Drummau Road | SA10 6NU SA10 6NY SA10 6NN SA10 6PZ |
| Ffordd Y Mynach | SA10 7NL |
| Friars Close | SA10 7JB |
| Graig Parc | SA10 7HB |
| Gronow Close | SA10 7AD |
| Heol Esgyn | SA10 7LL SA10 7LN |
| Heol Heddwch | SA10 7LF |
| Heol Penderyn | SA10 7LG SA10 7LH |
| Heol Penlan | SA10 7LB |
| Highland Gardens | SA10 6PJ |
| Highlands Close | SA10 6TT |
| Hill Road | SA10 7NP SA10 7NR |
| Jenkins Road | SA10 7GA |
| Leyshon Court | SA10 7NQ |
| Lon Glyn Felin | SA10 7HU |
| Longford Court | SA10 7HN |
| Longford Road | SA10 7ES SA10 7ET SA10 7HE SA10 7HF SA10 7HG SA10 7HH SA10 7HL SA10 7HQ SA10 7LA |
| Monastery Road | SA10 7DP SA10 7DH SA10 7DW |
| Monks Close | SA10 7BW |
| Neath Abbey Business Park | SA10 7DR |
| Neath Abbey Road | SA10 7DF SA10 7FE |
| New Road | SA10 7DG SA10 7NG SA10 7NH SA10 7NN |
| Nidum Close | SA10 7JE |
| Old Road | SA10 7LR SA10 7LT SA10 7NF |
| Parry Close | SA10 7JD |
| Penshannel | SA10 6PG SA10 6PP SA10 6PU SA10 6PW |
| Penyard Road | SA10 7EU SA10 7EY |
| Pilgrims Close | SA10 7JF |
| Rhydhir | SA10 7HP SA10 7HR |
| Ryan Close | SA10 7JG |
| St Johns Terrace | SA10 7NA SA10 7NB SA10 7ND SA10 7NE SA10 7NT |
| Stratton Way | SA10 7AS SA10 7BT SA10 7BU |
| Taillwyd Road | SA10 7DT |
| The Croft | SA10 7NW |
| The Drive | SA10 7HD |
| The Hannants | SA10 7DE |
| The Highlands | SA10 6PB SA10 6PD SA10 6PE SA10 6PF SA10 7NS |
| The Sinnatts | SA10 7BY |
| Tregellis Road | SA10 7HT |
| Treharne Court | SA10 7EE |
| Wesley Court | SA10 7NJ |
| Wood Cottages | SA10 7BJ |
| SA10 7AJ SA10 7AX SA10 7AZ SA10 7BQ SA10 7LE SA10 6PS SA10 7HS SA10 7HW SA10 7JZ |
Transport near Dyffryn
- FAQ
- Price Paid By Year
- Property Type Price
Frequently asked questions about Dyffryn
What is the average price for a property for sale in Dyffryn?
The average price for a property for sale in Dyffryn is £178,201. This amount is 7% higher than the average price in Neath. There are 2,463 property listings for sale in Dyffryn.
What streets have the most expensive properties for sale in Dyffryn?
The streets with the most expensive properties for sale in Dyffryn are Gronow Close at an average of £300,000, Cwm Clydach Cottages at an average of £267,000 and Graig Parc at an average of £244,166.
What streets have the most affordable properties for sale in Dyffryn?
The streets with the most affordable properties for sale in Dyffryn are Abbots Walk at an average of £80,000, Lon Glyn Felin at an average of £102,000 and Drummau Road at an average of £121,699.
Which train stations are available in or near Dyffryn?
Some of the train stations available in or near Dyffryn are Skewen, Neath and Briton Ferry.
Property Price Paid in Dyffryn by Year
The average sold property price by year was:
| Year | Average Sold Price | Price Change |
Sold Properties
|
|---|---|---|---|
| 2025 | £192,063 | 8% |
30 Properties |
| 2024 | £177,333 | 11% |
36 Properties |
| 2023 | £157,659 | -18% |
36 Properties |
| 2022 | £186,089 | 24% |
45 Properties |
| 2021 | £141,432 | 8% |
53 Properties |
| 2020 | £130,576 | -3% |
26 Properties |
| 2019 | £134,252 | 5% |
37 Properties |
| 2018 | £127,554 | 0,1% |
44 Properties |
| 2017 | £127,402 | 20% |
60 Properties |
| 2016 | £101,352 | -3% |
38 Properties |
| 2015 | £103,944 | -26% |
48 Properties |
| 2014 | £130,757 | 19% |
33 Properties |
| 2013 | £105,973 | 1% |
40 Properties |
| 2012 | £105,332 | -10% |
35 Properties |
| 2011 | £116,032 | 6% |
38 Properties |
| 2010 | £109,093 | -26% |
27 Properties |
| 2009 | £137,014 | 8% |
30 Properties |
| 2008 | £126,373 | 1% |
25 Properties |
| 2007 | £125,604 | 13% |
68 Properties |
| 2006 | £109,485 | 10% |
54 Properties |
| 2005 | £98,987 | 13% |
45 Properties |
| 2004 | £86,116 | 24% |
54 Properties |
| 2003 | £65,424 | 7% |
69 Properties |
| 2002 | £60,801 | 16% |
77 Properties |
| 2001 | £51,255 | 9% |
61 Properties |
| 2000 | £46,654 | 1% |
53 Properties |
| 1999 | £46,311 | -1% |
67 Properties |
| 1998 | £46,734 | 8% |
50 Properties |
| 1997 | £43,120 | 5% |
45 Properties |
| 1996 | £40,761 | 1% |
64 Properties |
| 1995 | £40,246 | - |
42 Properties |
Property Price per Property Type in Dyffryn
Here you can find historic sold price data in order to help with your property search.
The average Property Paid Price for specific property types in the last three years are:
| Property Type | Average Sold Price | Sold Properties |
|---|---|---|
| Semi Detached House | £169,587.00 | 66 Semi Detached Houses |
| Detached House | £259,651.00 | 33 Detached Houses |
| Terraced House | £141,117.00 | 42 Terraced Houses |
| Flat | £84,583.00 | 6 Flats |

