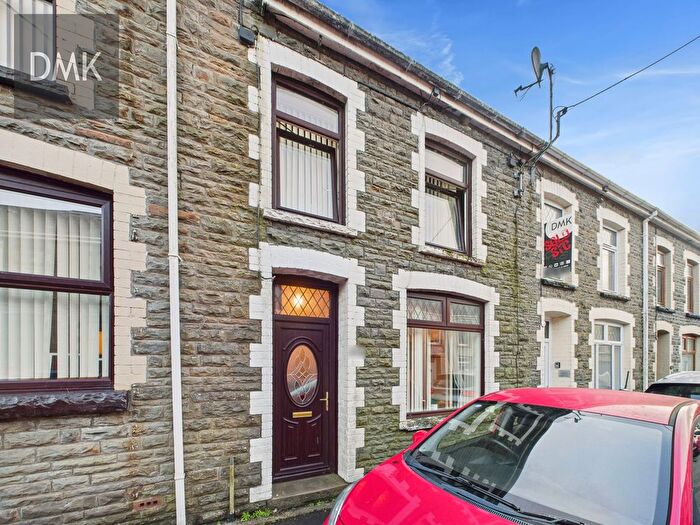
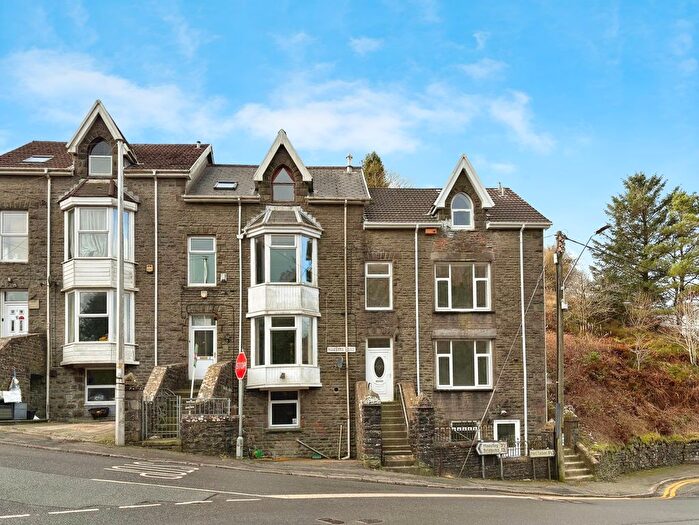
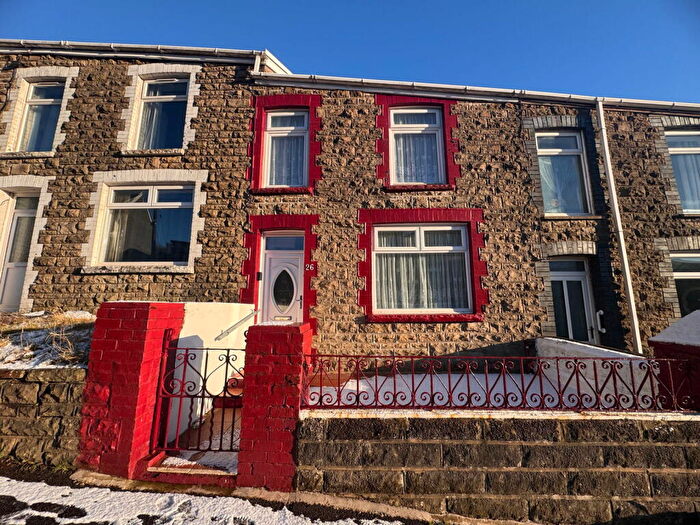
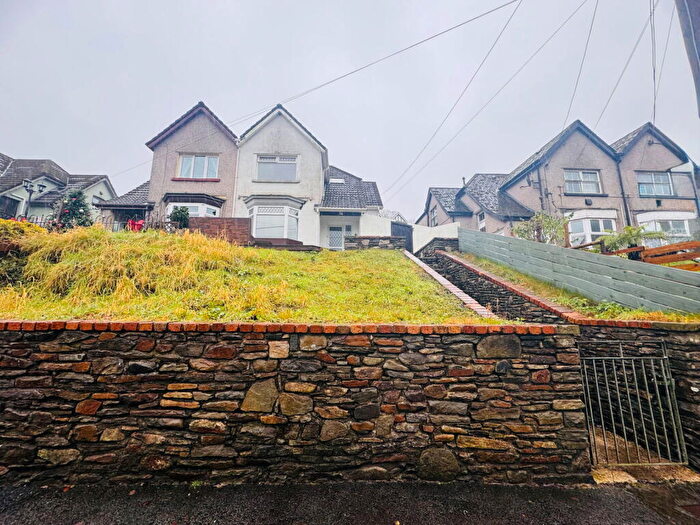
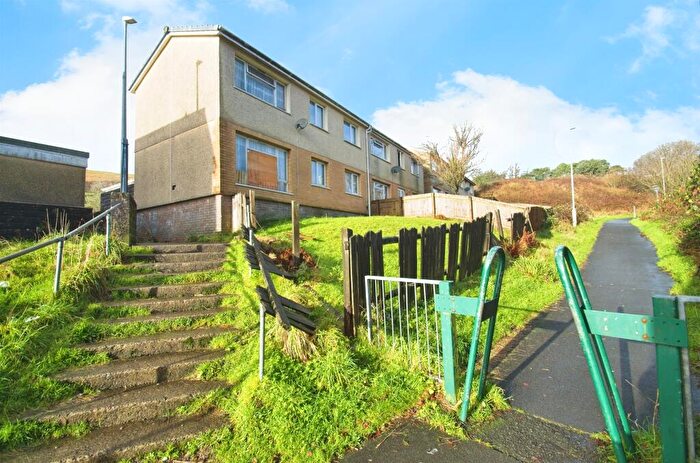
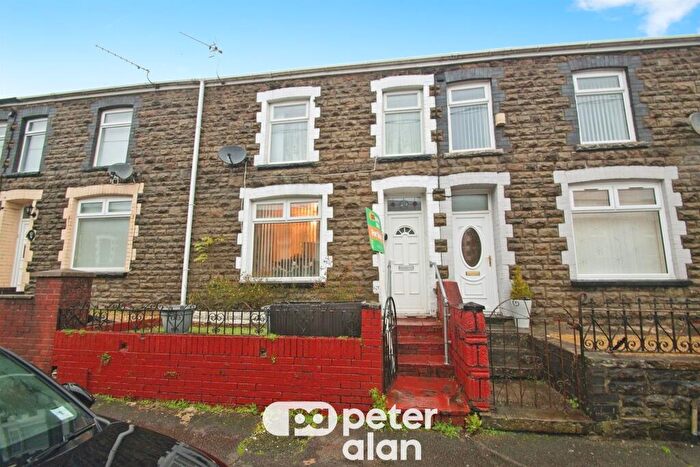
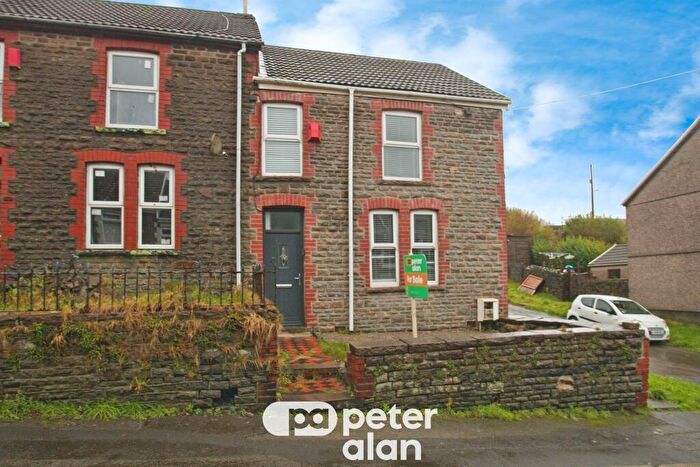
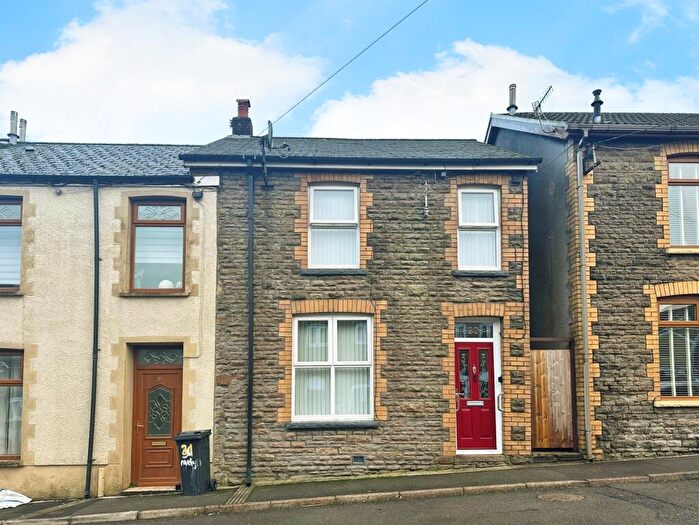
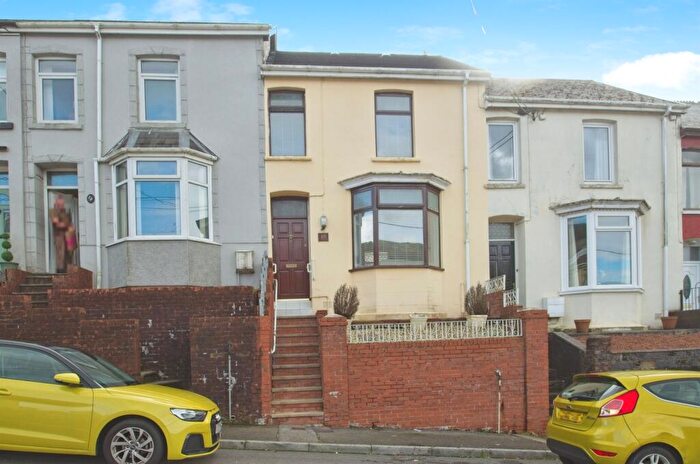
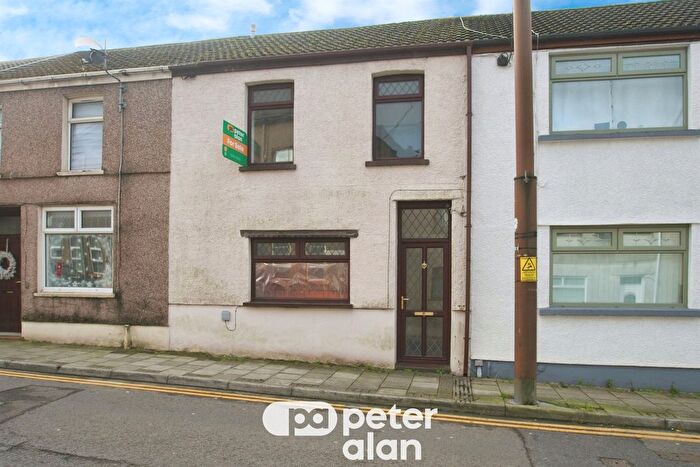
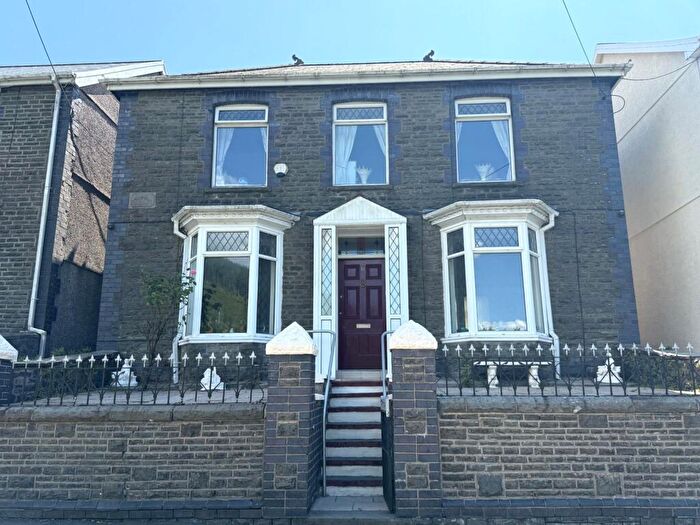
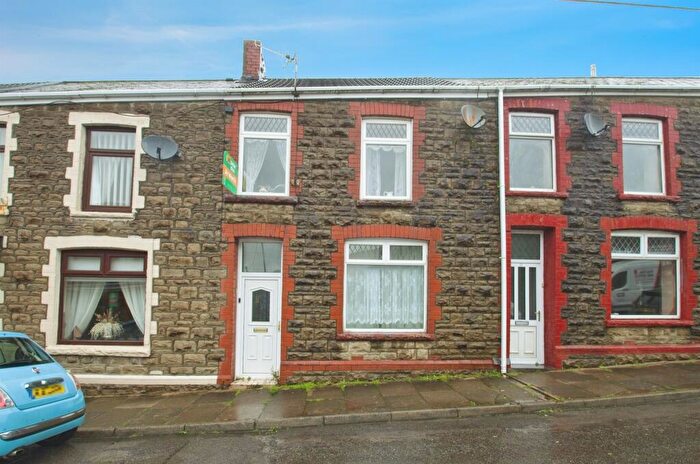
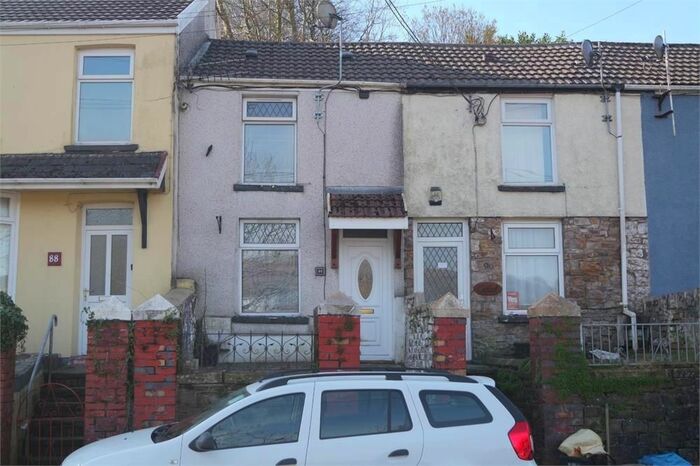
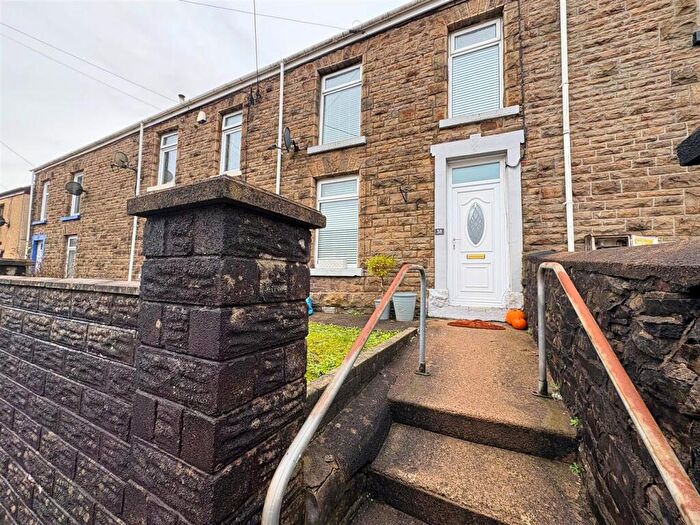
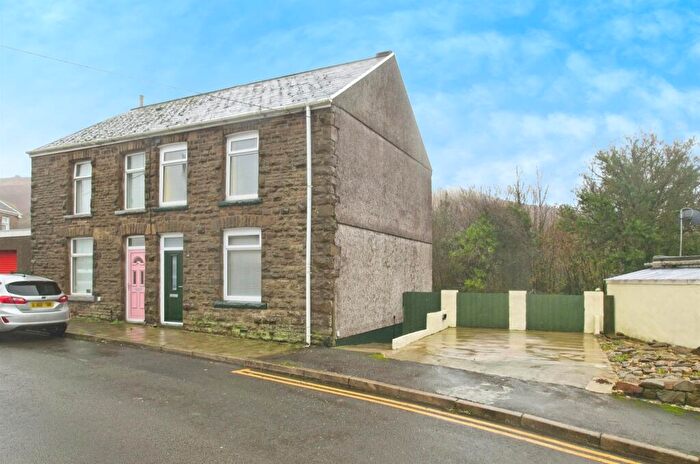
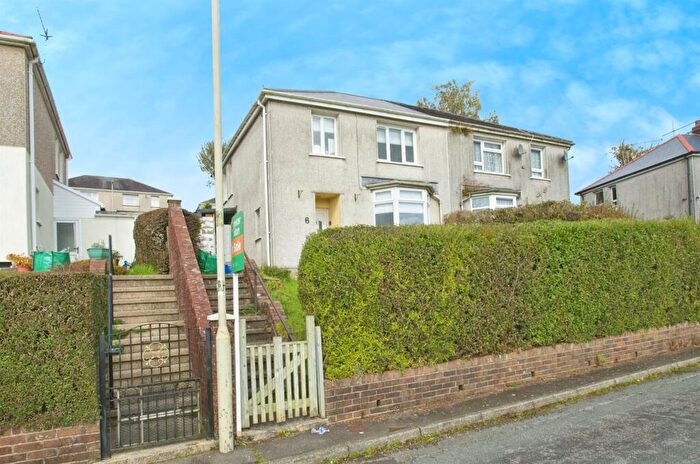
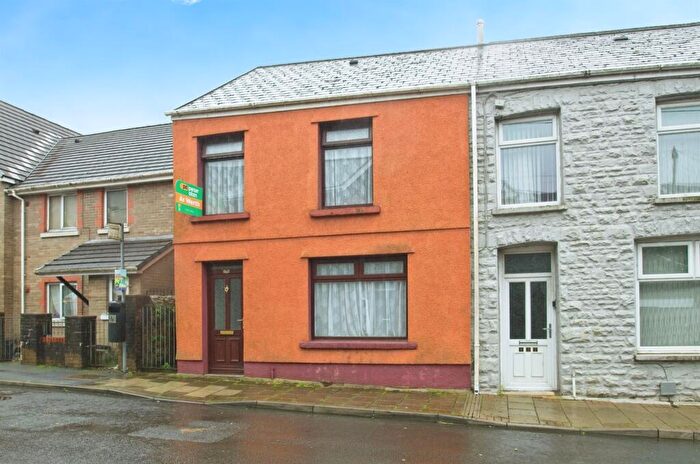
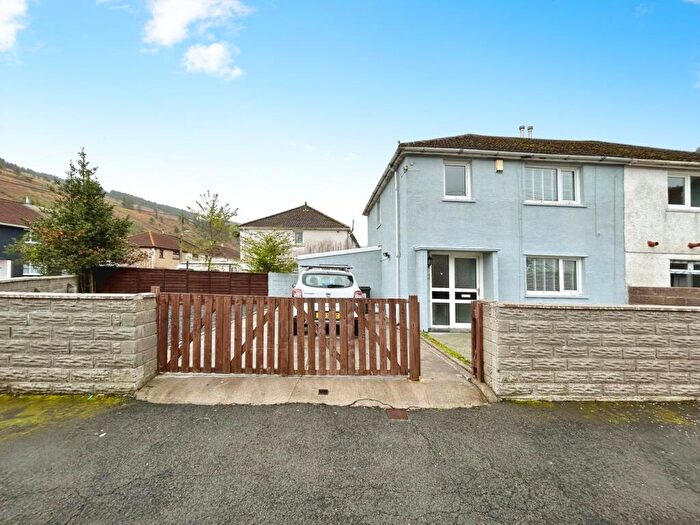
Houses for sale & to rent in Cymmer, Port Talbot
House Prices in Cymmer
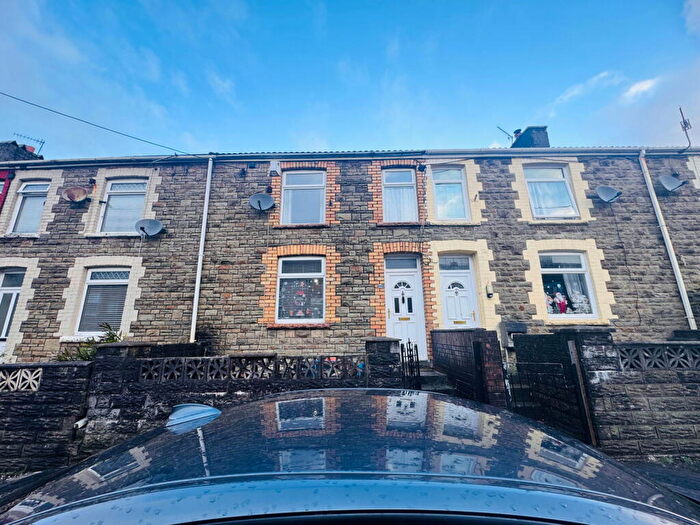
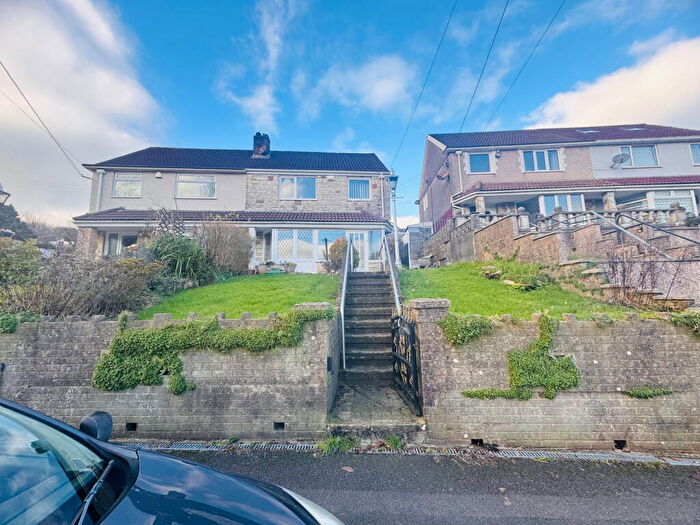
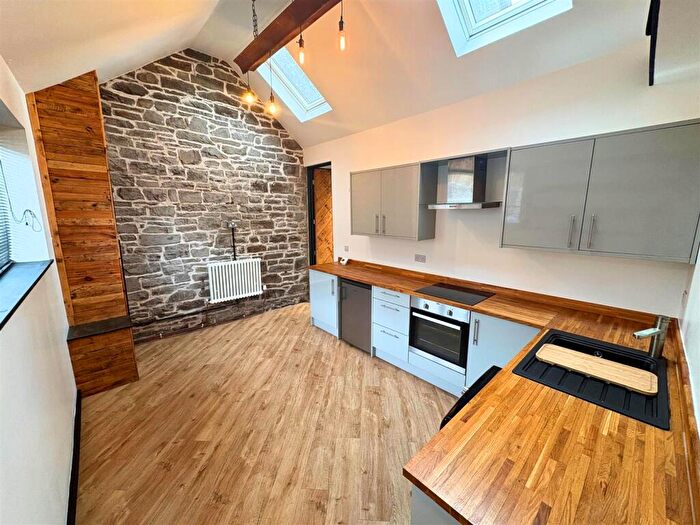
Properties in Cymmer have an average house price of £126,294.00 and had 88 Property Transactions within the last 3 years¹.
Cymmer is an area in Port Talbot, Castell-nedd Port Talbot - Neath Port Talbot with 1,183 households², where the most expensive property was sold for £850,000.00.
Properties for sale in Cymmer
Roads and Postcodes in Cymmer
Navigate through our locations to find the location of your next house in Cymmer, Port Talbot for sale or to rent.
| Streets | Postcodes |
|---|---|
| Abercregan Road | SA13 3LJ |
| Afan Road | SA13 3ES SA13 3ET |
| Alban Terrace | SA13 3LH |
| Alder Terrace | SA13 3NS |
| Avon Street | SA13 3LT |
| Avondale Terrace | SA13 3LU |
| Blaenant Street | SA13 3HB |
| Bryn Coed | SA13 3PR |
| Bryn Siriol | SA13 3PL |
| Brynheulog Road | SA13 3RR SA13 3RS SA13 3SA |
| Brytwn Road | SA13 3EN SA13 3EP SA13 3EW |
| Chapel Houses | SA13 3HU |
| Chapel Street | SA13 3LR |
| Church Street | SA13 3RG |
| Coronation Avenue | SA13 3NT |
| Craig Y Fan Terrace | SA13 3LN |
| Duffryn Street | SA13 3HD |
| Dwyfor Road | SA13 3RF |
| Eastern Avenue | SA13 3PB |
| Fairfield Road | SA13 3RP |
| Gelli Houses | SA13 3NP |
| Gwynedd Avenue | SA13 3RN SA13 3RW |
| Heol Croeserw | SA13 3NU |
| Heol Syr William | SA13 3SW |
| Heol Tewdwr | SA13 3NY |
| Heol Y Castell | SA13 3HA |
| Heol Y Fedw | SA13 3PA |
| Heol Y Glyn | SA13 3NA SA13 3NB |
| Heol Y Tyla | SA13 3EY |
| Heol Yr Afael | SA13 3EU |
| Hillcrest | SA13 3SE |
| Hillcroft Crescent | SA13 3SP |
| Llanover Road | SA13 3RE |
| Lloyds Terrace | SA13 3HT |
| Maesteg Road | SA13 3HS |
| Margam Street | SA13 3ED SA13 3EE SA13 3EF |
| Menai Avenue | SA13 3SF |
| Mount Pleasant | SA13 3LW |
| Nant Y Fedw Avenue | SA13 3SB |
| Pen Y Bryn | SA13 3SD |
| Pen Y Mynydd | SA13 3RH SA13 3RL |
| Pen Y Wern | SA13 3PP |
| Penderyn Road | SA13 3SR |
| Penhydd Road | SA13 3RD |
| Pentwyn Road | SA13 3HH |
| Percy Road | SA13 3HL |
| Pine Grove | SA13 3RU |
| Pleasant View | SA13 3LP |
| Prescely Road | SA13 3PH |
| Prossers Terrace | SA13 3LD SA13 3LE |
| Queens Road | SA13 3SN |
| School Road | SA13 3EG SA13 3EL |
| South Avenue | SA13 3PE SA13 3PF SA13 3PY SA13 3RB SA13 3RA |
| Station Road | SA13 3HR |
| Sunny Crescent | SA13 3PG SA13 3PQ |
| Sunnyside Terrace | SA13 3LY |
| Valley View | SA13 3RT |
| Viaduct Road | SA13 3NR |
| Wern Terrace | SA13 3NL |
| SA13 3NN SA13 3HE SA13 3HG SA13 3HY SA13 3LL SA13 3ND |
Transport near Cymmer
- FAQ
- Price Paid By Year
- Property Type Price
Frequently asked questions about Cymmer
What is the average price for a property for sale in Cymmer?
The average price for a property for sale in Cymmer is £126,294. This amount is 21% lower than the average price in Port Talbot. There are 1,105 property listings for sale in Cymmer.
What streets have the most expensive properties for sale in Cymmer?
The streets with the most expensive properties for sale in Cymmer are Pleasant View at an average of £247,750, Blaenant Street at an average of £186,000 and Pentwyn Road at an average of £180,000.
What streets have the most affordable properties for sale in Cymmer?
The streets with the most affordable properties for sale in Cymmer are Church Street at an average of £75,000, Brytwn Road at an average of £76,000 and South Avenue at an average of £78,250.
Which train stations are available in or near Cymmer?
Some of the train stations available in or near Cymmer are Maesteg, Maesteg (Ewenny Road) and Garth (Mid-Glamorgan).
Property Price Paid in Cymmer by Year
The average sold property price by year was:
| Year | Average Sold Price | Price Change |
Sold Properties
|
|---|---|---|---|
| 2025 | £104,769 | -27% |
13 Properties |
| 2024 | £133,030 | -4% |
31 Properties |
| 2023 | £137,786 | 18% |
26 Properties |
| 2022 | £113,638 | 14% |
18 Properties |
| 2021 | £97,361 | 15% |
27 Properties |
| 2020 | £82,628 | 16% |
19 Properties |
| 2019 | £69,533 | -0,3% |
27 Properties |
| 2018 | £69,738 | -0,4% |
21 Properties |
| 2017 | £70,032 | -5% |
26 Properties |
| 2016 | £73,723 | 5% |
32 Properties |
| 2015 | £70,122 | -10% |
33 Properties |
| 2014 | £77,151 | 25% |
26 Properties |
| 2013 | £57,955 | -32% |
16 Properties |
| 2012 | £76,408 | 16% |
11 Properties |
| 2011 | £64,419 | -10% |
18 Properties |
| 2010 | £71,041 | -4% |
18 Properties |
| 2009 | £73,633 | -1% |
15 Properties |
| 2008 | £74,468 | -21% |
22 Properties |
| 2007 | £90,470 | 10% |
35 Properties |
| 2006 | £81,612 | 20% |
35 Properties |
| 2005 | £65,044 | 23% |
33 Properties |
| 2004 | £49,829 | 27% |
34 Properties |
| 2003 | £36,554 | -25% |
33 Properties |
| 2002 | £45,605 | 50% |
28 Properties |
| 2001 | £22,618 | -75% |
11 Properties |
| 2000 | £39,662 | 19% |
23 Properties |
| 1999 | £32,283 | 13% |
21 Properties |
| 1998 | £27,950 | 25% |
19 Properties |
| 1997 | £21,078 | -15% |
26 Properties |
| 1996 | £24,239 | -1% |
20 Properties |
| 1995 | £24,509 | - |
16 Properties |
Property Price per Property Type in Cymmer
Here you can find historic sold price data in order to help with your property search.
The average Property Paid Price for specific property types in the last three years are:
| Property Type | Average Sold Price | Sold Properties |
|---|---|---|
| Semi Detached House | £120,584.00 | 52 Semi Detached Houses |
| Detached House | £257,875.00 | 8 Detached Houses |
| Terraced House | £99,303.00 | 28 Terraced Houses |

