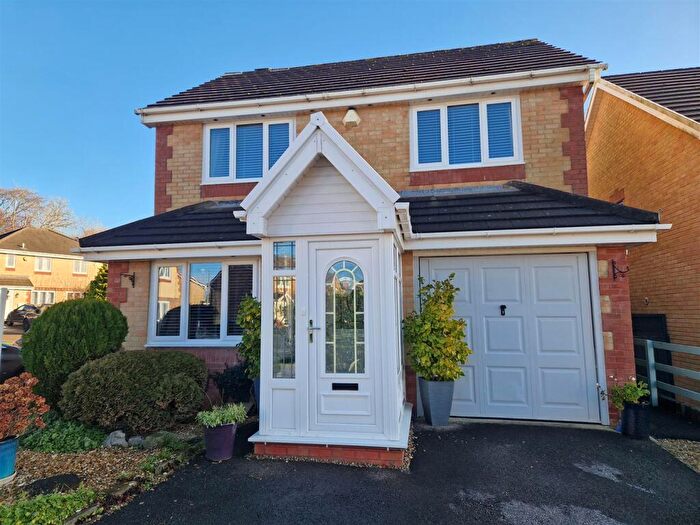
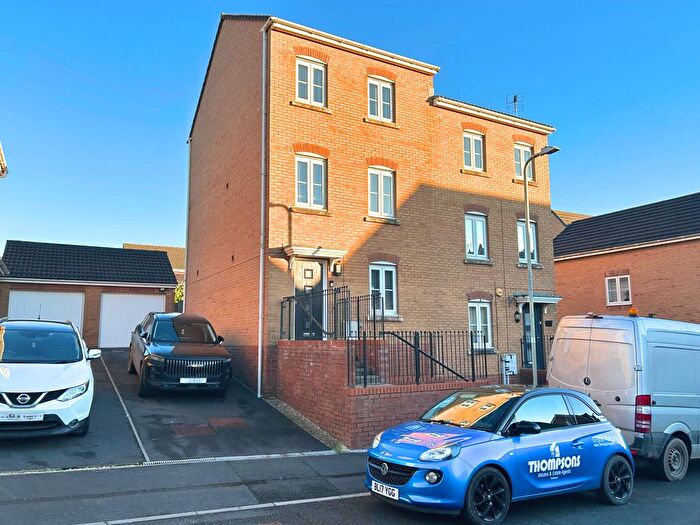
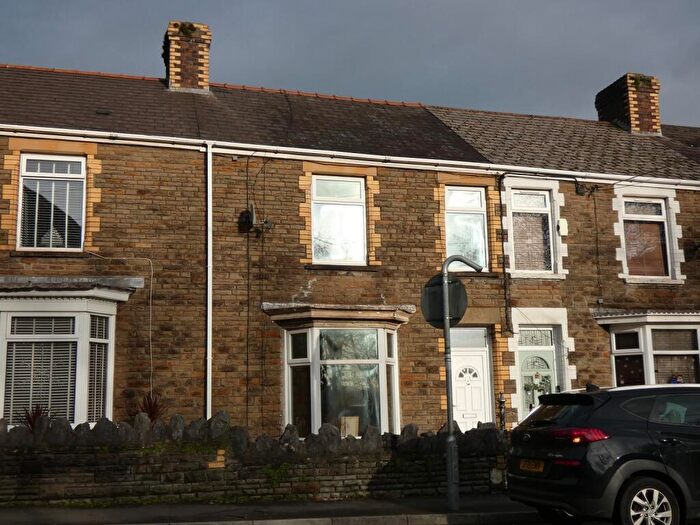
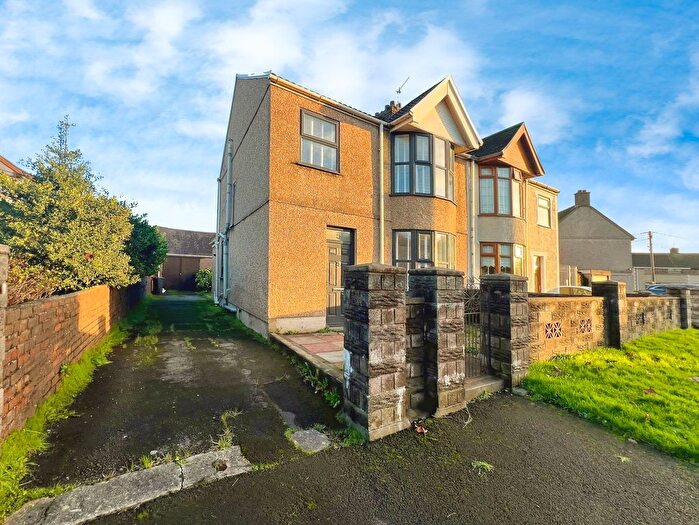
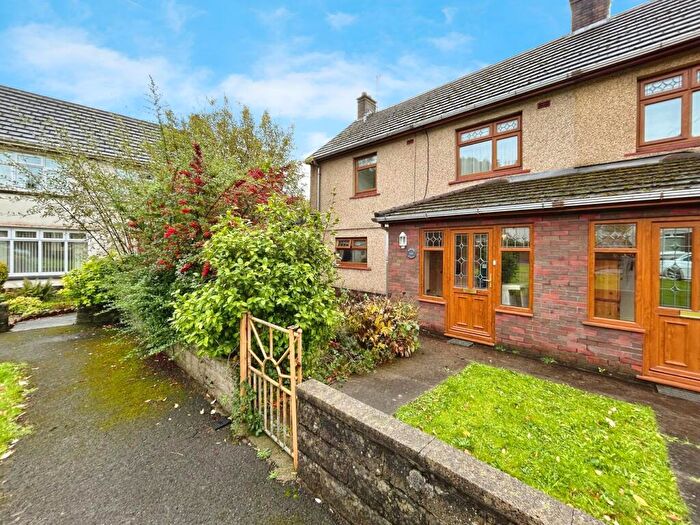
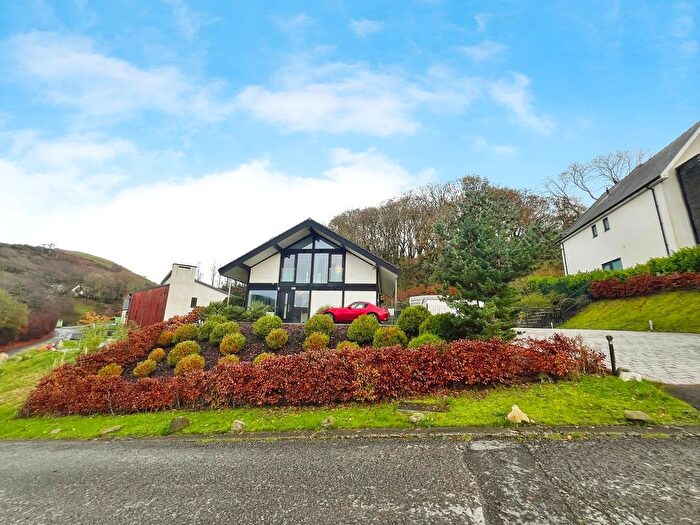
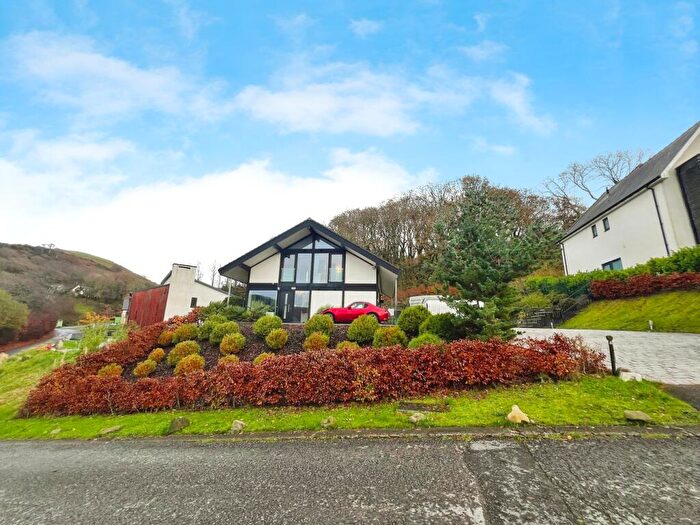
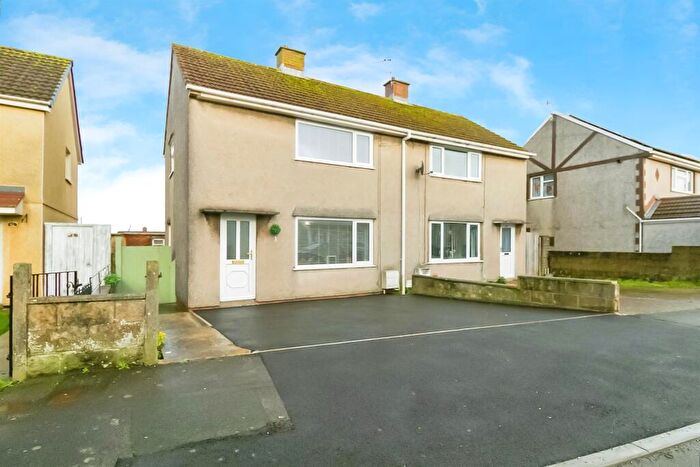
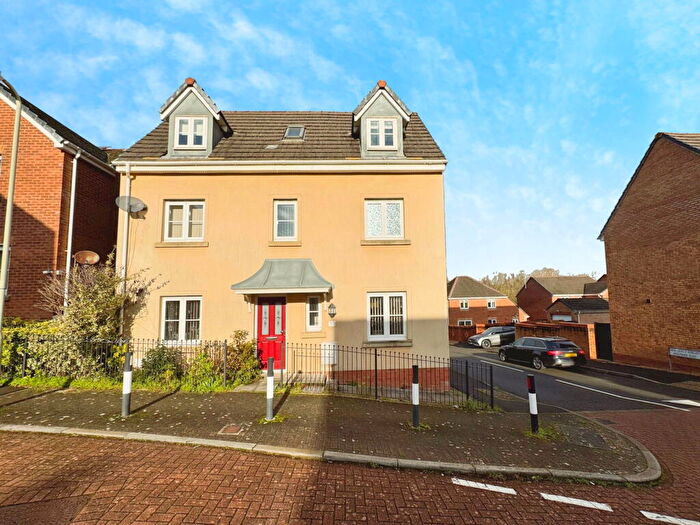
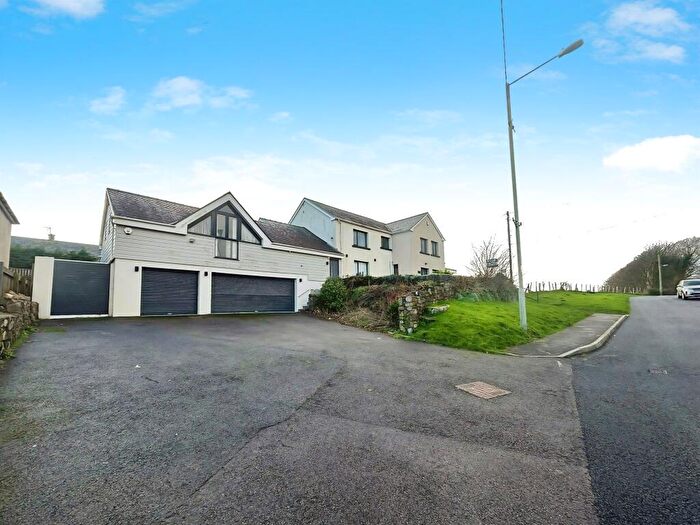
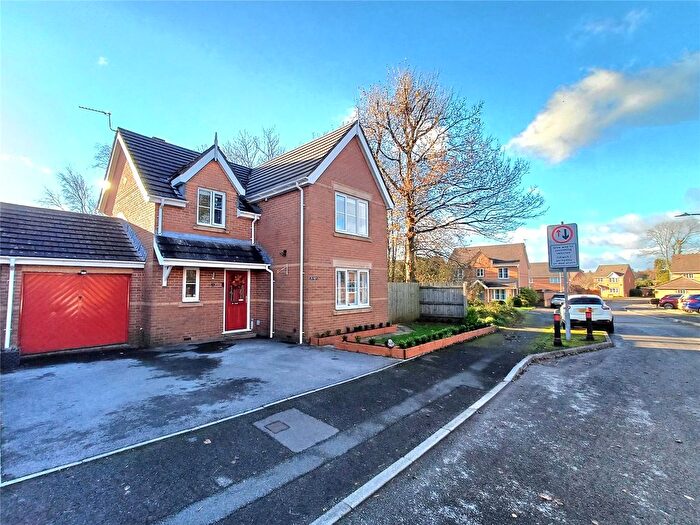
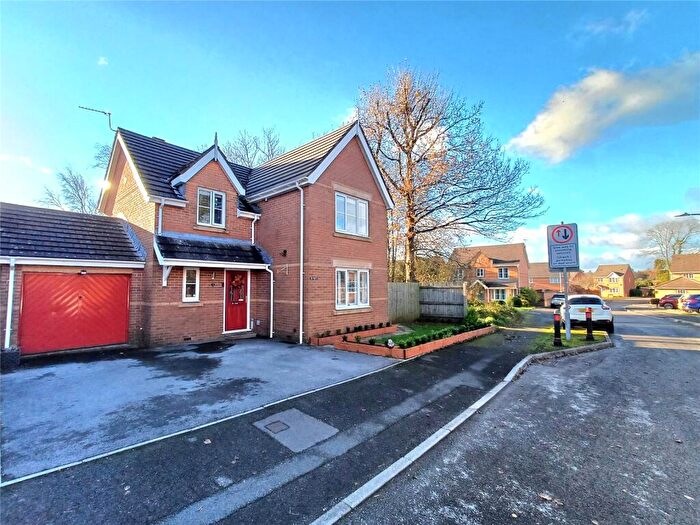
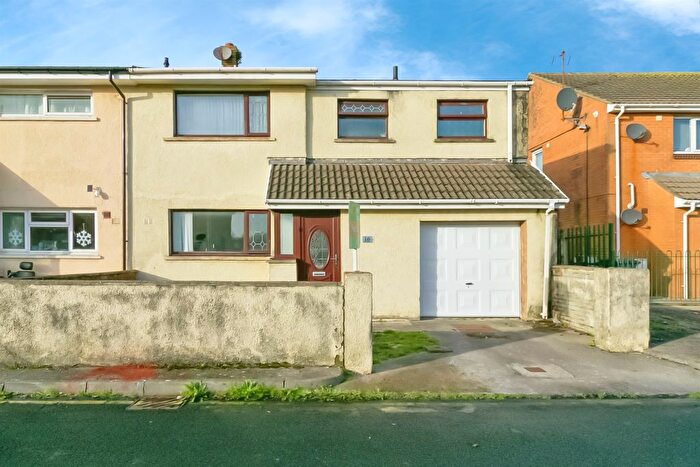
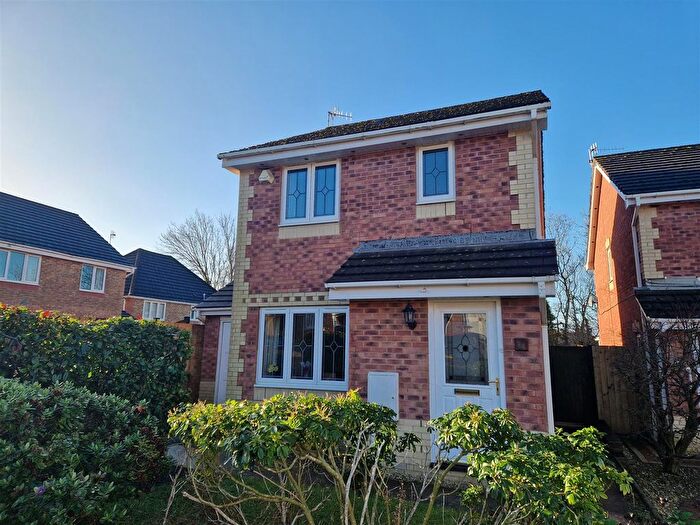
Houses for sale & to rent in Margam, Port Talbot
House Prices in Margam
Properties in Margam have an average house price of £264,697.00 and had 126 Property Transactions within the last 3 years¹.
Margam is an area in Port Talbot, Castell-nedd Port Talbot - Neath Port Talbot with 1,185 households², where the most expensive property was sold for £900,000.00.
Properties for sale in Margam
Roads and Postcodes in Margam
Navigate through our locations to find the location of your next house in Margam, Port Talbot for sale or to rent.
| Streets | Postcodes |
|---|---|
| Abbey Works | SA13 2NG |
| Abbots Close | SA13 2ND SA13 2NE |
| Abbotts Mews | SA13 2PT |
| Beechwood Road | SA13 2AD SA13 2AF |
| Bertha Place | SA13 2AP |
| Bertha Road | SA13 2AW SA13 2AL SA13 2AN |
| Brombil Cottages | SA13 2SR |
| Brynhyfryd Road | SA13 2DF |
| Byass Street | SA13 2DW |
| Cae Brombil | SA13 2AJ |
| Carreg Erw | SA13 2XY |
| Cefn Ffynnon | SA13 2DH |
| Cefn Gwrgan Road | SA13 2BZ |
| Clos Onnen | SA13 2TZ |
| College Green | SA13 2AH |
| Cramic Way | SA13 1RU |
| Cwm Cadno | SA13 2TP |
| Cwrt Buchan Lane | SA13 2PQ |
| Cwrt Y Carw | SA13 2TR SA13 2TS |
| Cwrt Yr Eos | SA13 2UQ |
| Cyncoed Road | SA13 2AE |
| Eglwys Nunnydd | SA13 2PS |
| Fair View | SA13 2NY |
| Ffordd Derwen | SA13 2TX |
| Greenacres | SA13 2PP |
| Harbourside Road | SA13 1SB |
| Heol Y Gwrgan | SA13 2DG |
| Kenfig Industrial Estate | SA13 2PE SA13 2PW |
| Knights Road | SA13 2DT SA13 2DU SA13 2DY |
| Knox Street | SA13 2DP SA13 2DR |
| Lawnt Y Marlat | SA13 2BH |
| Llewellyns Quay | SA13 1RF |
| Llwyn Arian | SA13 2UP |
| Llys Castell | SA13 2UX |
| Llys Y Ddraenog | SA13 2TQ |
| Longland Lane | SA13 2NR SA13 2NS |
| Margam Road | SA13 2DB SA13 2DE SA13 2NW |
| Maximin Road | SA13 2EA |
| Min Y Coed | SA13 2TE |
| Morfa Road | SA13 2DL SA13 2DN |
| Nant Y Wiwer | SA13 2XX |
| New Cottages | SA13 2TA |
| North Bank Road | SA13 1RE |
| Old Park Road | SA13 2TG |
| Pant Y Rhedyn | SA13 2SZ |
| Saltoun Street | SA13 2DS |
| St Davids Park | SA13 2PA SA13 2PU |
| Ten Acre Wood | SA13 2SU |
| The Docks | SA13 1RA SA13 1RB SA13 1RH SA13 1RS |
| Tir Celyn | SA13 2UZ |
| Tollgate Road | SA13 2DD |
| Tudor Grove | SA13 2ST |
| Ty Ffald Cottages | SA13 2TD |
| Tyr Groes Drive | SA13 2AG |
| Water Street | SA13 2PB SA13 2PL |
| SA13 2PD SA13 2TF SA13 2TL SA13 2TW SA13 1SA SA13 2DX SA13 2NF SA13 2NP SA13 2NU SA13 2PH SA13 2PN SA13 2SP SA13 2SY SA13 2TB SA13 2TH SA13 2TJ SA13 2TN SA13 2UA |
Transport near Margam
-
Port Talbot Parkway Station
-
Pyle Station
-
Baglan Station
-
Garth (Mid-Glamorgan) Station
-
Maesteg (Ewenny Road) Station
-
Maesteg Station
- FAQ
- Price Paid By Year
- Property Type Price
Frequently asked questions about Margam
What is the average price for a property for sale in Margam?
The average price for a property for sale in Margam is £264,697. This amount is 66% higher than the average price in Port Talbot. There are 2,165 property listings for sale in Margam.
What streets have the most expensive properties for sale in Margam?
The streets with the most expensive properties for sale in Margam are Pant Y Rhedyn at an average of £501,250, Carreg Erw at an average of £435,000 and Llys Y Ddraenog at an average of £405,666.
What streets have the most affordable properties for sale in Margam?
The streets with the most affordable properties for sale in Margam are Heol Y Gwrgan at an average of £99,750, Saltoun Street at an average of £122,800 and Margam Road at an average of £129,000.
Which train stations are available in or near Margam?
Some of the train stations available in or near Margam are Port Talbot Parkway, Pyle and Baglan.
Property Price Paid in Margam by Year
The average sold property price by year was:
| Year | Average Sold Price | Price Change |
Sold Properties
|
|---|---|---|---|
| 2025 | £222,180 | -25% |
21 Properties |
| 2024 | £277,109 | 17% |
27 Properties |
| 2023 | £229,538 | -37% |
39 Properties |
| 2022 | £314,157 | 17% |
39 Properties |
| 2021 | £260,444 | 1% |
36 Properties |
| 2020 | £256,978 | 15% |
38 Properties |
| 2019 | £219,044 | 16% |
57 Properties |
| 2018 | £184,978 | -7% |
30 Properties |
| 2017 | £197,844 | 7% |
36 Properties |
| 2016 | £183,630 | 3% |
30 Properties |
| 2015 | £178,996 | 6% |
59 Properties |
| 2014 | £167,798 | -5% |
32 Properties |
| 2013 | £176,301 | 11% |
38 Properties |
| 2012 | £157,060 | 4% |
29 Properties |
| 2011 | £150,454 | -8% |
25 Properties |
| 2010 | £162,316 | 1% |
42 Properties |
| 2009 | £160,443 | -8% |
46 Properties |
| 2008 | £173,501 | -17% |
32 Properties |
| 2007 | £202,563 | 7% |
66 Properties |
| 2006 | £188,534 | 12% |
66 Properties |
| 2005 | £166,702 | 4% |
66 Properties |
| 2004 | £159,292 | 18% |
53 Properties |
| 2003 | £129,872 | 8% |
85 Properties |
| 2002 | £119,507 | 10% |
157 Properties |
| 2001 | £107,242 | 8% |
178 Properties |
| 2000 | £98,348 | 24% |
136 Properties |
| 1999 | £74,420 | 30% |
70 Properties |
| 1998 | £52,315 | -22% |
16 Properties |
| 1997 | £63,852 | 43% |
19 Properties |
| 1996 | £36,615 | -20% |
13 Properties |
| 1995 | £44,094 | - |
16 Properties |
Property Price per Property Type in Margam
Here you can find historic sold price data in order to help with your property search.
The average Property Paid Price for specific property types in the last three years are:
| Property Type | Average Sold Price | Sold Properties |
|---|---|---|
| Semi Detached House | £174,840.00 | 60 Semi Detached Houses |
| Detached House | £385,226.00 | 53 Detached Houses |
| Terraced House | £226,845.00 | 10 Terraced Houses |
| Flat | £58,666.00 | 3 Flats |

