
Houses for sale & to rent in Swansea, Castell-nedd Port Talbot - Neath Port Talbot
House Prices in Swansea
Properties in Swansea have an average house price of £189,490.00 and had 882 Property Transactions within the last 3 years.¹
Swansea is an area in Castell-nedd Port Talbot - Neath Port Talbot with 7,547 households², where the most expensive property was sold for £930,000.00.
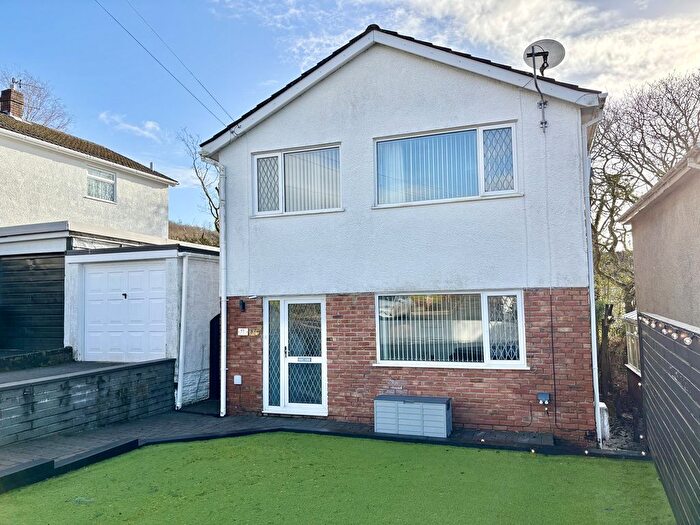
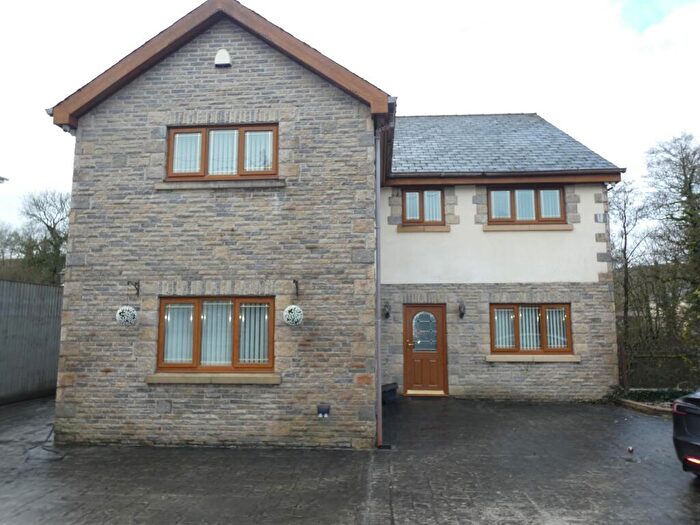
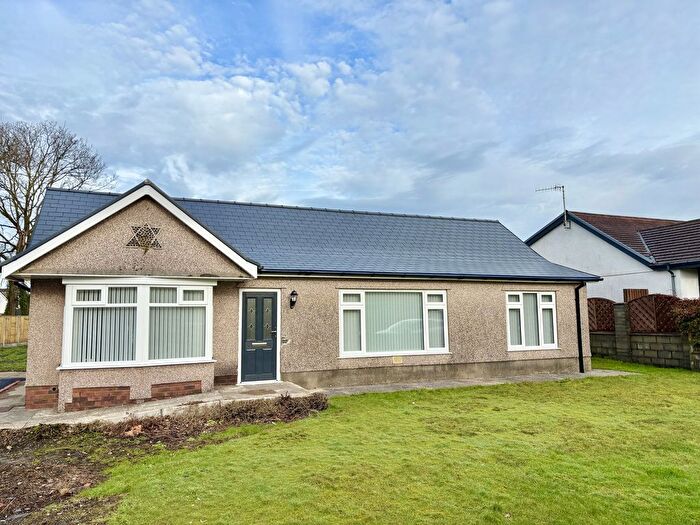
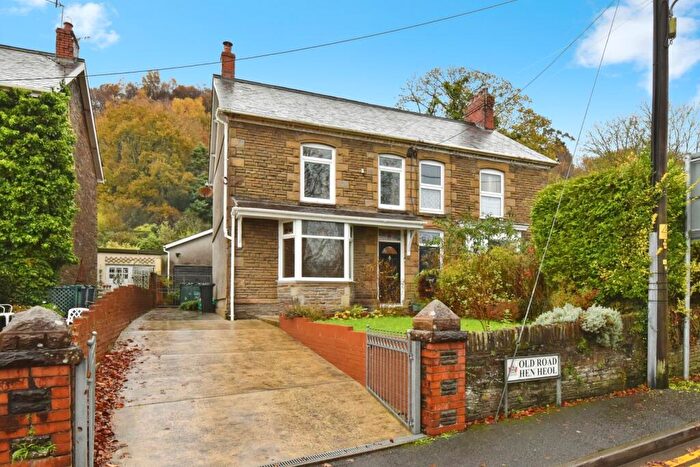
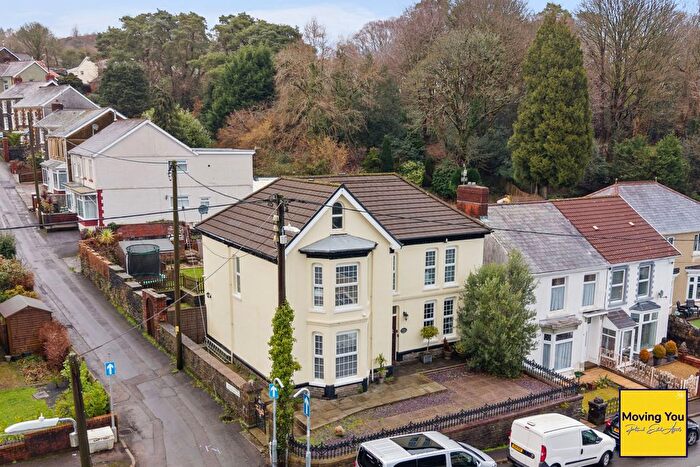
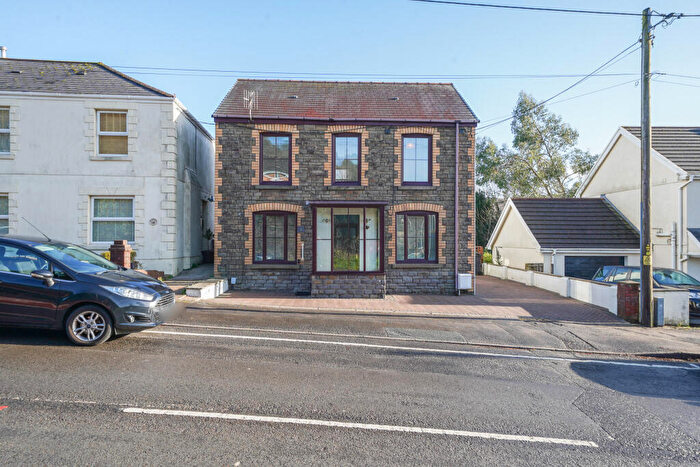
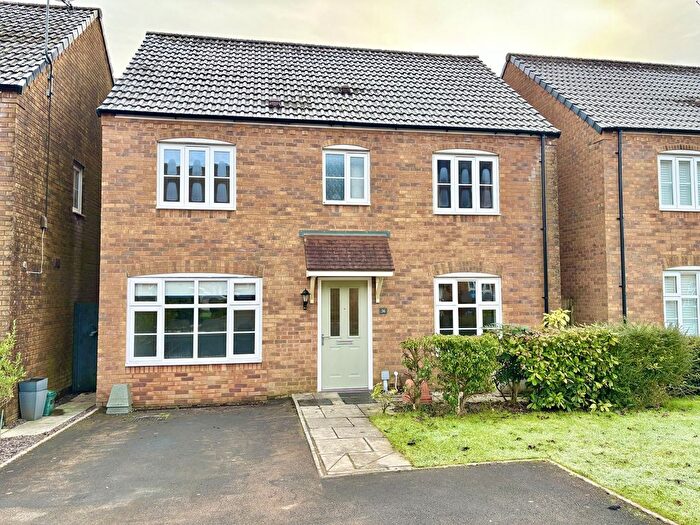
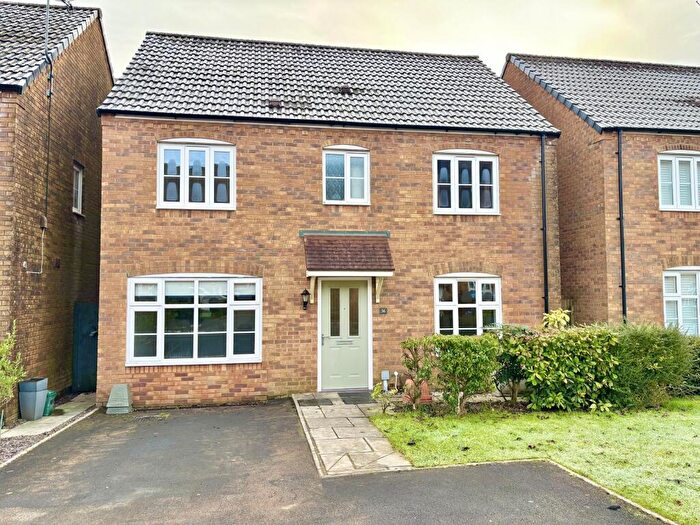
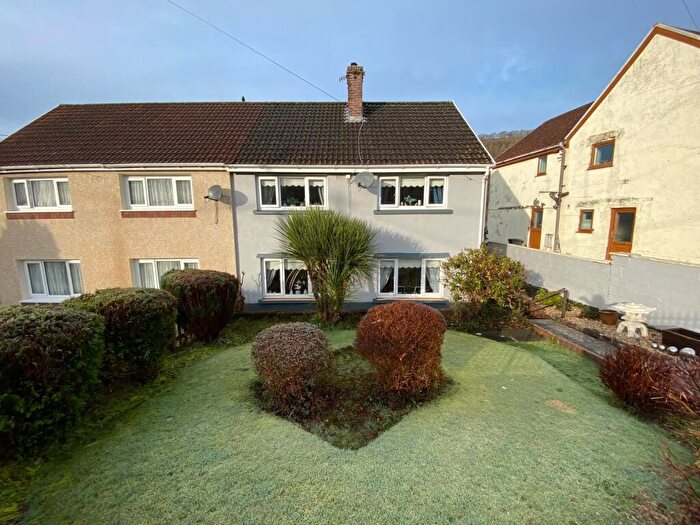
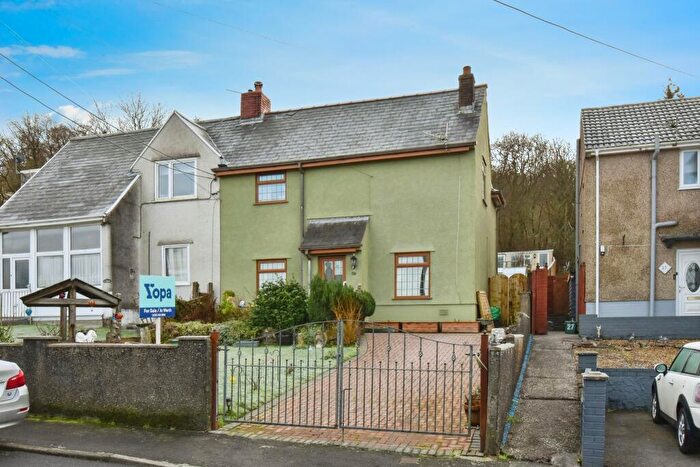
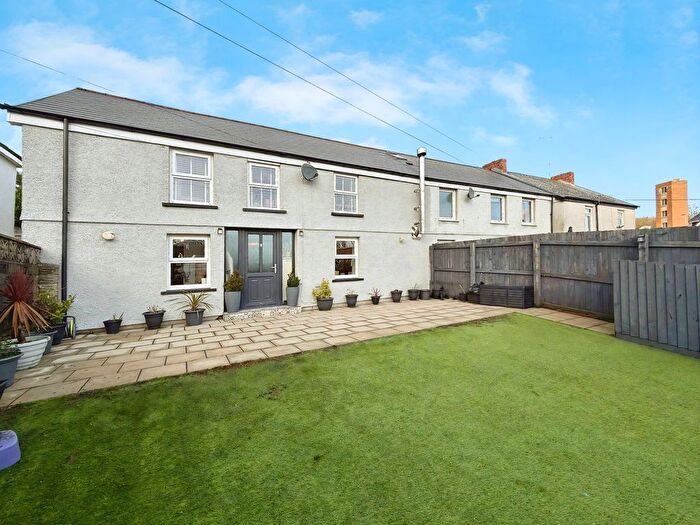
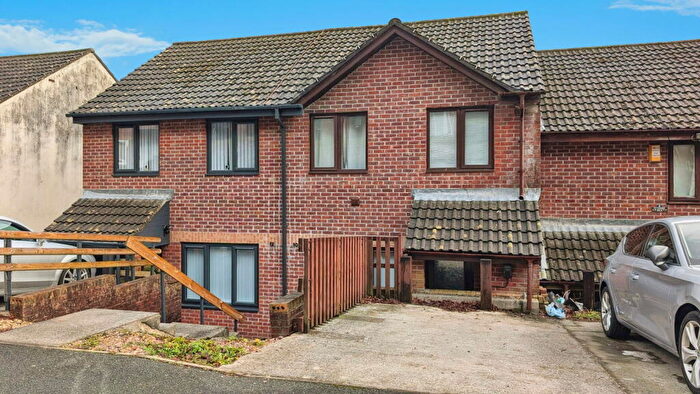
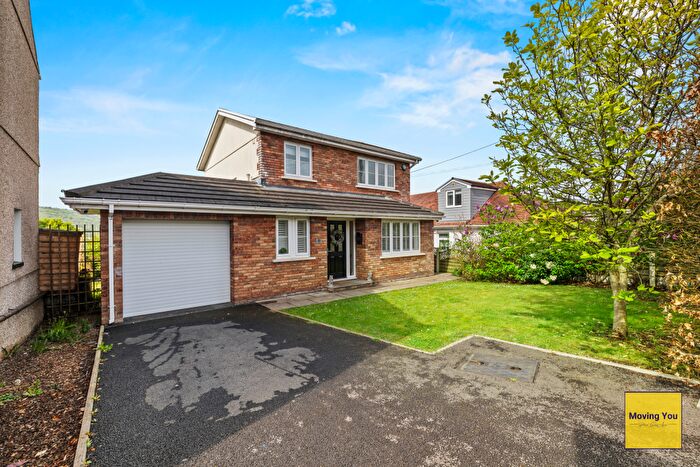
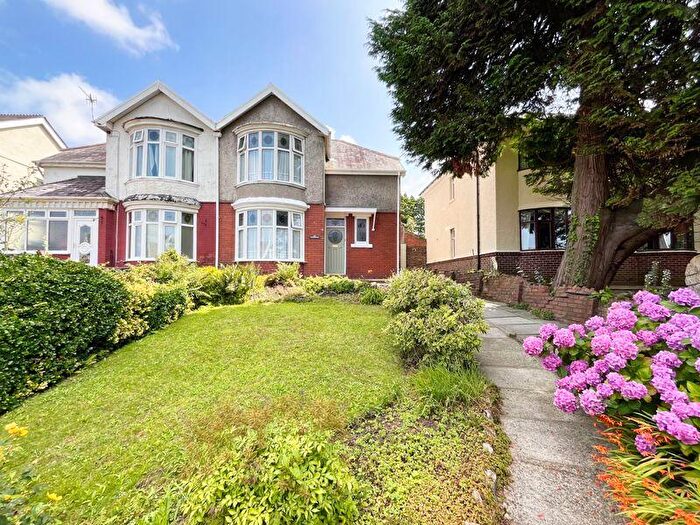
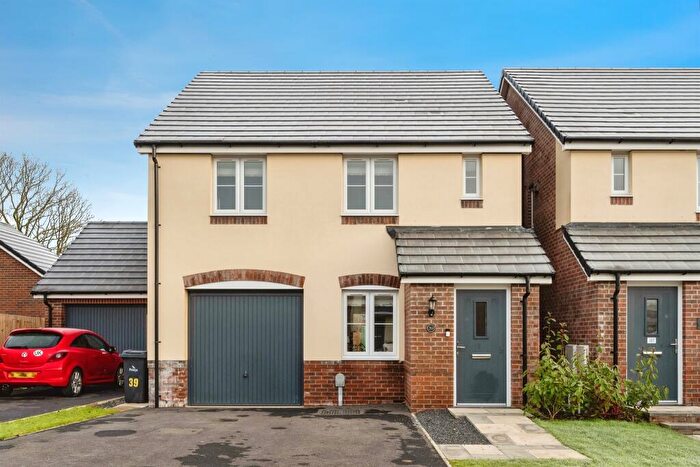
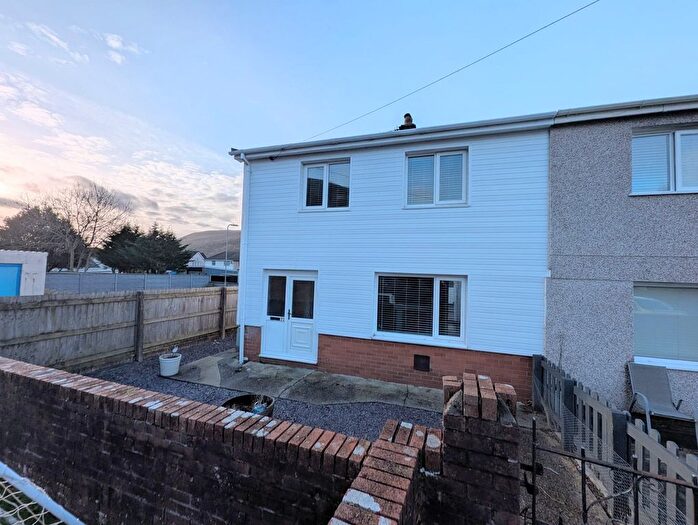
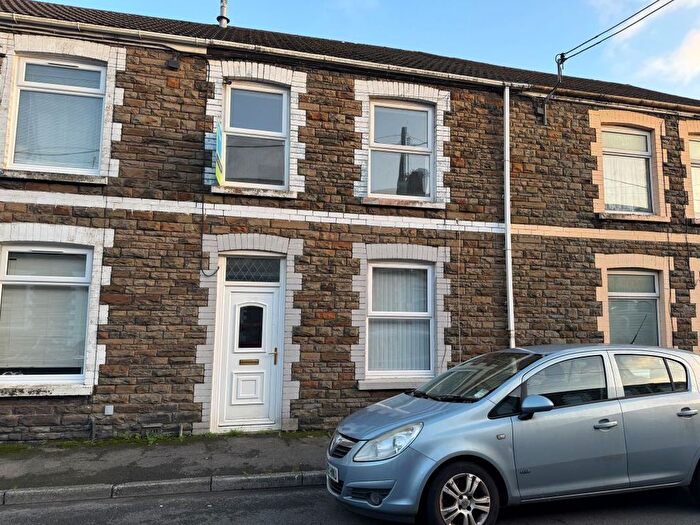
Properties for sale in Swansea


![]()
If you are looking to sell your house, let it out, or receive a property valuation, an expert can help you.
Click the button below to get started.


Neighbourhoods in Swansea
Navigate through our locations to find the location of your next house in Swansea, Castell-nedd Port Talbot - Neath Port Talbot for sale or to rent.
Transport in Swansea
Please see below transportation links in this area:
-
 Neath Station
 -
Skewen Station
-
Llansamlet Station
-
Briton Ferry Station
-
Pantyffynnon Station
-
Ammanford Station
-
Baglan Station
-
Swansea Station
-
Pontarddulais Station
-
Llandybie Station
- FAQ
- Price Paid By Year
- Property Type Price
Frequently asked questions about Swansea
What is the average price for a property for sale in Swansea?
The average price for a property for sale in Swansea is £189,490. This amount is 14% higher than the average price in Castell-nedd Port Talbot - Neath Port Talbot. There are more than 10,000 property listings for sale in Swansea.
What locations have the most expensive properties for sale in Swansea?
The locations with the most expensive properties for sale in Swansea are Rhos at an average of £254,374, Allt-wen at an average of £221,157 and Pontardawe at an average of £202,374.
What locations have the most affordable properties for sale in Swansea?
The locations with the most affordable properties for sale in Swansea are Ystalyfera at an average of £126,960, Trebanos at an average of £157,131 and Godrer Graig at an average of £167,623.
Which train stations are available in or near Swansea?
Some of the train stations available in or near Swansea are Neath, Skewen and Llansamlet.
Property Price Paid in Swansea by Year
The average sold property price by year was:
| Year | Average Sold Price | Price Change |
Sold Properties
|
|---|---|---|---|
| 2025 | £204,640 | 6% |
155 Properties |
| 2024 | £193,178 | 2% |
236 Properties |
| 2023 | £189,981 | 7% |
234 Properties |
| 2022 | £176,520 | 11% |
257 Properties |
| 2021 | £157,074 | -2% |
311 Properties |
| 2020 | £160,356 | 5% |
273 Properties |
| 2019 | £151,783 | 11% |
302 Properties |
| 2018 | £134,410 | -6% |
264 Properties |
| 2017 | £142,708 | 3% |
321 Properties |
| 2016 | £138,930 | 5% |
275 Properties |
| 2015 | £131,632 | 6% |
329 Properties |
| 2014 | £123,095 | 2% |
294 Properties |
| 2013 | £120,402 | 4% |
226 Properties |
| 2012 | £116,086 | 0,3% |
200 Properties |
| 2011 | £115,769 | -4% |
199 Properties |
| 2010 | £119,867 | 1% |
198 Properties |
| 2009 | £118,558 | -16% |
178 Properties |
| 2008 | £137,713 | 2% |
168 Properties |
| 2007 | £134,300 | 12% |
320 Properties |
| 2006 | £118,669 | 5% |
286 Properties |
| 2005 | £112,576 | 20% |
248 Properties |
| 2004 | £89,556 | 25% |
259 Properties |
| 2003 | £67,102 | 17% |
324 Properties |
| 2002 | £55,559 | 5% |
338 Properties |
| 2001 | £52,985 | 13% |
239 Properties |
| 2000 | £45,916 | 2% |
247 Properties |
| 1999 | £44,913 | 4% |
259 Properties |
| 1998 | £43,033 | -2% |
271 Properties |
| 1997 | £44,027 | 15% |
261 Properties |
| 1996 | £37,401 | -11% |
198 Properties |
| 1995 | £41,543 | - |
211 Properties |
Property Price per Property Type in Swansea
Here you can find historic sold price data in order to help with your property search.
The average Property Paid Price for specific property types in the last three years are:
| Property Type | Average Sold Price | Sold Properties |
|---|---|---|
| Semi Detached House | £160,009.00 | 363 Semi Detached Houses |
| Detached House | £266,588.00 | 311 Detached Houses |
| Terraced House | £128,916.00 | 195 Terraced Houses |
| Flat | £76,880.00 | 13 Flats |