Houses for sale & to rent in Marl, Conwy
House Prices in Marl
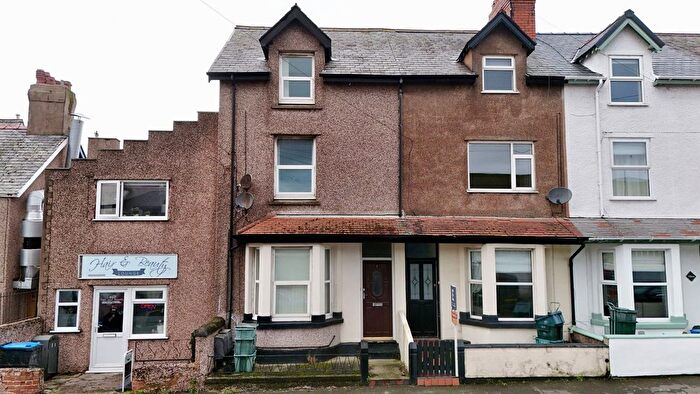
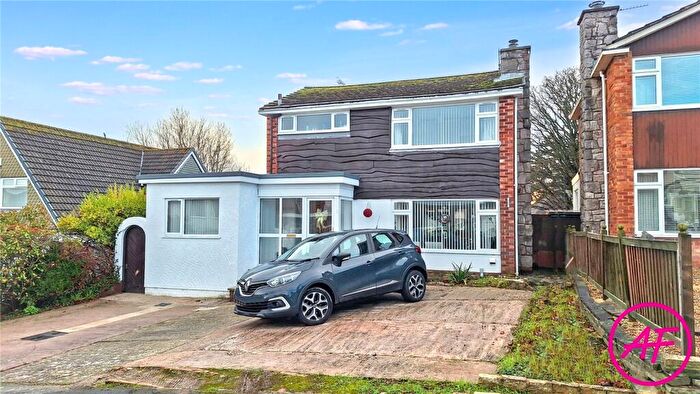
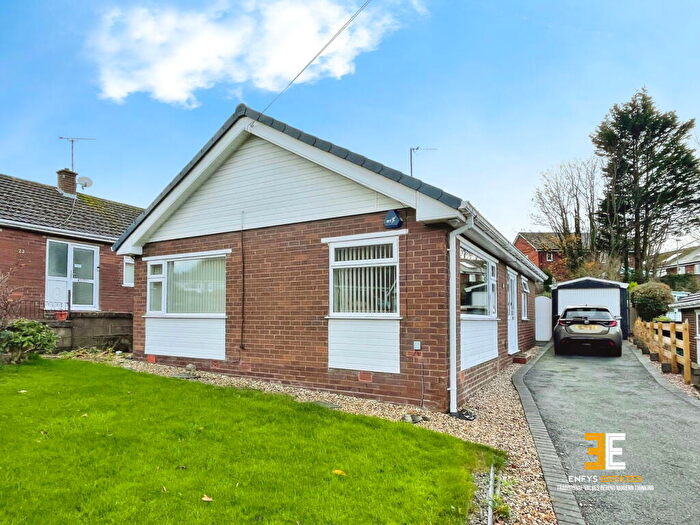
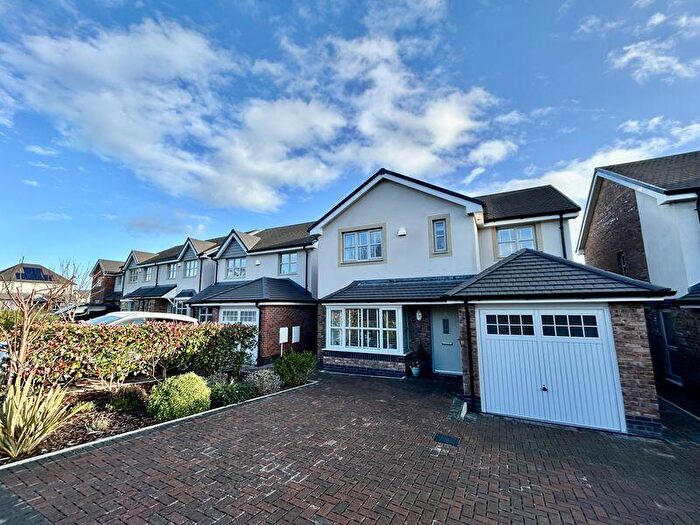
Properties in Marl have an average house price of £295,239.00 and had 71 Property Transactions within the last 3 years¹.
Marl is an area in Conwy, Conwy - Conwy with 808 households², where the most expensive property was sold for £700,000.00.
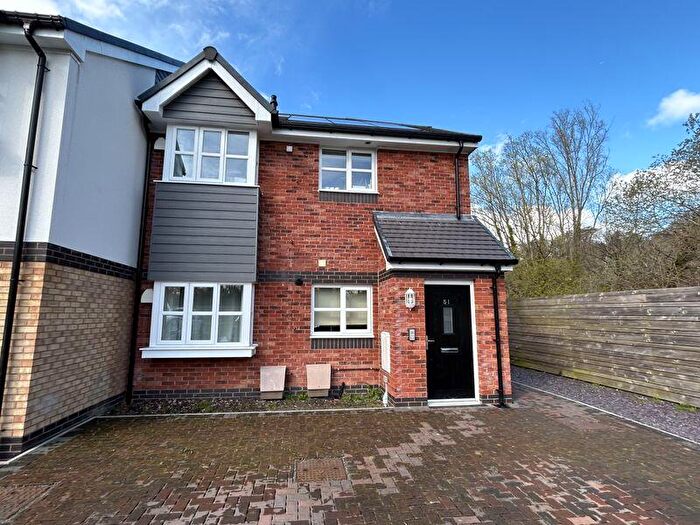
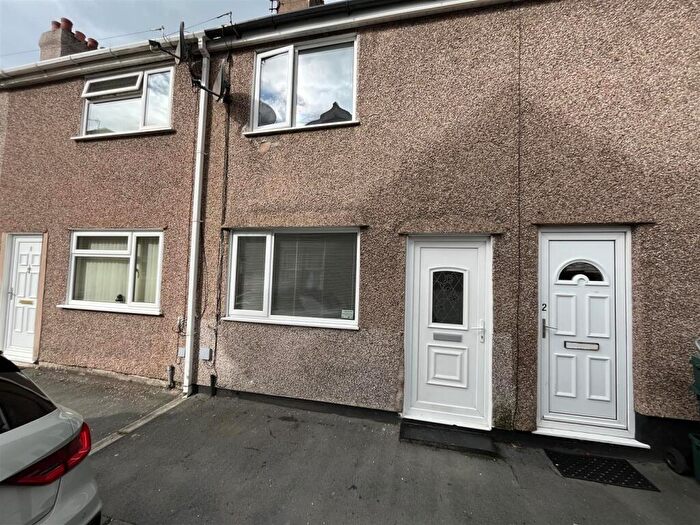
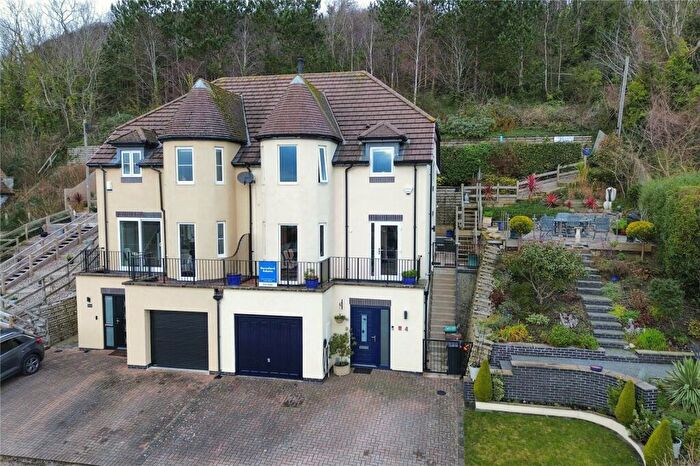
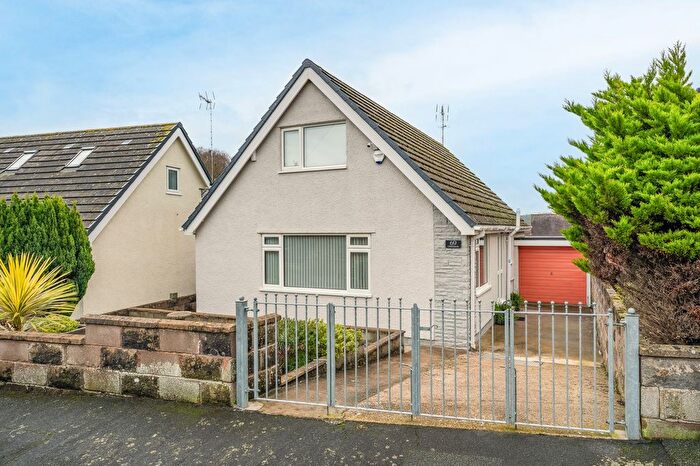
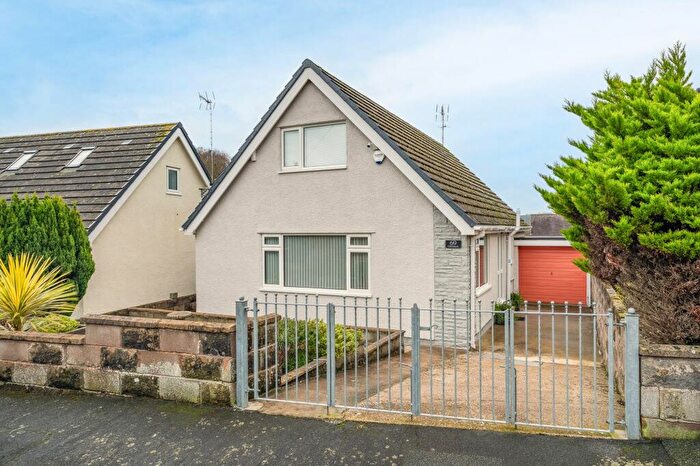
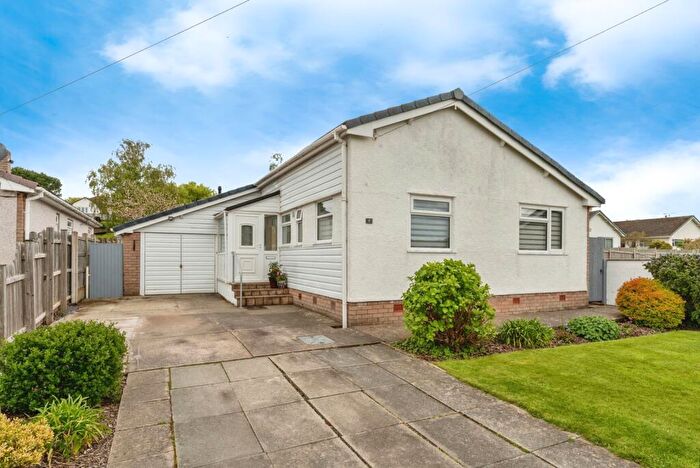
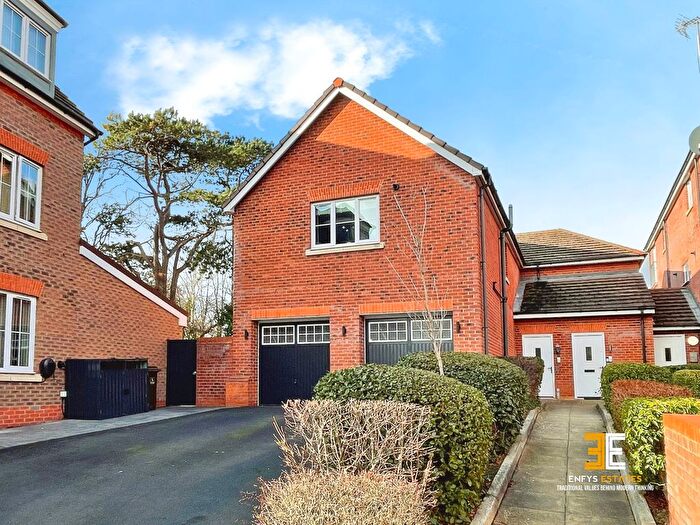
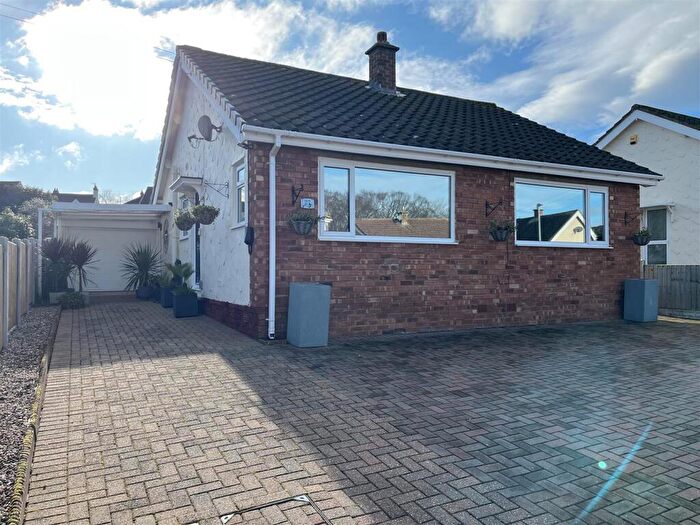
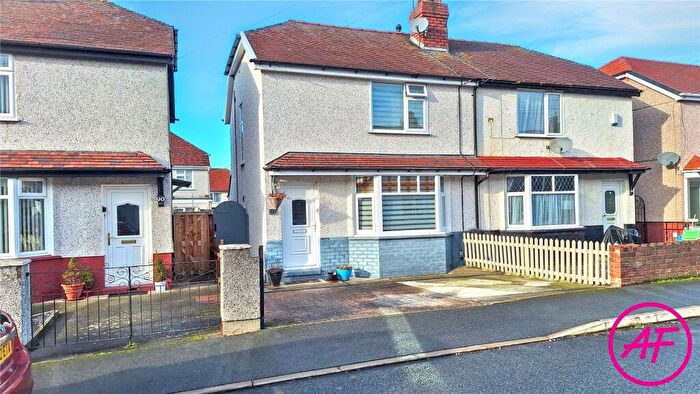
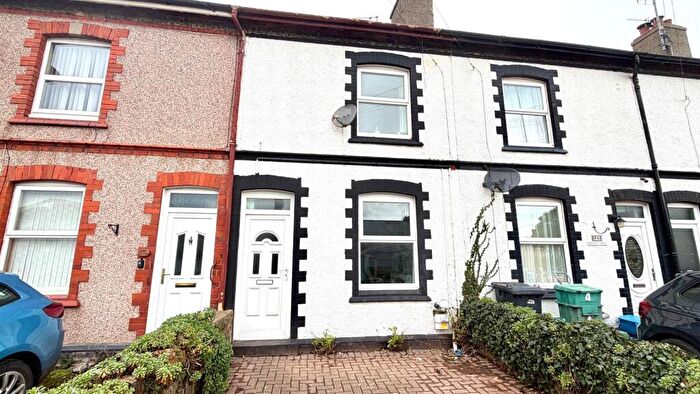
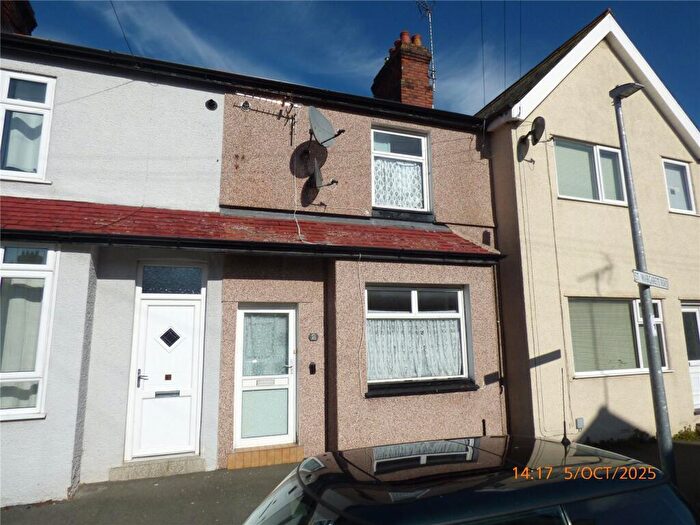
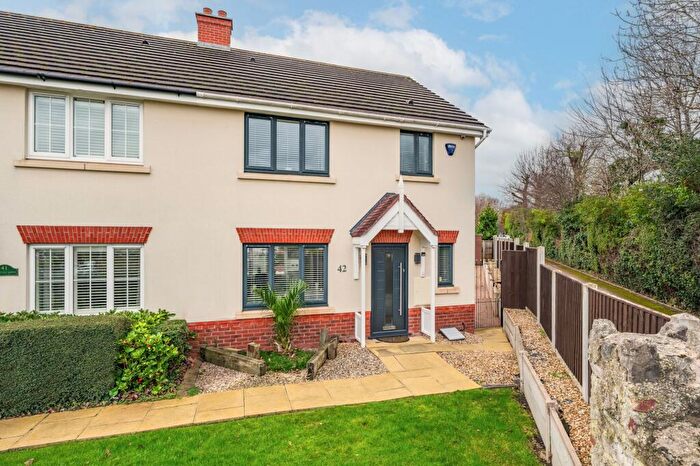
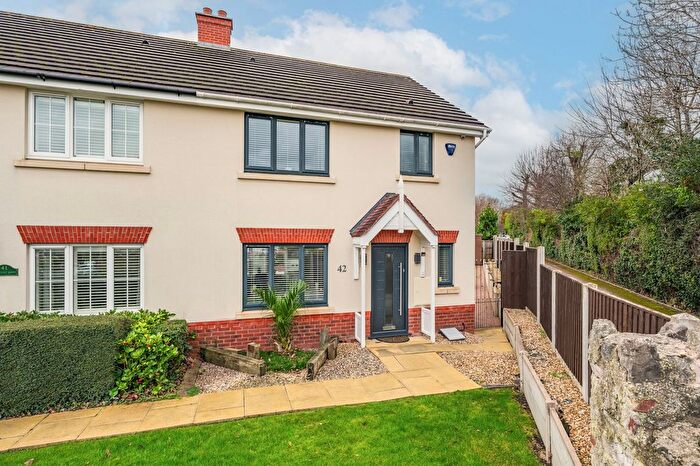
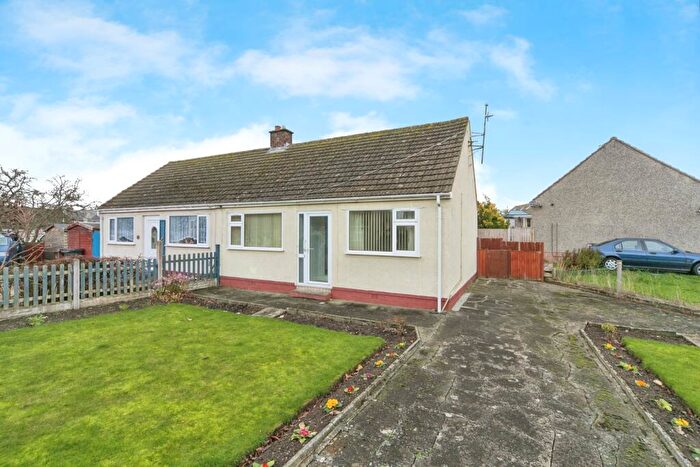
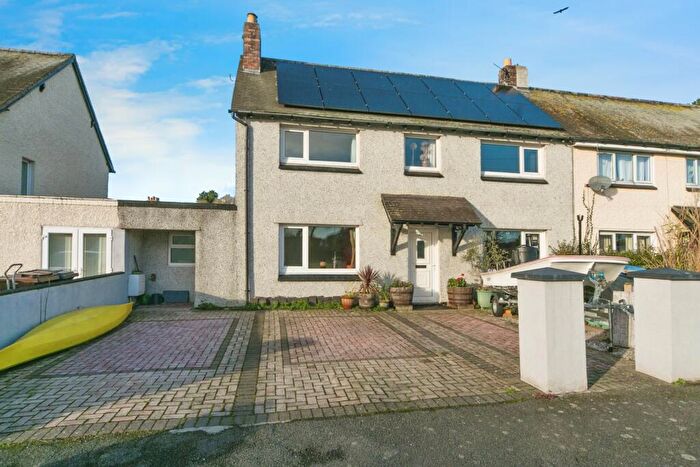
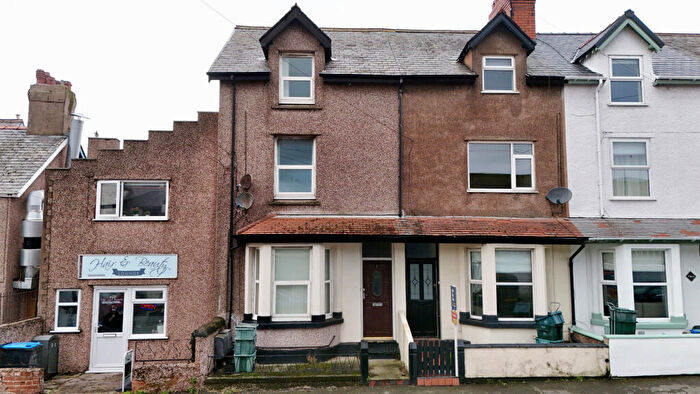
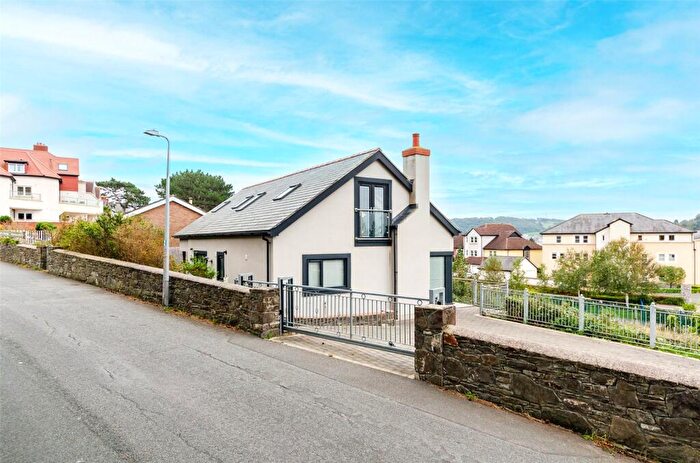
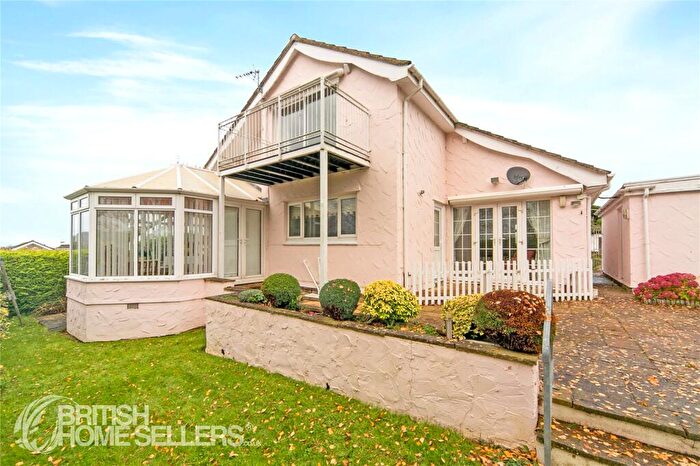
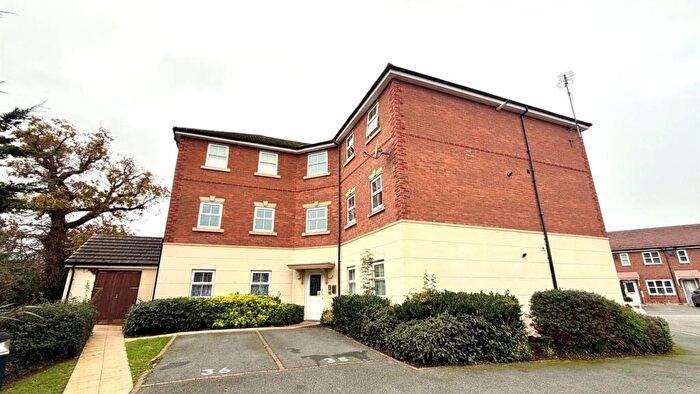
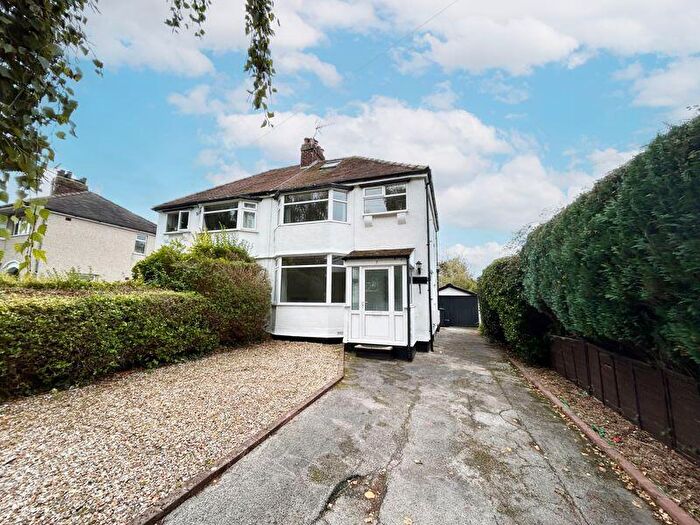
Properties for sale in Marl
Roads and Postcodes in Marl
Navigate through our locations to find the location of your next house in Marl, Conwy for sale or to rent.
| Streets | Postcodes |
|---|---|
| Albert Drive | LL31 9RH LL31 9RL LL31 9SP LL31 9SR LL31 9YY |
| Albert Drive Gardens | LL31 9RE |
| Broad Street | LL31 9HL |
| Bron Y Gaer | LL31 9AQ |
| Bryn Y Coed | LL31 9RW |
| Chapelfield | LL31 9BF |
| Cwm Estyn | LL31 9RB |
| Ferry Farm Road | LL31 9SF |
| Glan Y Mor Road | LL31 9RU LL31 9RY |
| Glan Ymor Road | LL31 9TS |
| Glanrafon Terrace | LL31 9TU |
| Hillcrest Road | LL31 9TG |
| Llwyn Estyn | LL31 9RA |
| Llys Wynne | LL31 9HD |
| Lon Y Gaer | LL31 9RG |
| Maes Glas | LL31 9SW |
| Maes Y Coed | LL31 9NQ |
| Marl Crescent | LL31 9HP |
| Marl Drive | LL31 9YX |
| Marl Gardens | LL31 9LZ |
| Marl Lane | LL31 9AJ |
| Marl View Terrace | LL31 9BJ |
| Overlea Avenue | LL31 9PT LL31 9RN LL31 9TA LL31 9TD |
| Overlea Crescent | LL31 9TB |
| Overlea Gardens | LL31 9RP |
| Pant Teg | LL31 9PS |
| Pen Y Gaer | LL31 9RF |
| Pentywyn Road | LL31 9TF LL31 9TL |
| Royal Welsh Way | LL30 1RS |
| Shamrock Court | LL31 9LQ |
| Shamrock Terrace | LL31 9BQ |
| St Georges Drive | LL31 9PP LL31 9PR LL31 9PU |
| St Hilarys Drive | LL31 9SS |
| Tan Refail | LL31 9AX |
| Tan Y Berllan | LL31 9RD |
| Tan Y Gaer | LL31 9YU |
| Tir Estyn | LL31 9PY |
| Vardre View Terrace | LL31 9TE |
| Warren Drive | LL31 9ST LL31 9SY LL31 9TN |
| Warren Road | LL31 9SU |
| LL31 9HE |
Transport near Marl
- FAQ
- Price Paid By Year
- Property Type Price
Frequently asked questions about Marl
What is the average price for a property for sale in Marl?
The average price for a property for sale in Marl is £295,239. This amount is 3% lower than the average price in Conwy. There are 706 property listings for sale in Marl.
What streets have the most expensive properties for sale in Marl?
The streets with the most expensive properties for sale in Marl are Overlea Avenue at an average of £395,000, Warren Drive at an average of £378,888 and St Hilarys Drive at an average of £376,571.
What streets have the most affordable properties for sale in Marl?
The streets with the most affordable properties for sale in Marl are Shamrock Terrace at an average of £185,000, Bryn Y Coed at an average of £206,000 and Tan Y Berllan at an average of £220,500.
Which train stations are available in or near Marl?
Some of the train stations available in or near Marl are Llandudno Junction, Deganwy and Conwy.
Property Price Paid in Marl by Year
The average sold property price by year was:
| Year | Average Sold Price | Price Change |
Sold Properties
|
|---|---|---|---|
| 2025 | £292,875 | -1% |
24 Properties |
| 2024 | £296,400 | - |
25 Properties |
| 2023 | £296,500 | 2% |
22 Properties |
| 2022 | £289,732 | -5% |
26 Properties |
| 2021 | £304,520 | 19% |
43 Properties |
| 2020 | £247,021 | 19% |
46 Properties |
| 2019 | £200,129 | -10% |
60 Properties |
| 2018 | £221,142 | 2% |
33 Properties |
| 2017 | £217,614 | -2% |
29 Properties |
| 2016 | £221,861 | 21% |
35 Properties |
| 2015 | £175,214 | -7% |
28 Properties |
| 2014 | £188,290 | 2% |
43 Properties |
| 2013 | £185,410 | -5% |
35 Properties |
| 2012 | £194,393 | -4% |
37 Properties |
| 2011 | £201,313 | -3% |
22 Properties |
| 2010 | £207,973 | 17% |
21 Properties |
| 2009 | £171,767 | -24% |
23 Properties |
| 2008 | £212,366 | 8% |
15 Properties |
| 2007 | £194,750 | -5% |
36 Properties |
| 2006 | £203,828 | 1% |
34 Properties |
| 2005 | £202,744 | 18% |
25 Properties |
| 2004 | £166,373 | 8% |
39 Properties |
| 2003 | £152,359 | 14% |
33 Properties |
| 2002 | £131,018 | 32% |
43 Properties |
| 2001 | £88,618 | 15% |
39 Properties |
| 2000 | £75,157 | -4% |
46 Properties |
| 1999 | £78,083 | 13% |
45 Properties |
| 1998 | £68,024 | -12% |
50 Properties |
| 1997 | £76,079 | 11% |
41 Properties |
| 1996 | £67,580 | 12% |
40 Properties |
| 1995 | £59,270 | - |
25 Properties |
Property Price per Property Type in Marl
Here you can find historic sold price data in order to help with your property search.
The average Property Paid Price for specific property types in the last three years are:
| Property Type | Average Sold Price | Sold Properties |
|---|---|---|
| Semi Detached House | £256,517.00 | 29 Semi Detached Houses |
| Detached House | £341,681.00 | 33 Detached Houses |
| Terraced House | £345,500.00 | 3 Terraced Houses |
| Flat | £201,833.00 | 6 Flats |

