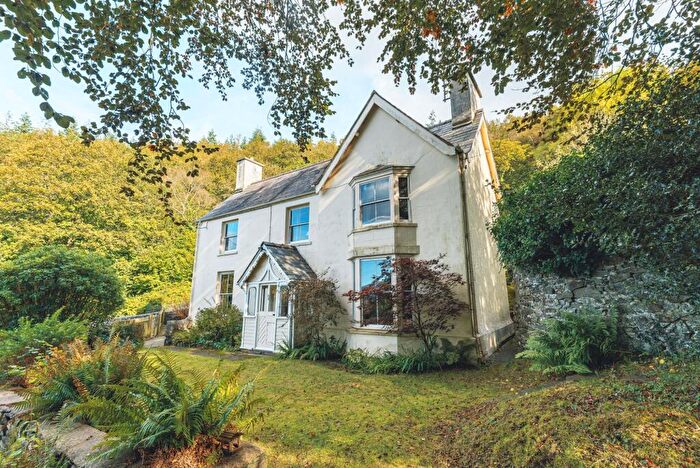
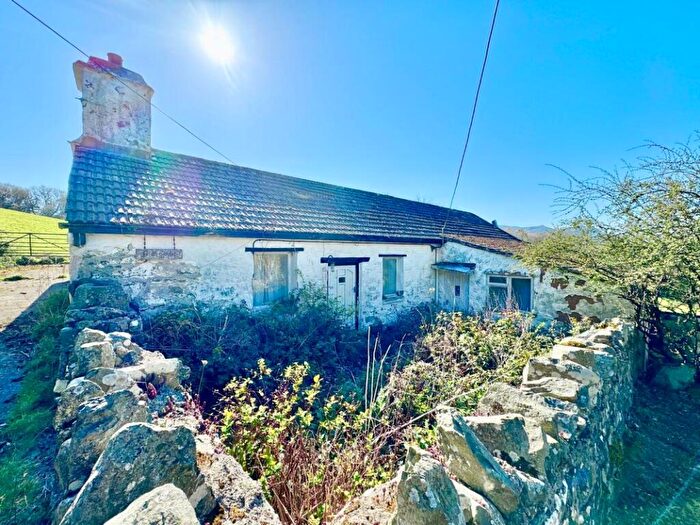
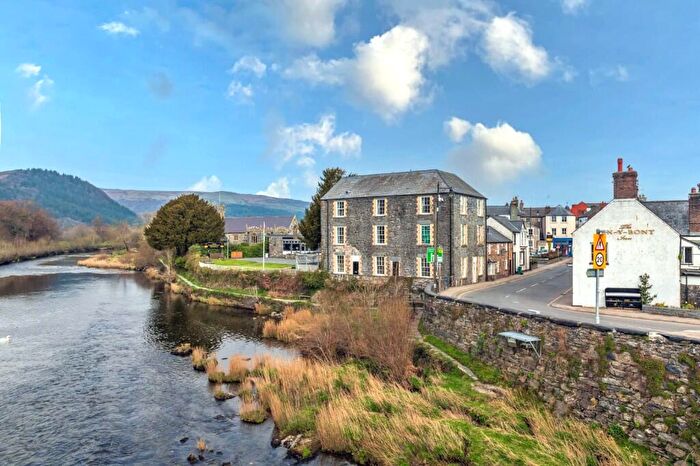
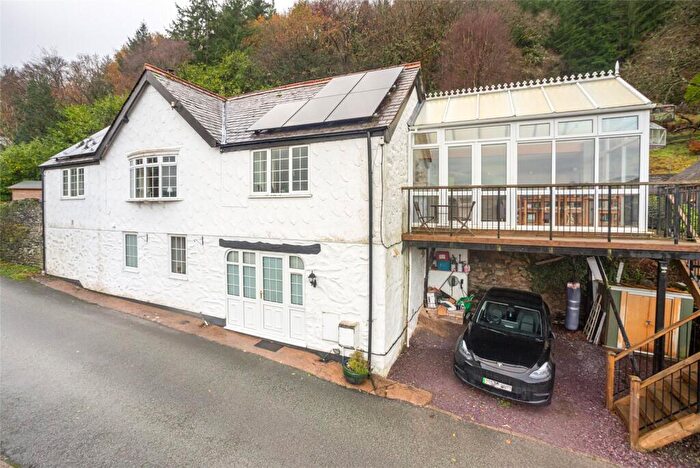
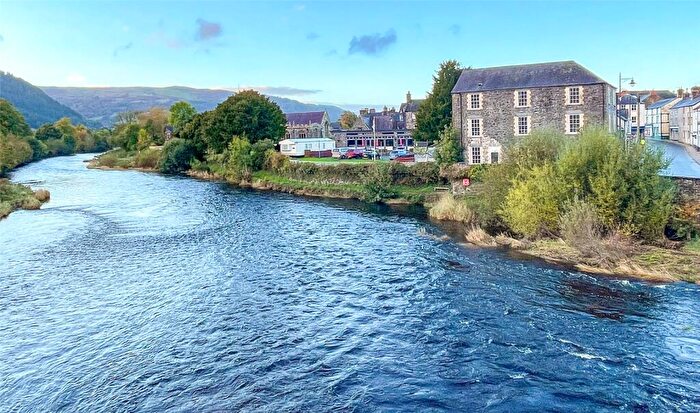
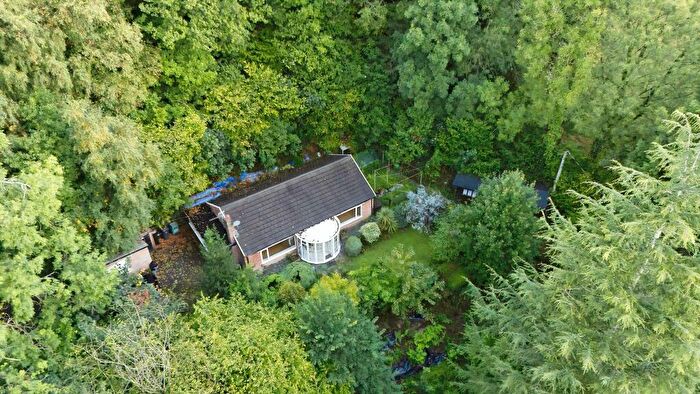
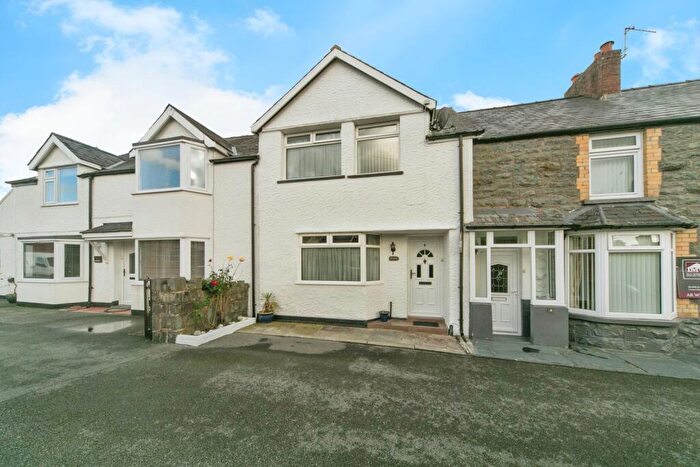
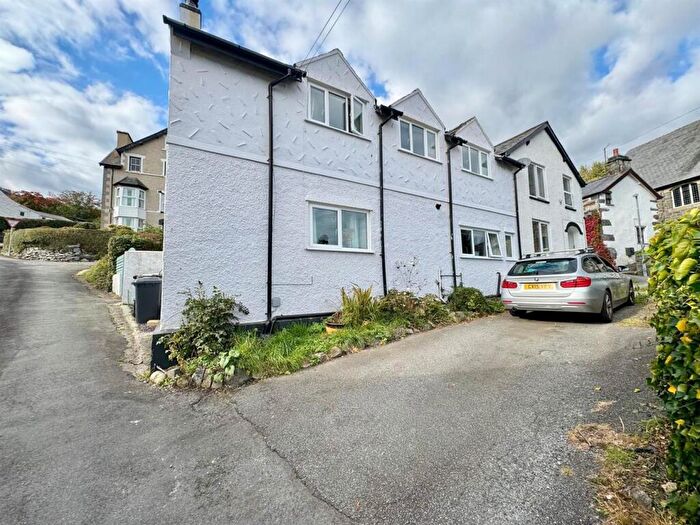
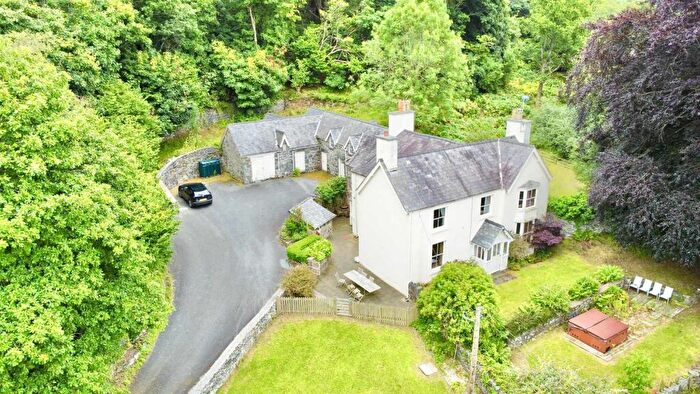
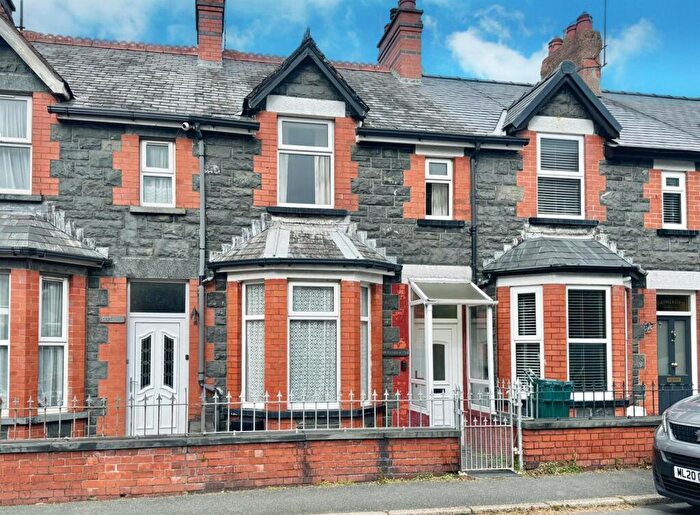
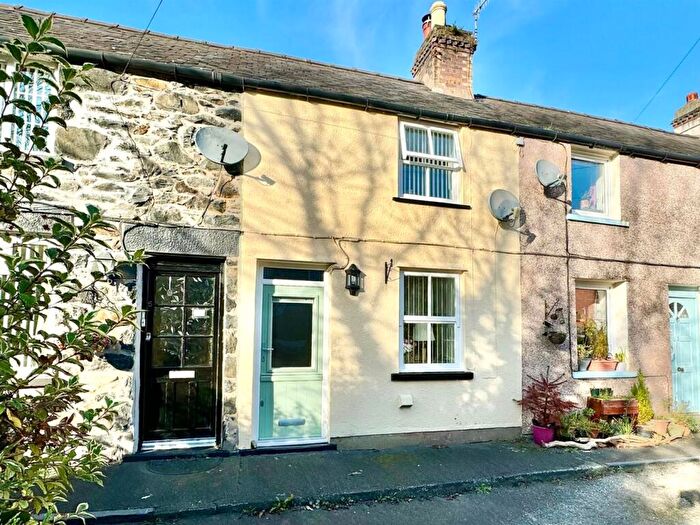
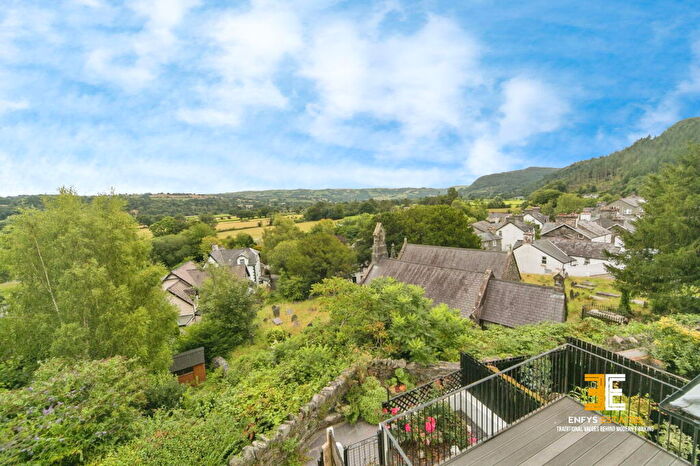
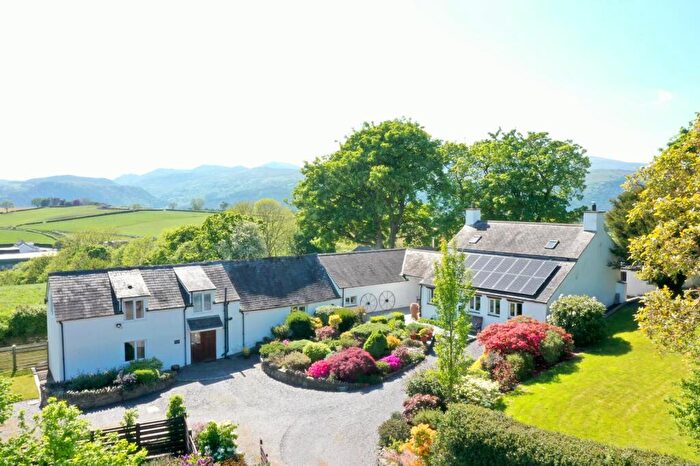
Houses for sale & to rent in Eglwysbach, Llanrwst
House Prices in Eglwysbach
Properties in Eglwysbach have an average house price of £367,781.00 and had 16 Property Transactions within the last 3 years¹.
Eglwysbach is an area in Llanrwst, Conwy - Conwy with 246 households², where the most expensive property was sold for £1,100,000.00.
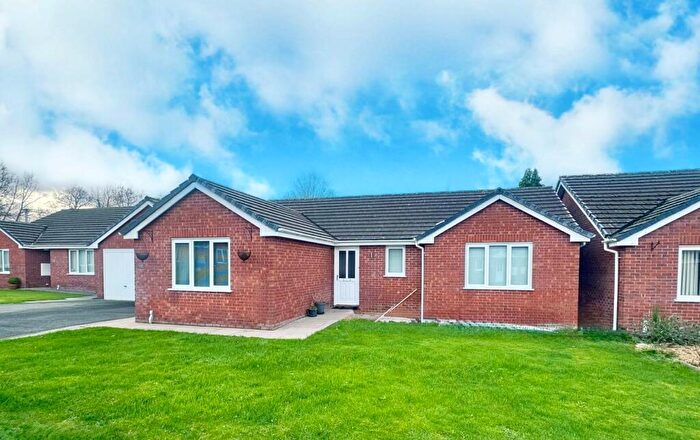
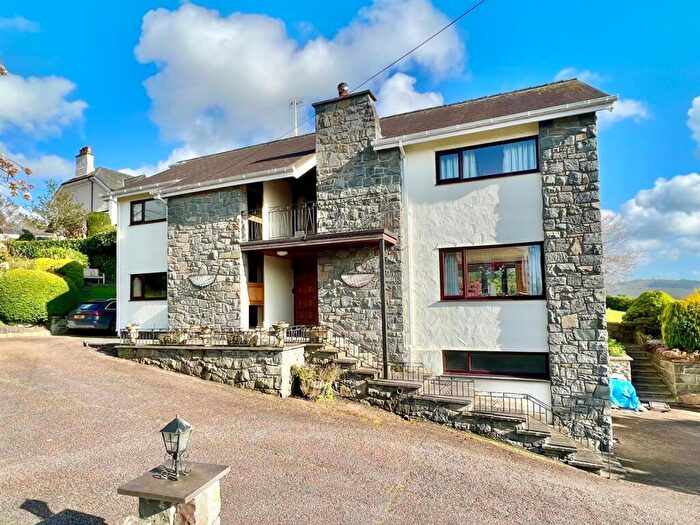
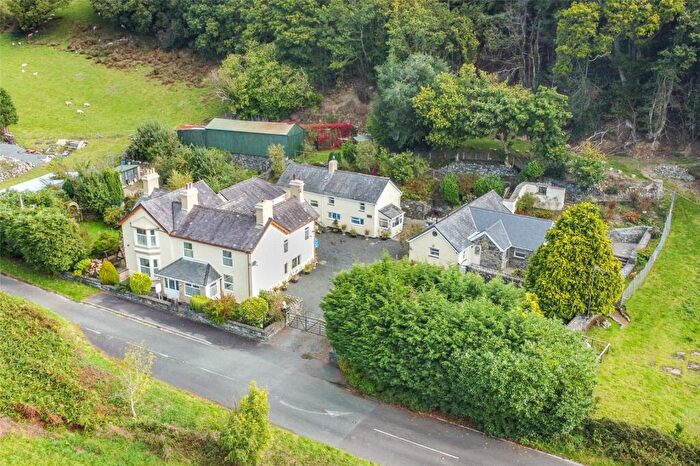
Properties for sale in Eglwysbach
Roads and Postcodes in Eglwysbach
Navigate through our locations to find the location of your next house in Eglwysbach, Llanrwst for sale or to rent.
| Streets | Postcodes |
|---|---|
| Ffordd Trwyn Swch | LL26 0DZ |
| Glanddol | LL26 0YP |
| Groesffordd | LL26 0UA |
| Maesgwyn | LL26 0BQ |
| Tyddyn Mali | LL26 0DD |
| LL26 0AJ LL26 0AQ LL26 0AX LL26 0AZ LL26 0BJ LL26 0BX LL26 0BZ LL26 0DQ LL26 0LJ LL26 0TT LL26 0TY LL26 0UE LL26 0UF LL26 0UL LL26 0UP LL26 0UR LL26 0UT LL26 0UU LL26 0YD LL26 0YE LL26 0YG LL26 0YL LL26 0YN LL26 0YR LL26 0DJ LL26 0DX LL26 0LQ LL26 0LX LL26 0LZ LL26 0NP LL26 0TU LL26 0UB LL26 0UD LL26 0UG LL26 0UH LL26 0UN LL26 0UW LL26 0UY LL26 0YA LL26 0YB LL26 0YF LL26 0YH LL26 0YW |
Transport near Eglwysbach
- FAQ
- Price Paid By Year
- Property Type Price
Frequently asked questions about Eglwysbach
What is the average price for a property for sale in Eglwysbach?
The average price for a property for sale in Eglwysbach is £367,781. This amount is 65% higher than the average price in Llanrwst. There are 188 property listings for sale in Eglwysbach.
Which train stations are available in or near Eglwysbach?
Some of the train stations available in or near Eglwysbach are Dolgarrog, North Llanrwst and Llanrwst.
Property Price Paid in Eglwysbach by Year
The average sold property price by year was:
| Year | Average Sold Price | Price Change |
Sold Properties
|
|---|---|---|---|
| 2025 | £251,500 | -16% |
2 Properties |
| 2024 | £291,666 | -1% |
3 Properties |
| 2023 | £295,214 | -107% |
7 Properties |
| 2022 | £610,000 | 33% |
4 Properties |
| 2021 | £410,222 | 61% |
11 Properties |
| 2020 | £161,500 | -55% |
2 Properties |
| 2019 | £249,812 | 37% |
8 Properties |
| 2018 | £157,500 | -42% |
2 Properties |
| 2017 | £223,125 | -5% |
8 Properties |
| 2016 | £235,071 | 18% |
7 Properties |
| 2015 | £193,800 | 18% |
5 Properties |
| 2014 | £158,083 | -28% |
6 Properties |
| 2013 | £201,661 | -33% |
9 Properties |
| 2012 | £268,000 | -3% |
4 Properties |
| 2011 | £275,000 | 57% |
2 Properties |
| 2010 | £117,500 | -72% |
4 Properties |
| 2009 | £202,500 | 23% |
3 Properties |
| 2008 | £156,600 | -29% |
5 Properties |
| 2007 | £202,495 | -6% |
10 Properties |
| 2006 | £215,071 | -19% |
7 Properties |
| 2005 | £256,396 | -10% |
4 Properties |
| 2004 | £282,000 | 39% |
6 Properties |
| 2003 | £173,181 | -2% |
8 Properties |
| 2002 | £176,055 | 49% |
9 Properties |
| 2001 | £90,000 | 2% |
4 Properties |
| 2000 | £88,454 | -3% |
11 Properties |
| 1999 | £90,750 | 51% |
6 Properties |
| 1998 | £44,666 | -167% |
3 Properties |
| 1997 | £119,400 | 55% |
5 Properties |
| 1996 | £54,000 | -21% |
5 Properties |
| 1995 | £65,416 | - |
6 Properties |
Property Price per Property Type in Eglwysbach
Here you can find historic sold price data in order to help with your property search.
The average Property Paid Price for specific property types in the last three years are:
| Property Type | Average Sold Price | Sold Properties |
|---|---|---|
| Semi Detached House | £237,875.00 | 4 Semi Detached Houses |
| Detached House | £428,454.00 | 11 Detached Houses |
| Terraced House | £220,000.00 | 1 Terraced House |

