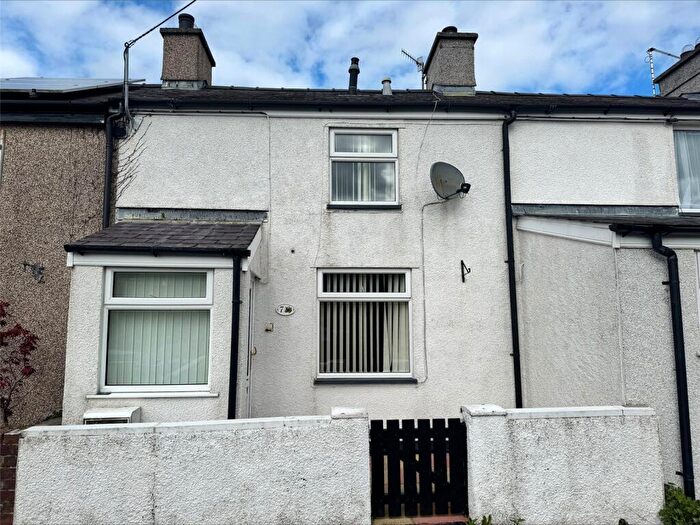
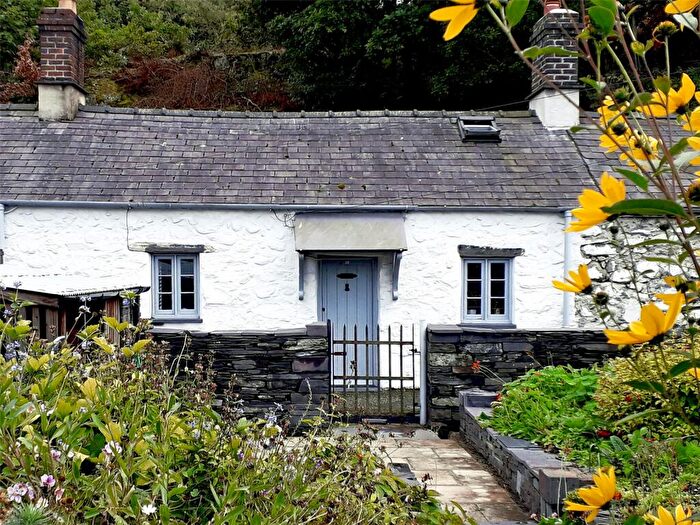
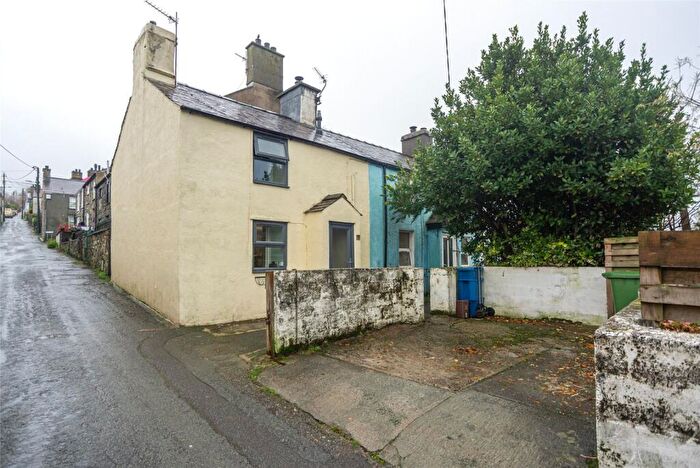
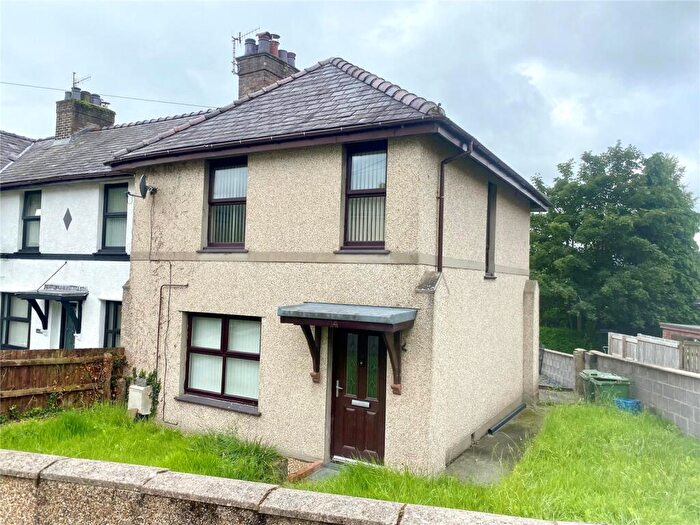
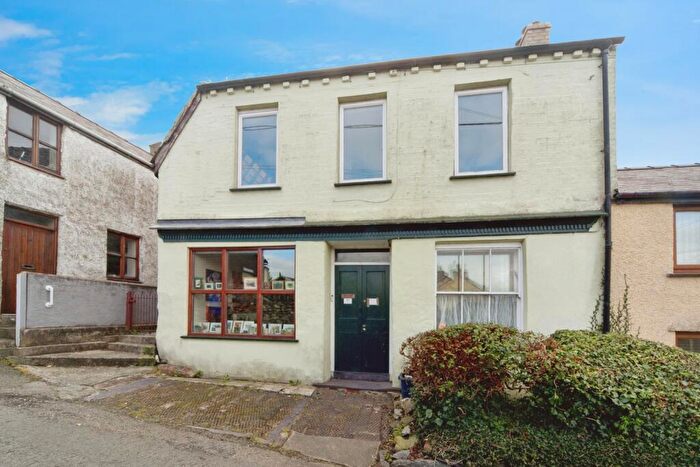
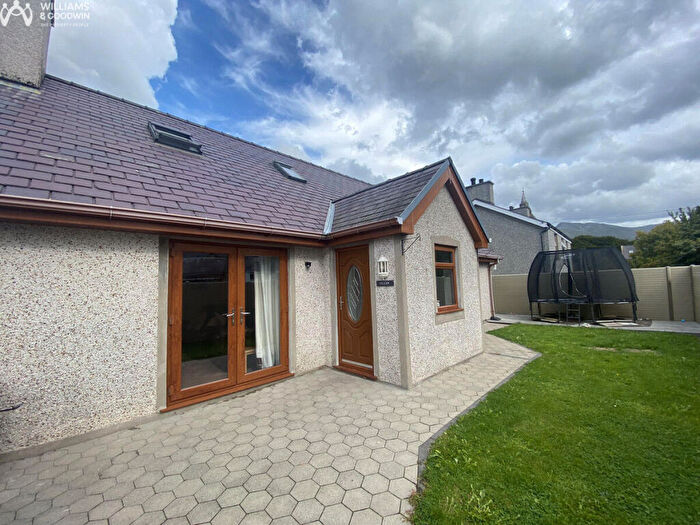
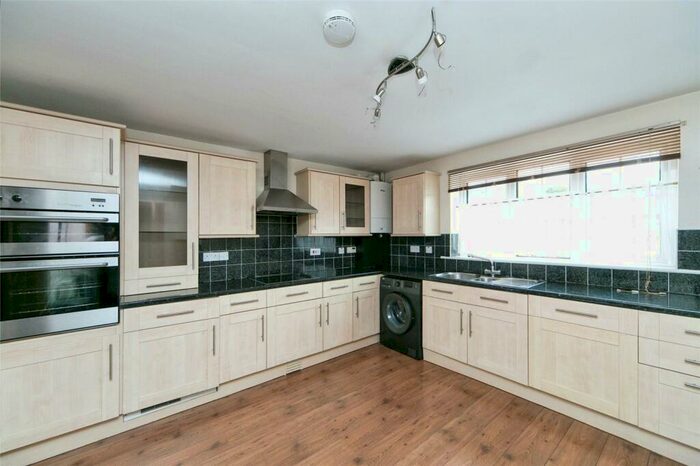
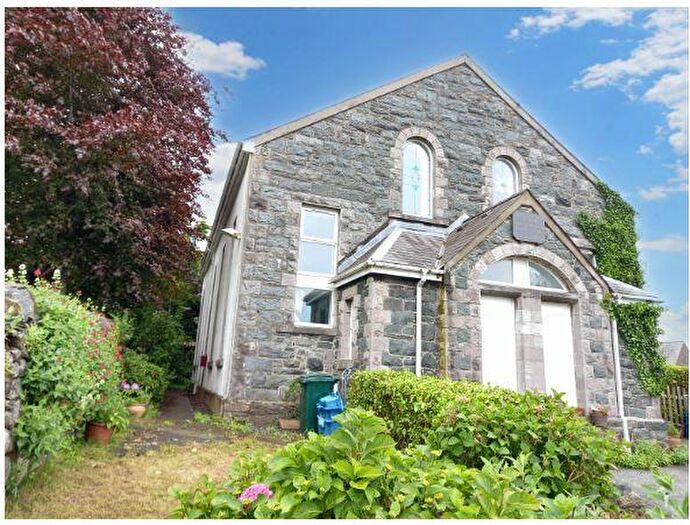
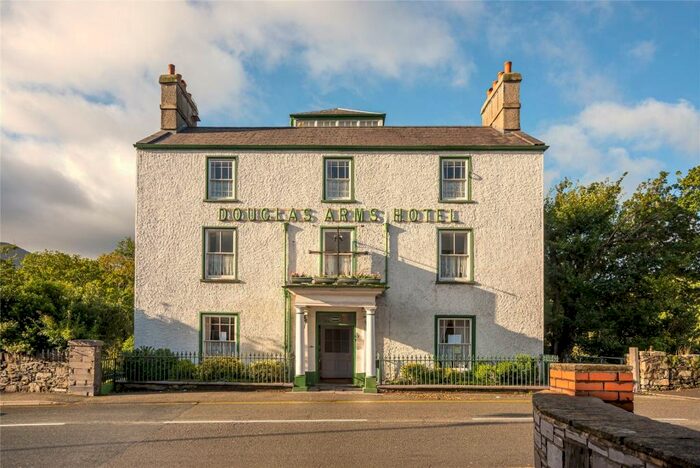
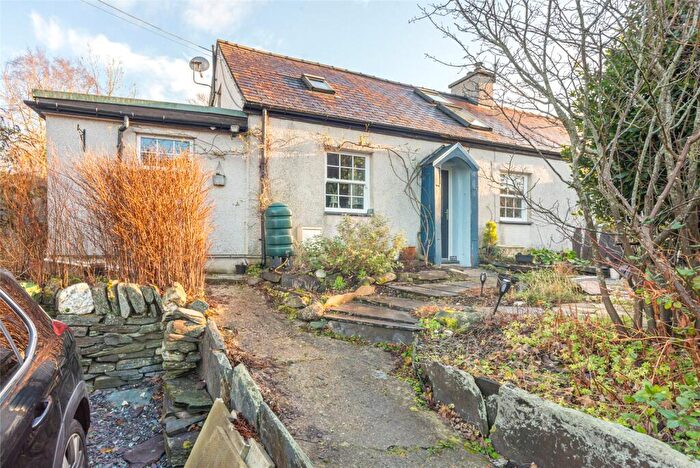
Houses for sale & to rent in Ogwen, Bangor
House Prices in Ogwen
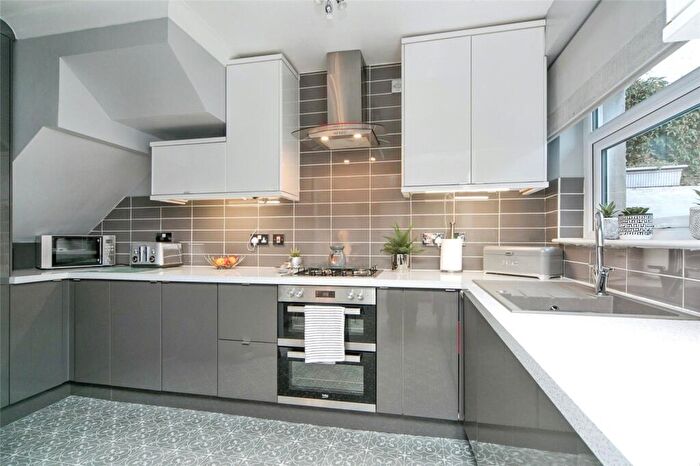
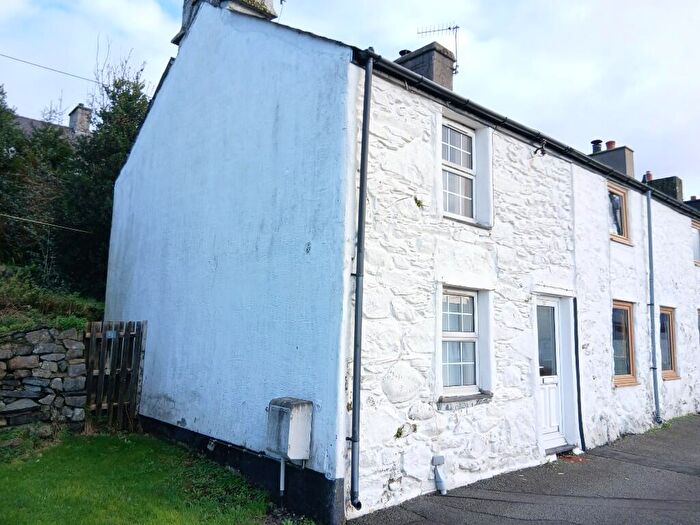
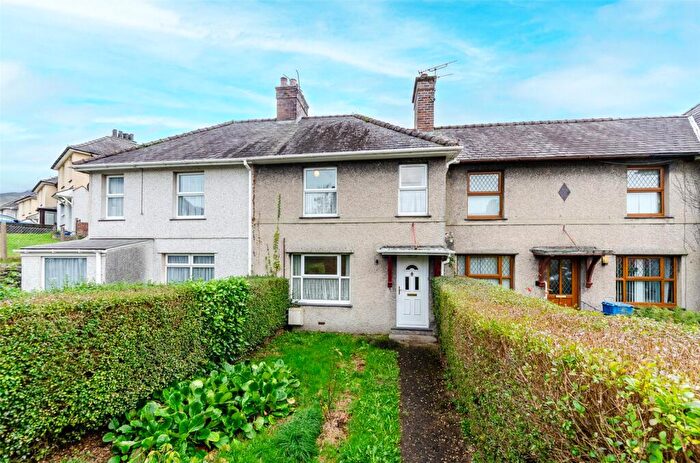
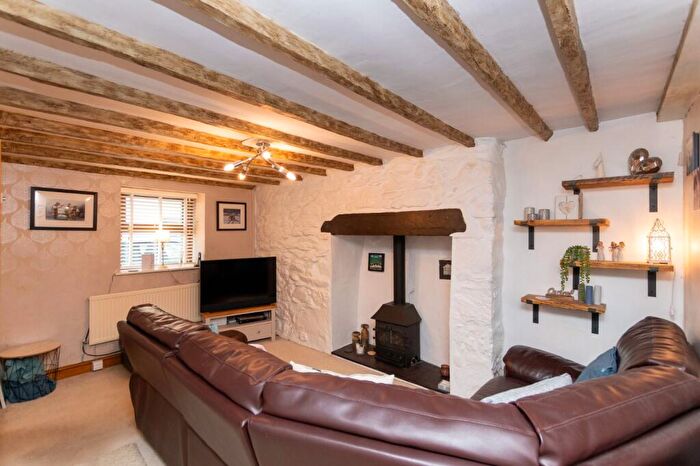
Properties in Ogwen have an average house price of £161,973.00 and had 67 Property Transactions within the last 3 years¹.
Ogwen is an area in Bangor, Gwynedd - Gwynedd with 1,039 households², where the most expensive property was sold for £365,000.00.
Properties for sale in Ogwen
Previously listed properties in Ogwen
Roads and Postcodes in Ogwen
Navigate through our locations to find the location of your next house in Ogwen, Bangor for sale or to rent.
| Streets | Postcodes |
|---|---|
| Abercaseg | LL57 3PL |
| Adwyr Nant | LL57 3NY |
| Bangor Road | LL57 3LU |
| Bryn Caseg | LL57 3RW |
| Brynteg Place | LL57 3BT |
| Brynteg Street | LL57 3BS |
| Bryntirion | LL57 3NG |
| Carneddi Road | LL57 3SG |
| Cefnfaes Street | LL57 3BW |
| Cil Caseg | LL57 3GA |
| Cilfodan Street | LL57 3RZ |
| Coetmor Mount | LL57 3NL |
| Coetmor Road | LL57 3NN LL57 3NF |
| Coetmor Terrace | LL57 3NA |
| Dolgoch | LL57 3LT |
| Douglas Terrace | LL57 3NT |
| Elfed Terrace | LL57 3NP |
| Ffordd Yr Elen | LL57 3DB |
| Ffrydlas Road | LL57 3BH LL57 3BL |
| Frondeg | LL57 3SW |
| Garneddwen | LL57 3PD |
| Gerddi Dol Ddafydd | LL57 3ND |
| Glanafon Street | LL57 3AL |
| Glanffrydlas | LL57 3PF |
| Glanogwen | LL57 3PG |
| Glanogwen Cottages | LL57 3NS |
| Gordon Terrace | LL57 3NR |
| Gray Street | LL57 3BY |
| Gwel Y Nant | LL57 3NJ |
| High Street | LL57 3AE LL57 3AF LL57 3AN LL57 3AR |
| John Street | LL57 3AT |
| Llain Deg | LL57 3BF |
| Llain Y Pebyll | LL57 3NQ |
| Llawr Y Nant | LL57 3GB |
| Lon Sarnau | LL57 3NX |
| Maes Coetmor | LL57 3DS |
| Maes Y Garnedd | LL57 3BP |
| Middle Street | LL57 3BU |
| Mostyn Terrace | LL57 3AB LL57 3AD |
| New Gerlan Road | LL57 3PB LL57 3PJ |
| Ogwen Square | LL57 3AU |
| Ogwen Street | LL57 3AW |
| Ogwen Terrace | LL57 3AY |
| Pant Road | LL57 3PA LL57 3PE |
| Pantdreiniog Industrial Estate Road | LL57 3LP |
| Pantglas Road | LL57 3BG |
| Penrhyn Terrace | LL57 3NB |
| Penybryn Place | LL57 3BE |
| Penybryn Road | LL57 3BD |
| Penybryn Terrace | LL57 3BN |
| Penygraig | LL57 3AS |
| Rhos Y Coed | LL57 3NW |
| Rhos Y Nant | LL57 3PP |
| Rock Terrace | LL57 3AA |
| Station Road | LL57 3NE |
| Tabernacle Terrace | LL57 3BB |
| Victoria Place | LL57 3AG |
| Victoria Square | LL57 3AH |
| Water Street | LL57 3DA |
| Williams Terrace | LL57 3NH |
| Ystad Coetmor | LL57 3DR |
| LL57 3LY LL57 3NU LL57 3PH LL57 3PR LL57 3BJ LL57 3DD LL57 3DW LL57 3PN LL57 3PW LL57 3SQ |
Transport near Ogwen
-
Bangor (Gwynedd) Station
-
Llanfairfechan Station
-
Llanfairpwll Station
-
Penmaenmawr Station
-
Dolgarrog Station
- FAQ
- Price Paid By Year
- Property Type Price
Frequently asked questions about Ogwen
What is the average price for a property for sale in Ogwen?
The average price for a property for sale in Ogwen is £161,973. This amount is 19% lower than the average price in Bangor. There are 182 property listings for sale in Ogwen.
What streets have the most expensive properties for sale in Ogwen?
The streets with the most expensive properties for sale in Ogwen are Rhos Y Nant at an average of £300,000, Ffrydlas Road at an average of £270,000 and Coetmor Road at an average of £258,333.
What streets have the most affordable properties for sale in Ogwen?
The streets with the most affordable properties for sale in Ogwen are Ogwen Street at an average of £94,000, High Street at an average of £96,785 and Station Road at an average of £105,000.
Which train stations are available in or near Ogwen?
Some of the train stations available in or near Ogwen are Bangor (Gwynedd), Llanfairfechan and Llanfairpwll.
Property Price Paid in Ogwen by Year
The average sold property price by year was:
| Year | Average Sold Price | Price Change |
Sold Properties
|
|---|---|---|---|
| 2025 | £181,375 | 12% |
16 Properties |
| 2024 | £159,916 | 5% |
27 Properties |
| 2023 | £151,354 | 3% |
24 Properties |
| 2022 | £147,000 | 3% |
36 Properties |
| 2021 | £142,383 | 8% |
34 Properties |
| 2020 | £130,428 | 12% |
21 Properties |
| 2019 | £114,916 | -23% |
30 Properties |
| 2018 | £141,837 | 17% |
37 Properties |
| 2017 | £117,666 | 4% |
33 Properties |
| 2016 | £112,687 | -11% |
33 Properties |
| 2015 | £124,653 | -1% |
37 Properties |
| 2014 | £125,400 | -2% |
33 Properties |
| 2013 | £127,948 | 11% |
30 Properties |
| 2012 | £113,469 | -5% |
13 Properties |
| 2011 | £119,036 | -4% |
25 Properties |
| 2010 | £123,535 | 5% |
28 Properties |
| 2009 | £117,898 | -5% |
25 Properties |
| 2008 | £123,805 | -19% |
20 Properties |
| 2007 | £147,558 | 20% |
34 Properties |
| 2006 | £117,510 | -6% |
41 Properties |
| 2005 | £124,136 | 31% |
41 Properties |
| 2004 | £85,832 | 24% |
33 Properties |
| 2003 | £65,540 | 16% |
39 Properties |
| 2002 | £54,785 | 11% |
41 Properties |
| 2001 | £48,610 | 15% |
39 Properties |
| 2000 | £41,223 | 7% |
39 Properties |
| 1999 | £38,372 | 21% |
48 Properties |
| 1998 | £30,471 | -23% |
38 Properties |
| 1997 | £37,553 | 4% |
31 Properties |
| 1996 | £36,183 | 8% |
37 Properties |
| 1995 | £33,350 | - |
20 Properties |
Property Price per Property Type in Ogwen
Here you can find historic sold price data in order to help with your property search.
The average Property Paid Price for specific property types in the last three years are:
| Property Type | Average Sold Price | Sold Properties |
|---|---|---|
| Semi Detached House | £195,033.00 | 15 Semi Detached Houses |
| Detached House | £292,500.00 | 4 Detached Houses |
| Terraced House | £143,183.00 | 45 Terraced Houses |
| Flat | £104,500.00 | 3 Flats |

