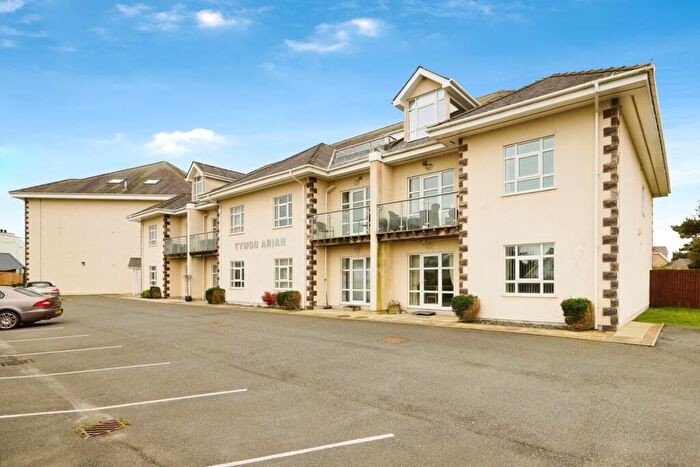
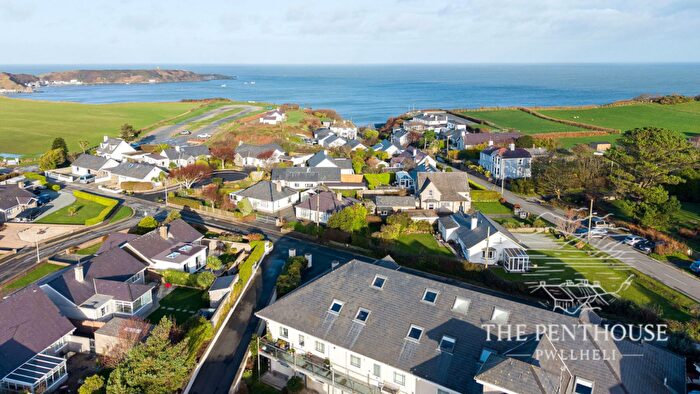
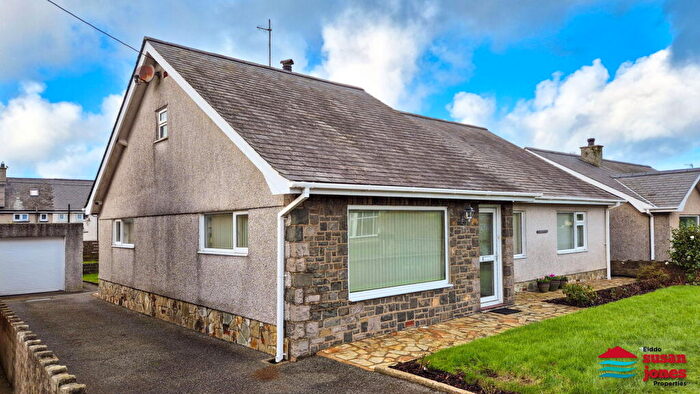
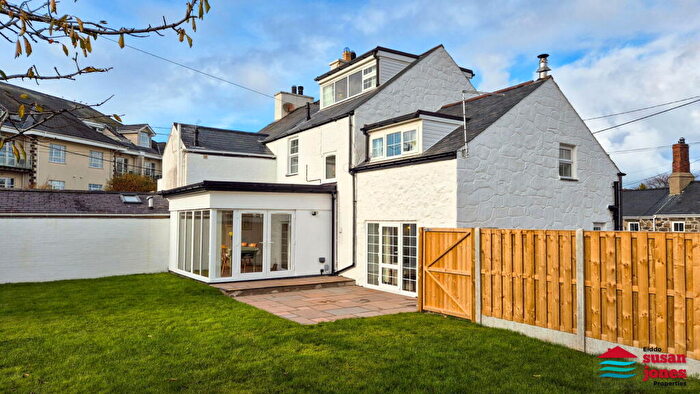
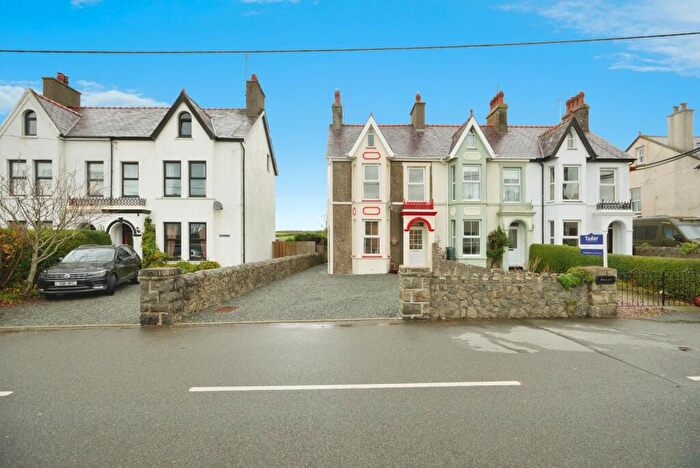
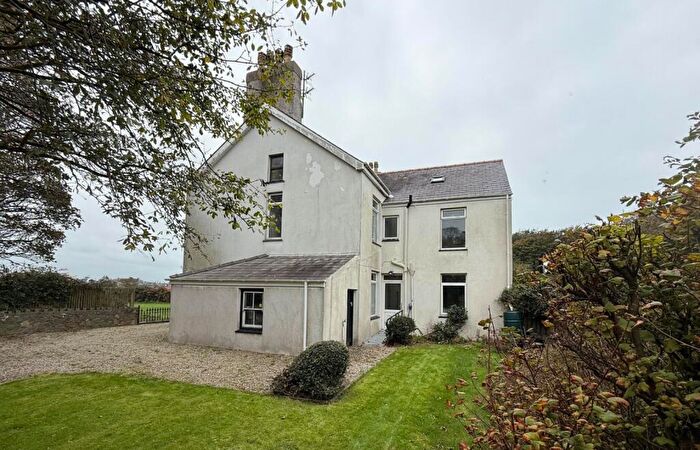
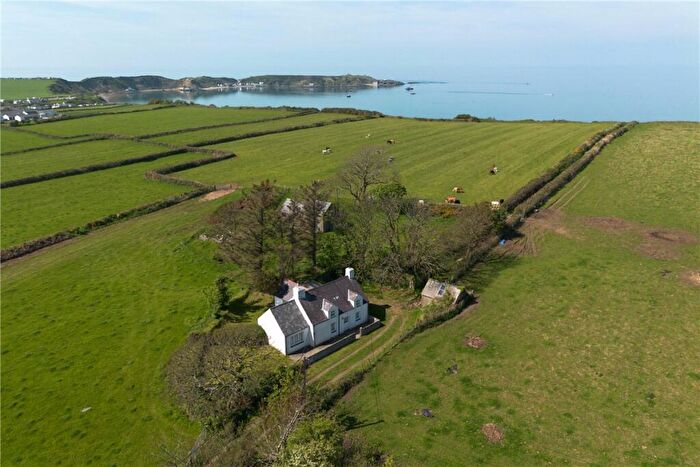
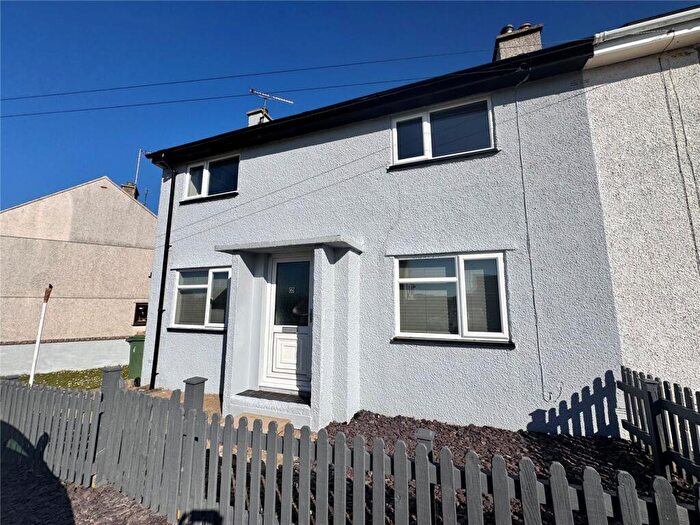
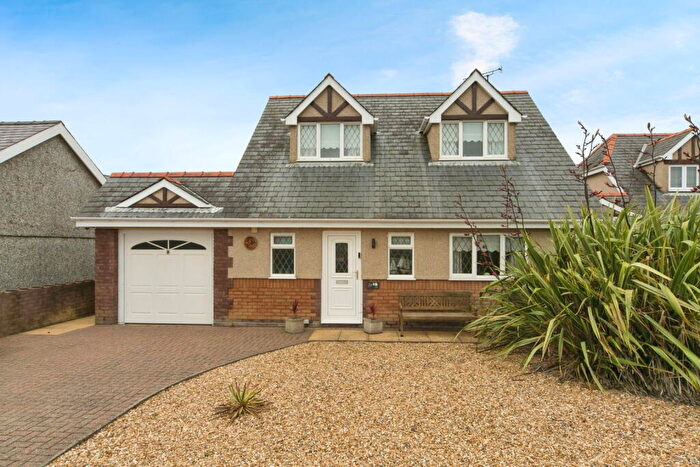
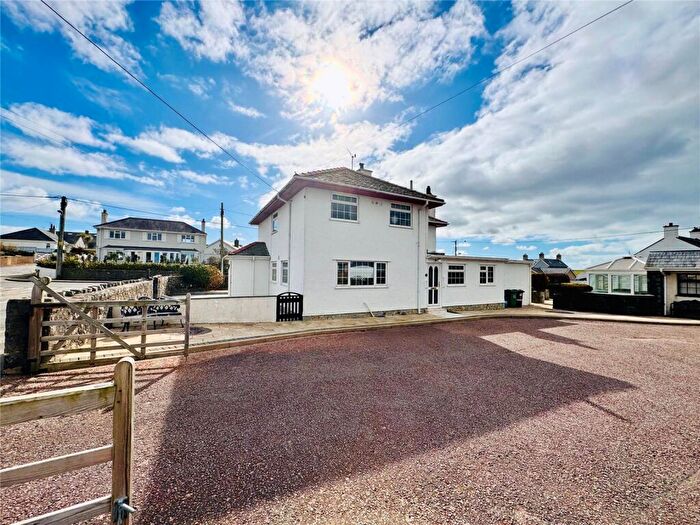
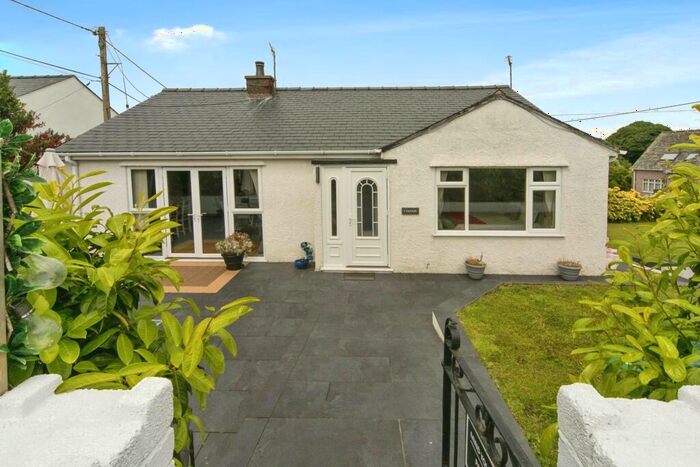
Houses for sale & to rent in Morfa Nefyn, Pwllheli
House Prices in Morfa Nefyn
Properties in Morfa Nefyn have an average house price of £303,302.00 and had 59 Property Transactions within the last 3 years¹.
Morfa Nefyn is an area in Pwllheli, Gwynedd - Gwynedd with 580 households², where the most expensive property was sold for £1,235,000.00.
Properties for sale in Morfa Nefyn
Roads and Postcodes in Morfa Nefyn
Navigate through our locations to find the location of your next house in Morfa Nefyn, Pwllheli for sale or to rent.
| Streets | Postcodes |
|---|---|
| Barcyttun Estate | LL53 6AT |
| Bro Terfyn | LL53 6BB |
| Bryn Estate | LL53 6DD |
| Cae Coch | LL53 6AW LL53 6AN |
| Cefn Morfa | LL53 8UW |
| Gerddi | LL53 8YR |
| Llwyn Gwalch Estate | LL53 6DE |
| Llys Madryn | LL53 6EX |
| Lon Bodlondeb | LL53 6AG |
| Lon Bridin | LL53 6BY |
| Lon Cae Glas | LL53 8YT |
| Lon Cyttun | LL53 6AS |
| Lon Fawr | LL53 6YZ |
| Lon Gerddi | LL53 8YP LL53 8YS |
| Lon Goch | LL53 6JD |
| Lon Golff | LL53 6DA LL53 6YN |
| Lon Groes | LL53 6BP |
| Lon Groesffordd | LL53 8YU |
| Lon Isaf | LL53 6BS LL53 6BW |
| Lon Las | LL53 6BG |
| Lon Llan | LL53 6JA |
| Lon Penrallt | LL53 6EW |
| Lon Penrhos | LL53 6BL |
| Lon Pwll Clai | LL53 6JB |
| Lon Pwll William | LL53 6ES |
| Lon Rhos | LL53 8YN |
| Lon Tan Y Bryn | LL53 6BT LL53 6BU |
| Lon Terfyn | LL53 6AP LL53 6BA |
| Lon Tynymur | LL53 6AY |
| Lon Uchaf | LL53 6AD LL53 6AH LL53 6AL |
| Lon Yr Eglwys | LL53 6AR |
| Lon Yr Ysgol | LL53 8YW |
| Lonyllwyn | LL53 6AU |
| Maes Hyfryd | LL53 8UN |
| Maes Terfyn | LL53 6EQ |
| Maes Twnti | LL53 6EU |
| Palmant Aur | LL53 6AF |
| Penrhos | LL53 6BH |
| Penrorsedd | LL53 6AE |
| Porthdinllaen | LL53 6DB |
| Terfynfa | LL53 6BD |
| Trem Y Garn | LL53 6EJ |
| Tyn Y Mur Estate | LL53 6DF |
| Wern Y Wylan | LL53 6DG |
| LL53 6BN LL53 6ER LL53 6YJ LL53 8YY LL53 6AA LL53 6AB LL53 6BE LL53 6YX LL53 8UP |
Transport near Morfa Nefyn
- FAQ
- Price Paid By Year
- Property Type Price
Frequently asked questions about Morfa Nefyn
What is the average price for a property for sale in Morfa Nefyn?
The average price for a property for sale in Morfa Nefyn is £303,302. This amount is 2% lower than the average price in Pwllheli. There are 149 property listings for sale in Morfa Nefyn.
What streets have the most expensive properties for sale in Morfa Nefyn?
The streets with the most expensive properties for sale in Morfa Nefyn are Lon Bridin at an average of £892,500, Lon Las at an average of £580,000 and Wern Y Wylan at an average of £472,750.
What streets have the most affordable properties for sale in Morfa Nefyn?
The streets with the most affordable properties for sale in Morfa Nefyn are Lon Cae Glas at an average of £162,500, Lon Gerddi at an average of £178,000 and Gerddi at an average of £183,500.
Which train stations are available in or near Morfa Nefyn?
Some of the train stations available in or near Morfa Nefyn are Pwllheli, Abererch and Penychain.
Property Price Paid in Morfa Nefyn by Year
The average sold property price by year was:
| Year | Average Sold Price | Price Change |
Sold Properties
|
|---|---|---|---|
| 2025 | £281,356 | -22% |
15 Properties |
| 2024 | £342,582 | 19% |
23 Properties |
| 2023 | £275,957 | -46% |
21 Properties |
| 2022 | £403,300 | 35% |
15 Properties |
| 2021 | £260,776 | 5% |
28 Properties |
| 2020 | £247,843 | 3% |
16 Properties |
| 2019 | £239,611 | 7% |
27 Properties |
| 2018 | £222,317 | 16% |
26 Properties |
| 2017 | £185,886 | -8% |
33 Properties |
| 2016 | £200,193 | 7% |
32 Properties |
| 2015 | £186,447 | -13% |
19 Properties |
| 2014 | £210,354 | 7% |
24 Properties |
| 2013 | £195,968 | 7% |
16 Properties |
| 2012 | £182,249 | -2% |
18 Properties |
| 2011 | £186,590 | 10% |
19 Properties |
| 2010 | £167,184 | -8% |
19 Properties |
| 2009 | £179,730 | -1% |
13 Properties |
| 2008 | £181,713 | -12% |
22 Properties |
| 2007 | £203,375 | 8% |
32 Properties |
| 2006 | £186,745 | 10% |
30 Properties |
| 2005 | £168,894 | 15% |
19 Properties |
| 2004 | £143,621 | -5% |
16 Properties |
| 2003 | £150,573 | 33% |
23 Properties |
| 2002 | £101,092 | 24% |
21 Properties |
| 2001 | £77,304 | 3% |
37 Properties |
| 2000 | £74,828 | 8% |
30 Properties |
| 1999 | £68,650 | 16% |
31 Properties |
| 1998 | £57,700 | 1% |
27 Properties |
| 1997 | £56,964 | -2% |
21 Properties |
| 1996 | £58,268 | 11% |
8 Properties |
| 1995 | £51,727 | - |
11 Properties |
Property Price per Property Type in Morfa Nefyn
Here you can find historic sold price data in order to help with your property search.
The average Property Paid Price for specific property types in the last three years are:
| Property Type | Average Sold Price | Sold Properties |
|---|---|---|
| Semi Detached House | £235,359.00 | 16 Semi Detached Houses |
| Detached House | £393,313.00 | 29 Detached Houses |
| Terraced House | £191,000.00 | 13 Terraced Houses |
| Flat | £240,000.00 | 1 Flat |

