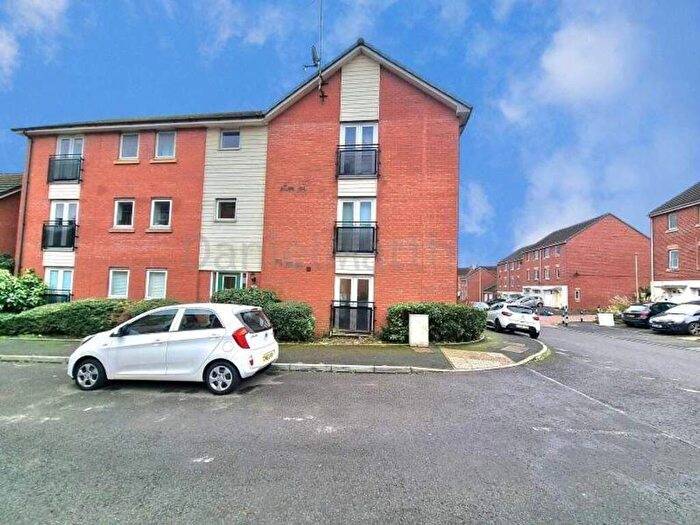
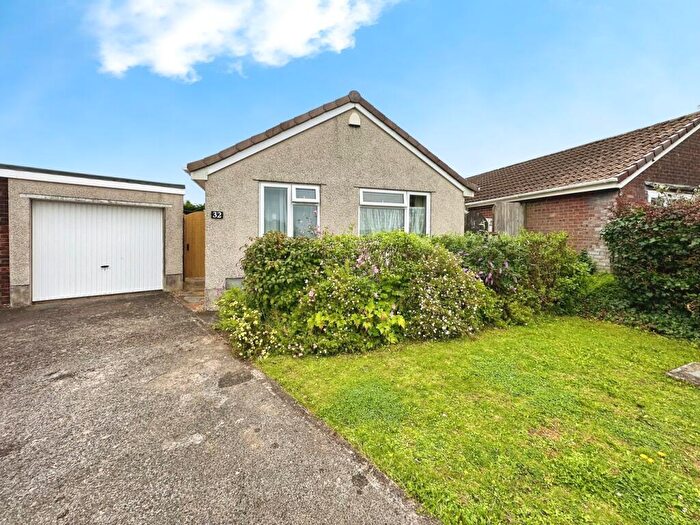
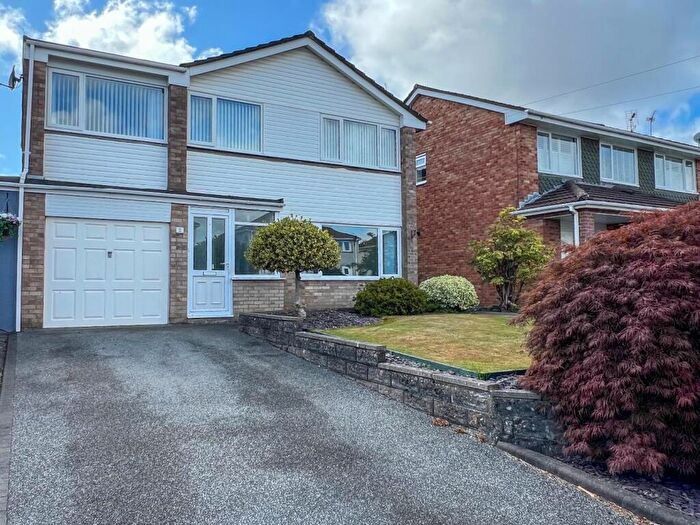
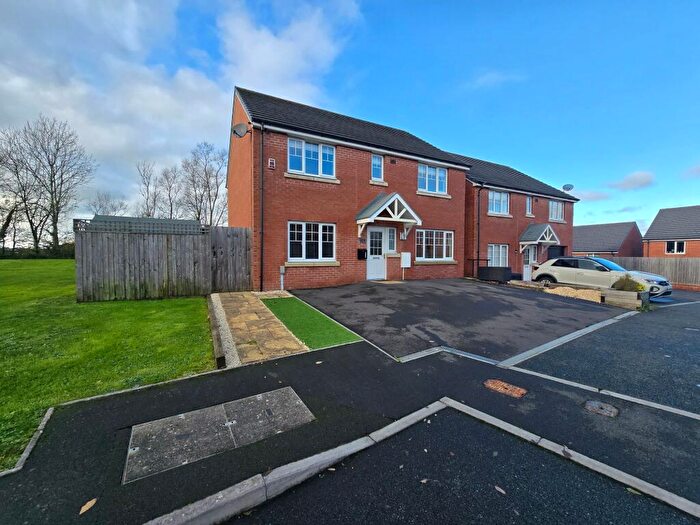
Houses for sale & to rent in Coychurch Lower, Bridgend
House Prices in Coychurch Lower
Properties in Coychurch Lower have an average house price of £298,390.00 and had 46 Property Transactions within the last 3 years¹.
Coychurch Lower is an area in Bridgend, Pen-y-bont ar Ogwr - Bridgend with 590 households², where the most expensive property was sold for £547,500.00.
Properties for sale in Coychurch Lower
Roads and Postcodes in Coychurch Lower
Navigate through our locations to find the location of your next house in Coychurch Lower, Bridgend for sale or to rent.
| Streets | Postcodes |
|---|---|
| Bennett Street | CF31 3SH |
| Bridgend Industrial Estate | CF31 3RD CF31 3SB |
| Brocastle Avenue | CF31 3US CF31 3XA CF31 3XR |
| Brookside | CF35 5EJ |
| Bryn Road | CF35 5EY CF35 6AE |
| Brynffrwd Close | CF35 5EP |
| Cadwgan Court | CF35 5FE |
| Charnwood Park | CF31 3PL |
| Cheapside Industrial Estate | CF31 3UN |
| Church Terrace | CF35 5HF |
| Coity Crescent Industrial Estate | CF31 3RS |
| Cowbridge Road | CF31 3BF CF31 3SR CF31 3SU |
| Coychurch Road | CF35 5NS |
| David Street Industrial Estate | CF31 3SA |
| Duffryn Close | CF35 5TA |
| East Street Industrial Estate | CF31 3DQ |
| Eifion Court | CF35 5FF |
| Ewenny Industrial Estate | CF31 3EX |
| Factory Lane | CF35 5BQ |
| George Street Industrial Estate | CF31 3TS |
| Glebeland Close | CF35 5HE |
| Glenwood Close | CF35 5ET CF35 5EU |
| Glyndwr Court | CF35 5FB |
| Grange Crescent | CF35 5HP |
| Hawthorn Drive | CF35 5ER |
| Heol Cae Tyla | CF35 5HR |
| Heol Spencer | CF35 6AF |
| Heol Y Capel | CF35 5HG |
| Horsefair Road | CF31 3YN |
| Iestyn Court | CF35 5FG |
| Kent Road | CF31 3TU |
| Kestrel Close Industrial Estate | CF31 3RW |
| Kingsway | CF31 3RY |
| Kingsway Industrial Estate | CF31 3YH |
| Laurel Court | CF31 3YX |
| Llywelyn Court | CF35 5FD |
| Manor Drive | CF35 5HA |
| Meadow Close | CF35 5HH |
| Moor Road | CF31 3TR |
| New Street | CF31 3UD |
| North Road | CF31 3TP |
| North Road Industrial Estate | CF31 3SZ |
| Ogmore Crescent | CF31 3TE |
| Old Church Gardens | CF35 5TB |
| Parc Crescent | CF31 3BQ CF31 3XU |
| Park View | CF35 5HS |
| Princes Way | CF31 3AQ |
| Princes Way Industrial Estate | CF31 3TT |
| Queens Court | CF31 3TQ |
| Queens Road Industrial Estate | CF31 3UR CF31 3UT |
| Raven Close Industrial Estate | CF31 3RF |
| Royal London Park | CF31 3TN |
| Ruthin Court | CF35 5TD |
| South Road | CF31 3EB |
| South Road Industrial Estate | CF31 3PT CF31 3SY CF31 3UL CF31 3XG |
| St Marys View | CF35 5HL |
| The Court | CF35 5EH |
| Tower Close Industrial Estate | CF31 3TH |
| Treoes Road | CF35 5EW |
| Tyn Y Caeau Lane | CF35 6AD |
| Waterton Close | CF31 3YE |
| Waterton Industrial Estate | CF31 3PJ CF31 3WT |
| Waterton Lane | CF31 3YW CF31 3UZ |
| Waterton Road | CF31 3YY CF35 5EN |
| Western Avenue | CF31 3RX |
| Western Avenue Industrial Estate | CF31 3RH CF31 3RT |
| York Road Industrial Estate | CF31 3TB |
| CF35 5AT CF35 5BU CF35 5DB CF35 5EL CF35 5ES CF35 5HB CF35 5HD CF35 5HN CF35 5HW CF31 3EZ CF31 3PH CF35 5AU CF35 6AA CF35 6AB CF35 6AG |
Transport near Coychurch Lower
- FAQ
- Price Paid By Year
- Property Type Price
Frequently asked questions about Coychurch Lower
What is the average price for a property for sale in Coychurch Lower?
The average price for a property for sale in Coychurch Lower is £298,390. This amount is 40% higher than the average price in Bridgend. There are 1,698 property listings for sale in Coychurch Lower.
What streets have the most expensive properties for sale in Coychurch Lower?
The streets with the most expensive properties for sale in Coychurch Lower are Park View at an average of £443,750, Grange Crescent at an average of £372,000 and Manor Drive at an average of £349,997.
What streets have the most affordable properties for sale in Coychurch Lower?
The streets with the most affordable properties for sale in Coychurch Lower are Heol Y Capel at an average of £178,333, Glenwood Close at an average of £238,888 and Brookside at an average of £262,500.
Which train stations are available in or near Coychurch Lower?
Some of the train stations available in or near Coychurch Lower are Bridgend, Wildmill and Pencoed.
Property Price Paid in Coychurch Lower by Year
The average sold property price by year was:
| Year | Average Sold Price | Price Change |
Sold Properties
|
|---|---|---|---|
| 2025 | £269,749 | -31% |
8 Properties |
| 2024 | £352,550 | 19% |
10 Properties |
| 2023 | £284,576 | -2% |
13 Properties |
| 2022 | £289,530 | -5% |
15 Properties |
| 2021 | £304,518 | 10% |
26 Properties |
| 2020 | £273,939 | 9% |
19 Properties |
| 2019 | £249,000 | 6% |
23 Properties |
| 2018 | £234,335 | -6% |
24 Properties |
| 2017 | £249,424 | 3% |
14 Properties |
| 2016 | £241,342 | 1% |
21 Properties |
| 2015 | £239,400 | -2% |
20 Properties |
| 2014 | £245,246 | 17% |
26 Properties |
| 2013 | £203,382 | 5% |
18 Properties |
| 2012 | £193,655 | -6% |
9 Properties |
| 2011 | £205,750 | -3% |
8 Properties |
| 2010 | £210,958 | 16% |
12 Properties |
| 2009 | £177,650 | -30% |
10 Properties |
| 2008 | £231,588 | 10% |
17 Properties |
| 2007 | £207,828 | -10% |
17 Properties |
| 2006 | £229,591 | -10% |
22 Properties |
| 2005 | £252,081 | 39% |
32 Properties |
| 2004 | £154,796 | 6% |
19 Properties |
| 2003 | £146,270 | -2% |
21 Properties |
| 2002 | £149,741 | 25% |
18 Properties |
| 2001 | £111,650 | 21% |
29 Properties |
| 2000 | £87,986 | 4% |
18 Properties |
| 1999 | £84,184 | 20% |
16 Properties |
| 1998 | £67,161 | -12% |
17 Properties |
| 1997 | £75,404 | 21% |
11 Properties |
| 1996 | £59,261 | -13% |
9 Properties |
| 1995 | £67,181 | - |
8 Properties |
Property Price per Property Type in Coychurch Lower
Here you can find historic sold price data in order to help with your property search.
The average Property Paid Price for specific property types in the last three years are:
| Property Type | Average Sold Price | Sold Properties |
|---|---|---|
| Semi Detached House | £260,833.00 | 21 Semi Detached Houses |
| Detached House | £361,547.00 | 20 Detached Houses |
| Terraced House | £297,500.00 | 2 Terraced Houses |
| Flat | £140,833.00 | 3 Flats |


