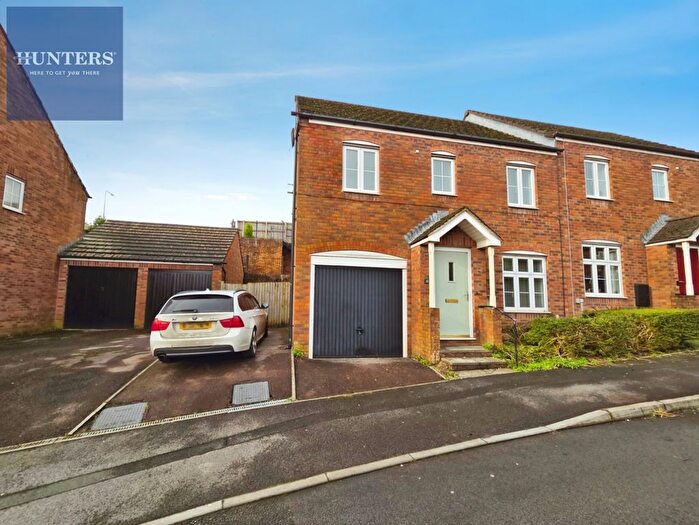
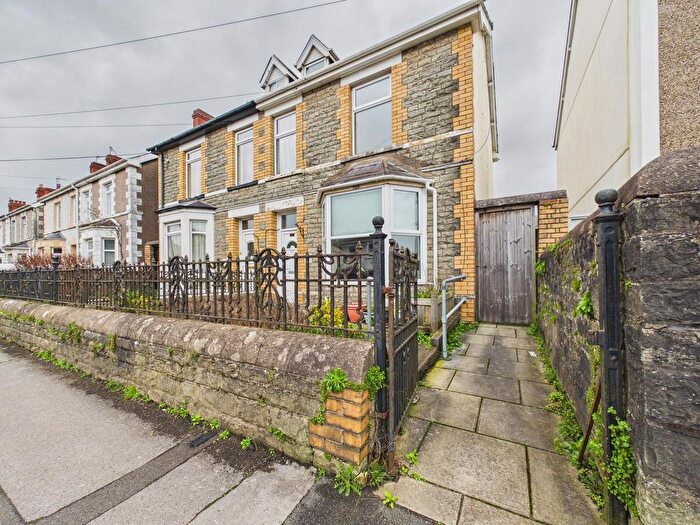
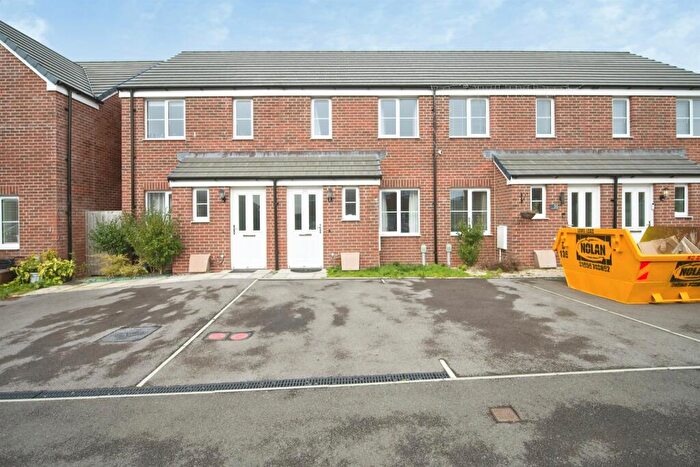
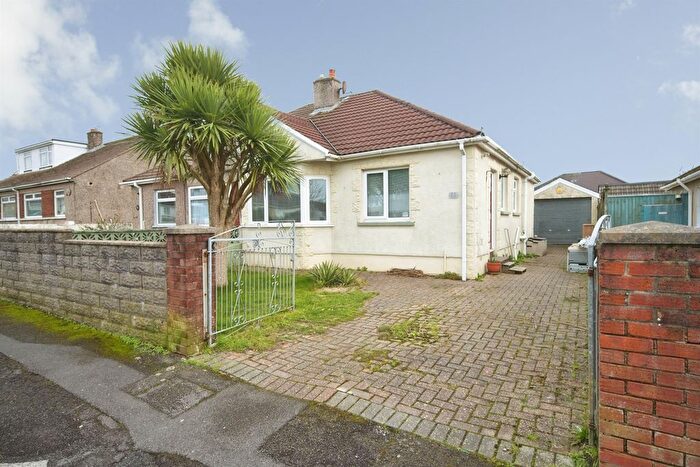
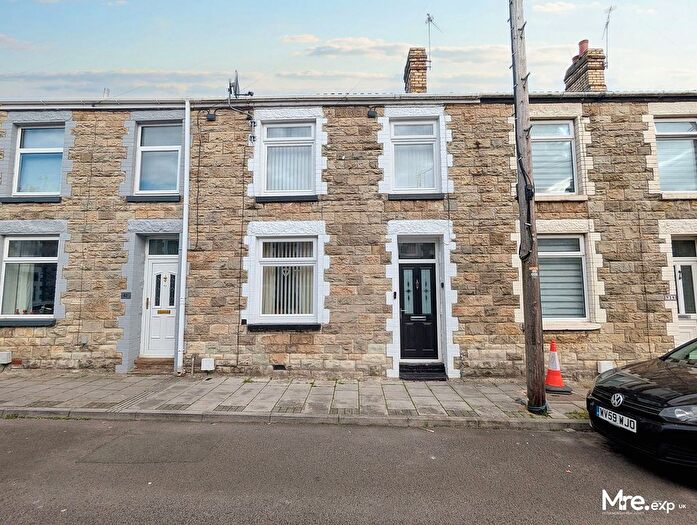
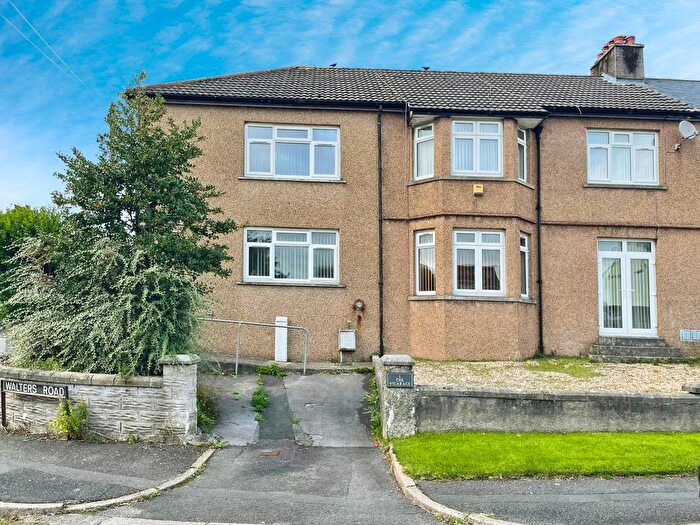
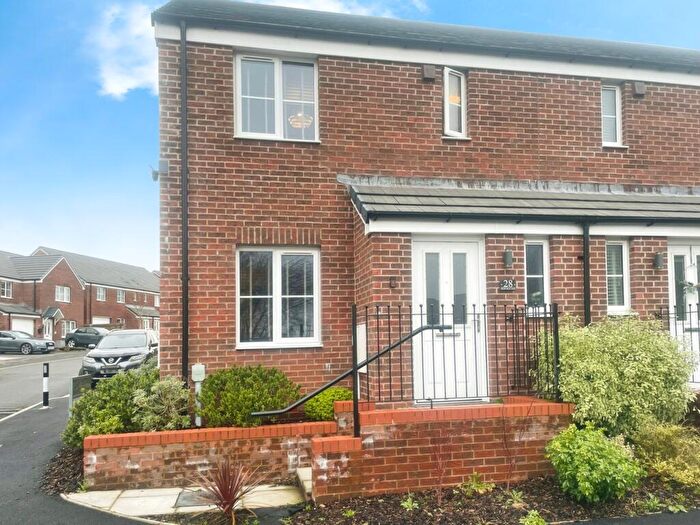
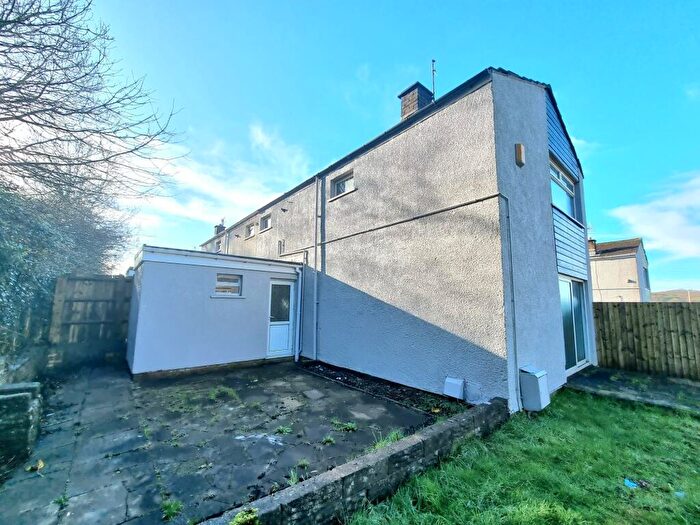
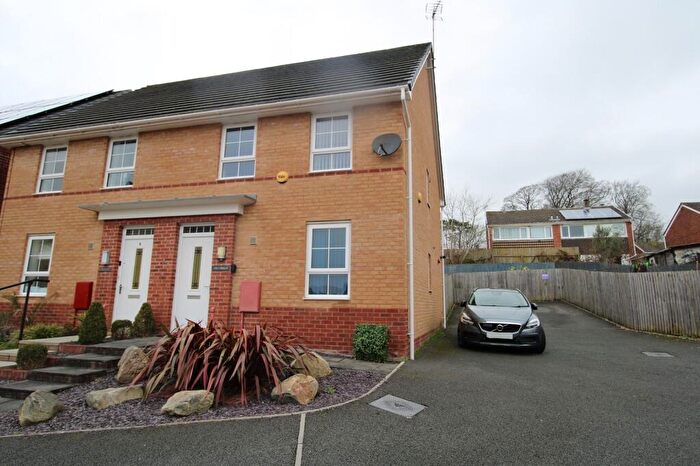
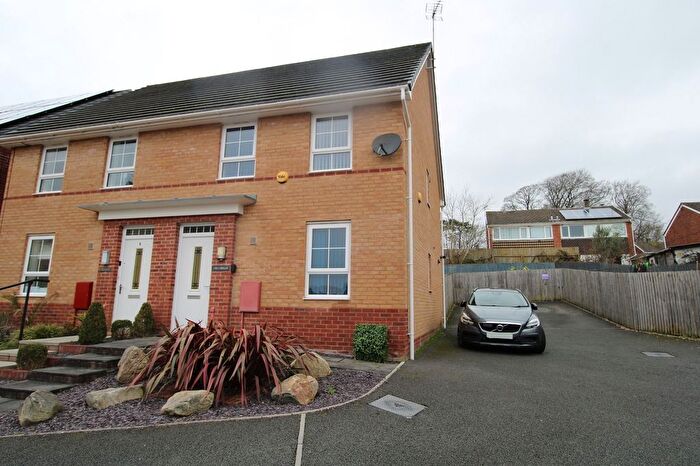
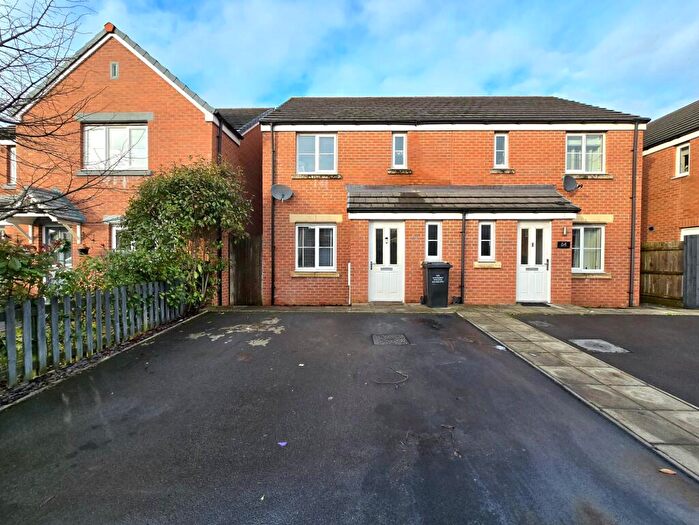
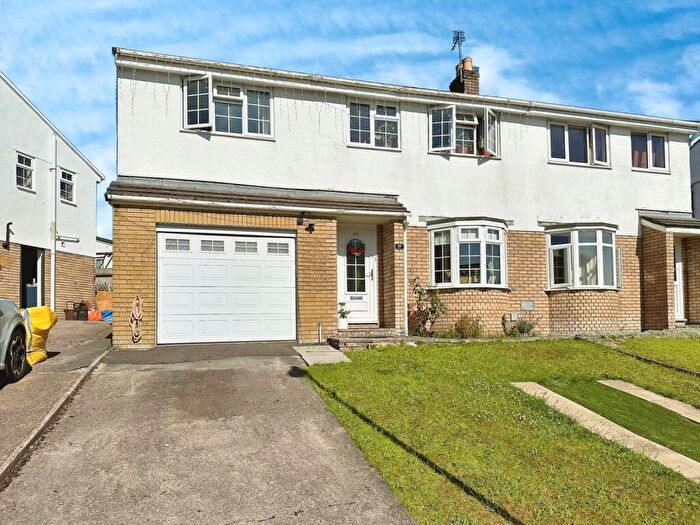
Houses for sale & to rent in Morfa, Bridgend
House Prices in Morfa
Properties in Morfa have an average house price of £176,827.00 and had 178 Property Transactions within the last 3 years¹.
Morfa is an area in Bridgend, Pen-y-bont ar Ogwr - Bridgend with 2,194 households², where the most expensive property was sold for £375,000.00.
Properties for sale in Morfa
Roads and Postcodes in Morfa
Navigate through our locations to find the location of your next house in Morfa, Bridgend for sale or to rent.
| Streets | Postcodes |
|---|---|
| Acland Road | CF31 1TF |
| Adare Street | CF31 1EJ CF31 1EN CF31 1ET |
| Arhosfa | CF31 1YS |
| Austin Avenue | CF31 1ND |
| Australian Terrace | CF31 1LY |
| Brackla Street | CF31 1DB |
| Brook Court | CF31 1GW |
| Brook Street | CF31 1HG |
| Bryn Morfa | CF31 1HJ |
| Caeffatri Close | CF31 1LZ |
| Canberra Road | CF31 1HH |
| Caroline Street | CF31 1DN CF31 1DQ CF31 1DW |
| Castle View | CF31 1HL CF31 1NJ |
| Cemetery Road | CF31 1NA |
| Charles Street | CF31 1TG |
| Coity Road | CF31 1LR CF31 1LT CF31 1LU CF31 1LF CF31 1NE CF31 1NF CF31 1NL |
| Coity Road Sidings | CF31 1NS |
| Court Road | CF31 1BD CF31 1BN CF31 1BE CF31 1BL CF31 1BW |
| Crosby Yard | CF31 1JZ |
| Cross Street | CF31 1EX |
| Derwen Road | CF31 1LH |
| Dunraven Place | CF31 1JB CF31 1JF CF31 1JD CF31 1JE CF31 1JQ |
| Elder Street | CF31 1AF |
| Gerddi Quarella | CF31 1LG |
| Glanffornwg | CF31 1RH CF31 1RJ CF31 1RL CF31 1RN |
| Green Street | CF31 1HF |
| Hayes Terrace | CF31 1NB |
| Herbert Street | CF31 1TJ |
| High View | CF31 1TL |
| Highland Place | CF31 1LS |
| Lawrence Close | CF31 1JY |
| Llety Gwyn | CF31 1RG |
| Llynfi Lane | CF31 1ST |
| Llynfi Street | CF31 1SY |
| Mackworth Street | CF31 1HW CF31 1LP CF31 1AG |
| Maes Y Felin | CF31 1YN CF31 1YW CF31 1YX CF31 1YY CF31 1YZ |
| Market Street | CF31 1LJ CF31 1LL |
| Meadow Street | CF31 1HE |
| Minerva Street | CF31 1TD |
| Morfa Street | CF31 1HA CF31 1HB CF31 1HD |
| Napier Close | CF31 1TW |
| Nolton Street | CF31 1BX CF31 1DU |
| Oddfellows Street | CF31 1TA |
| Ogmore Terrace | CF31 1SU |
| Old Bridge | CF31 1JH |
| Penybont Industrial Estate | CF31 1NW |
| Quarella | CF31 1JG |
| Quarella Crescent | CF31 1JU |
| Quarella Road | CF31 1JN CF31 1JS CF31 1JT CF31 1JX CF31 1JR CF31 1JW |
| Queen Street | CF31 1HX CF31 1HU |
| St Andrews Road | CF31 1RX |
| St Christophers Road | CF31 1RU |
| St Davids Close | CF31 1RR |
| St Francis Road | CF31 1RY |
| St Georges Avenue | CF31 1RS |
| St Nicholas Road | CF31 1RT |
| St Patricks Drive | CF31 1RP |
| Station Hill | CF31 1EA |
| Tairfelin | CF31 1SH CF31 1SJ CF31 1SL CF31 1SN CF31 1SW |
| The Precinct | CF31 1SP |
| The Rhiw | CF31 1DL CF31 3BL |
| Tremgarth | CF31 1RZ |
| Vernon Street | CF31 1TQ CF31 1TH |
| Waunscil Avenue | CF31 1TN |
| Wild Mill Lane | CF31 1RW |
| Wyndham Street | CF31 1EB CF31 1EF CF31 1AB CF31 1ED CF31 1EH CF31 1EQ |
| Y Gorlan | CF31 1YP |
| Yr Encil | CF31 1YU |
| CF31 1BB CF31 1HQ CF31 1LA |
Transport near Morfa
- FAQ
- Price Paid By Year
- Property Type Price
Frequently asked questions about Morfa
What is the average price for a property for sale in Morfa?
The average price for a property for sale in Morfa is £176,827. This amount is 18% lower than the average price in Bridgend. There are 1,961 property listings for sale in Morfa.
What streets have the most expensive properties for sale in Morfa?
The streets with the most expensive properties for sale in Morfa are Llety Gwyn at an average of £312,000, Caeffatri Close at an average of £275,000 and St Georges Avenue at an average of £254,375.
What streets have the most affordable properties for sale in Morfa?
The streets with the most affordable properties for sale in Morfa are Tairfelin at an average of £100,277, Glanffornwg at an average of £106,600 and Brook Court at an average of £109,741.
Which train stations are available in or near Morfa?
Some of the train stations available in or near Morfa are Bridgend, Wildmill and Sarn.
Property Price Paid in Morfa by Year
The average sold property price by year was:
| Year | Average Sold Price | Price Change |
Sold Properties
|
|---|---|---|---|
| 2025 | £182,547 | 6% |
47 Properties |
| 2024 | £172,333 | -3% |
74 Properties |
| 2023 | £177,946 | 2% |
57 Properties |
| 2022 | £173,538 | 15% |
68 Properties |
| 2021 | £148,010 | 2% |
66 Properties |
| 2020 | £145,427 | 12% |
43 Properties |
| 2019 | £127,258 | 2% |
64 Properties |
| 2018 | £124,134 | 1% |
64 Properties |
| 2017 | £123,096 | 1% |
69 Properties |
| 2016 | £121,802 | 1% |
68 Properties |
| 2015 | £120,619 | 18% |
62 Properties |
| 2014 | £98,956 | 1% |
70 Properties |
| 2013 | £98,010 | 5% |
44 Properties |
| 2012 | £93,024 | -12% |
41 Properties |
| 2011 | £103,862 | -7% |
40 Properties |
| 2010 | £111,189 | -4% |
51 Properties |
| 2009 | £115,969 | -1% |
33 Properties |
| 2008 | £117,414 | 0,5% |
57 Properties |
| 2007 | £116,864 | -3% |
94 Properties |
| 2006 | £120,165 | -1% |
94 Properties |
| 2005 | £121,062 | 9% |
54 Properties |
| 2004 | £109,732 | 27% |
81 Properties |
| 2003 | £80,434 | 17% |
89 Properties |
| 2002 | £66,786 | -9% |
125 Properties |
| 2001 | £72,516 | 21% |
121 Properties |
| 2000 | £57,066 | 14% |
85 Properties |
| 1999 | £49,182 | 10% |
54 Properties |
| 1998 | £44,491 | -46% |
51 Properties |
| 1997 | £64,931 | 36% |
58 Properties |
| 1996 | £41,312 | 5% |
45 Properties |
| 1995 | £39,145 | - |
49 Properties |
Property Price per Property Type in Morfa
Here you can find historic sold price data in order to help with your property search.
The average Property Paid Price for specific property types in the last three years are:
| Property Type | Average Sold Price | Sold Properties |
|---|---|---|
| Semi Detached House | £195,005.00 | 73 Semi Detached Houses |
| Detached House | £259,704.00 | 12 Detached Houses |
| Terraced House | £156,182.00 | 85 Terraced Houses |
| Flat | £105,993.00 | 8 Flats |

