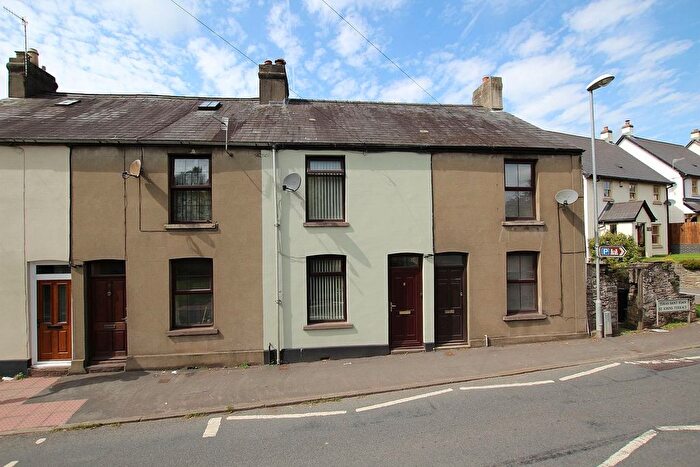
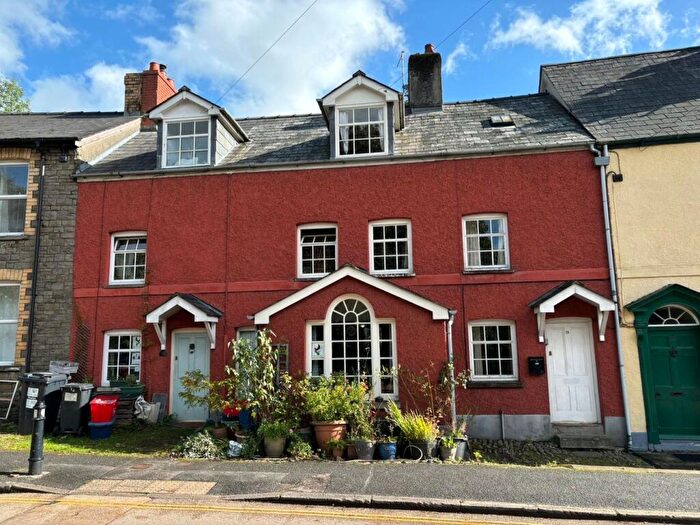
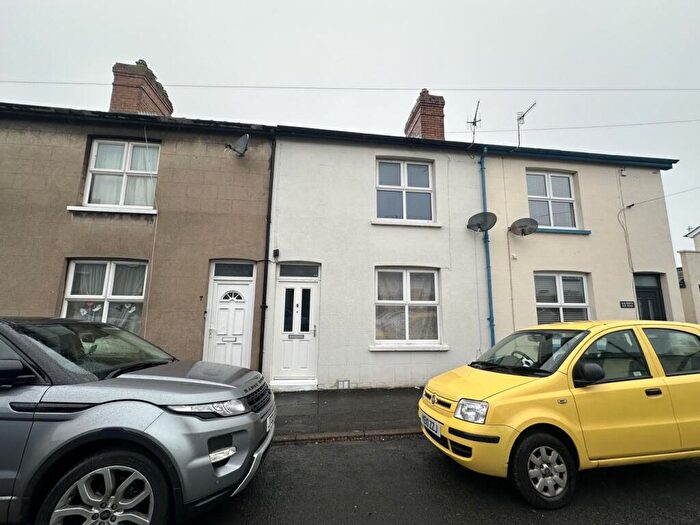
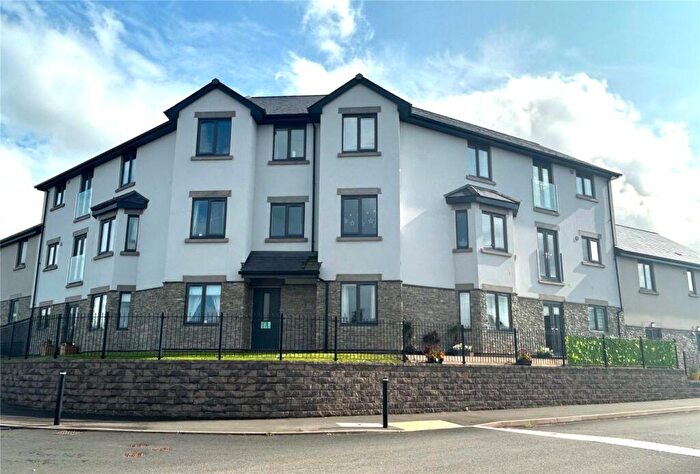
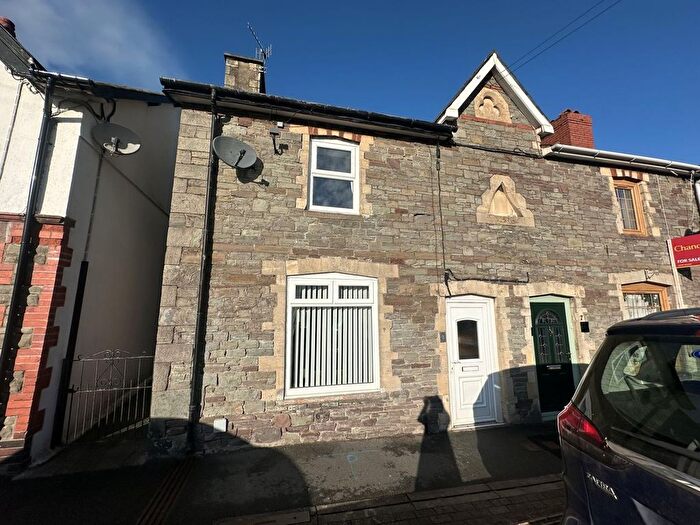
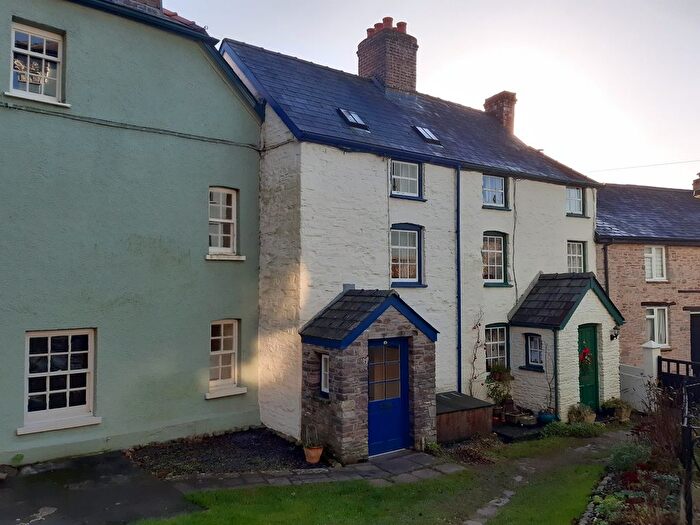
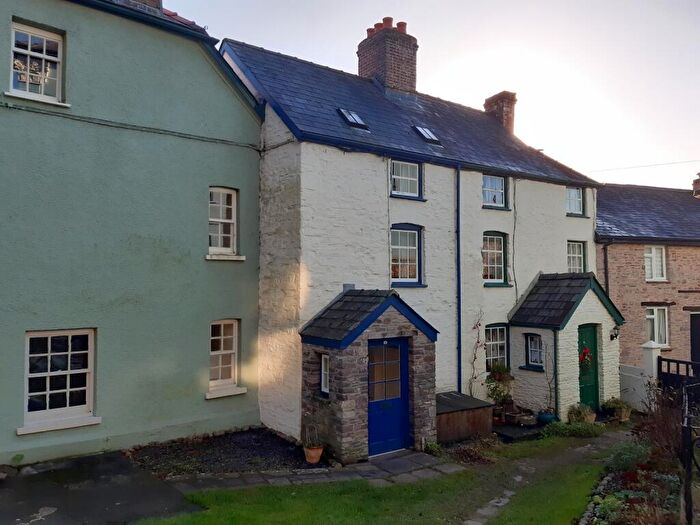
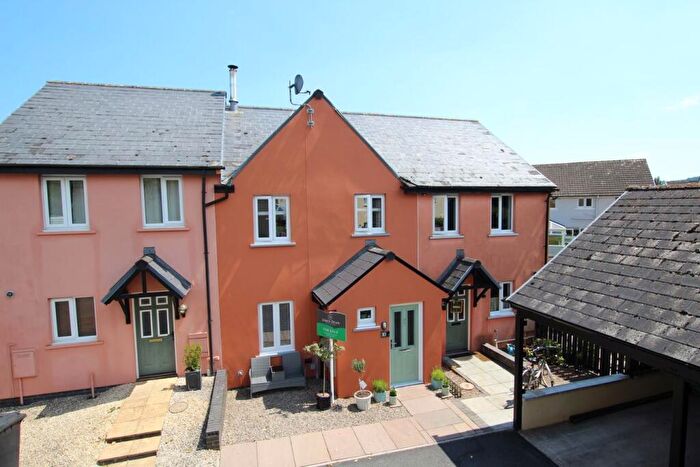
Houses for sale & to rent in St. John, Brecon
House Prices in St. John
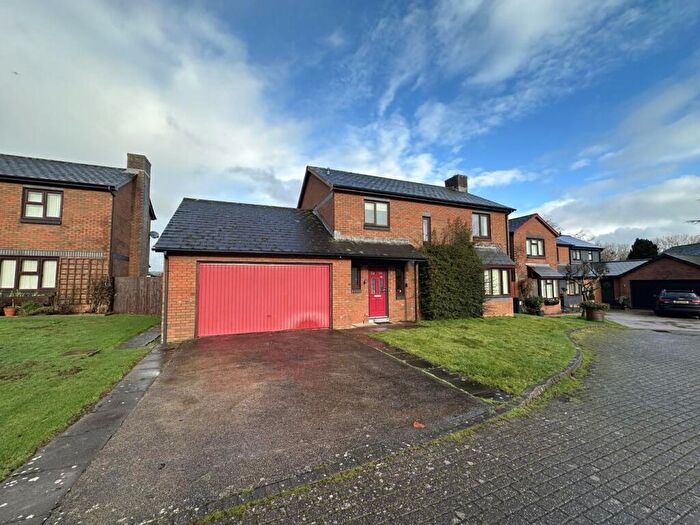
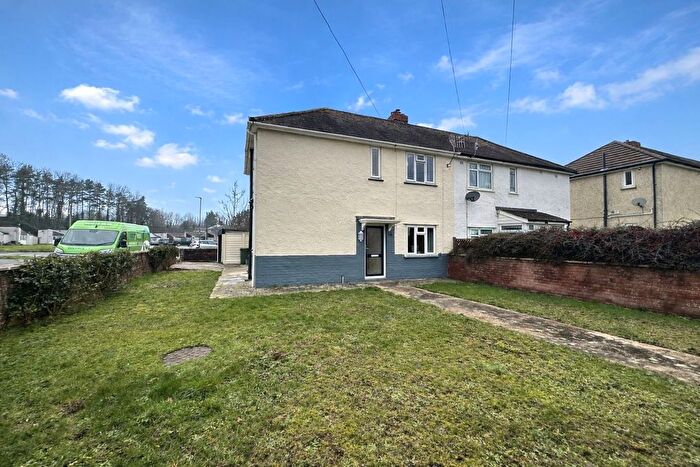
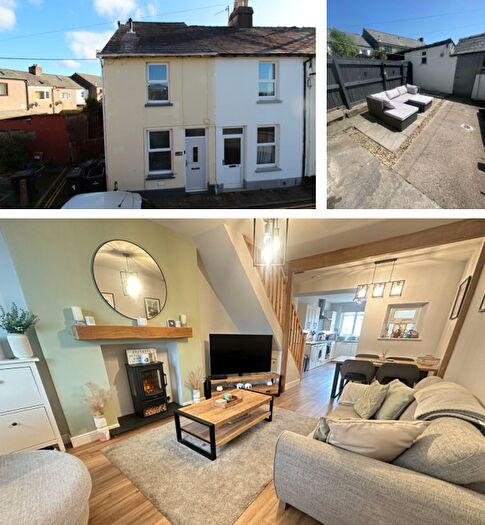
Properties in St. John have an average house price of £258,817.00 and had 99 Property Transactions within the last 3 years¹.
St. John is an area in Brecon, Powys - Powys with 1,471 households², where the most expensive property was sold for £665,000.00.
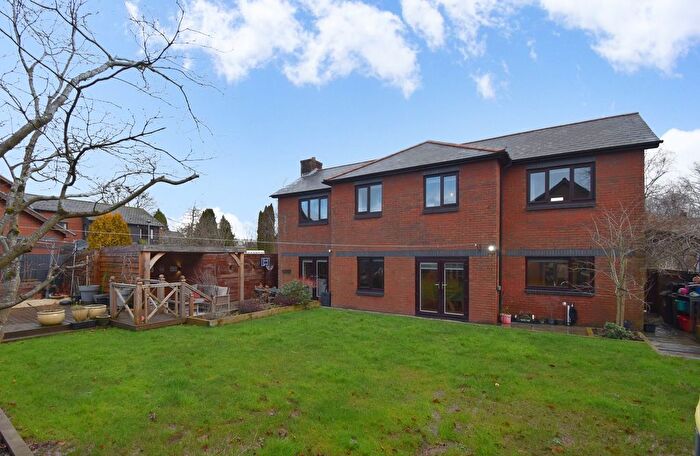
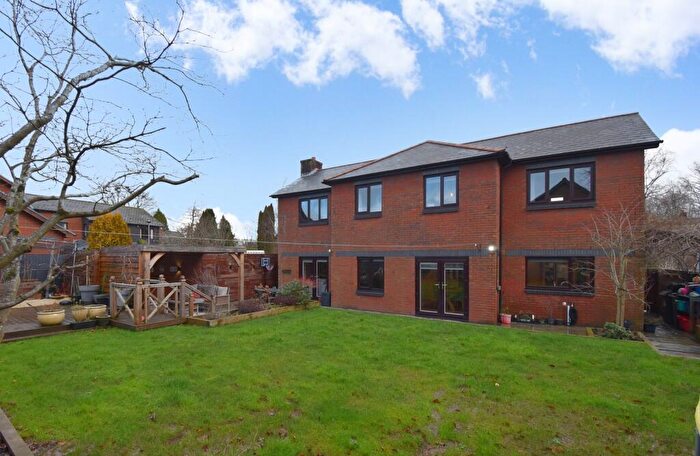
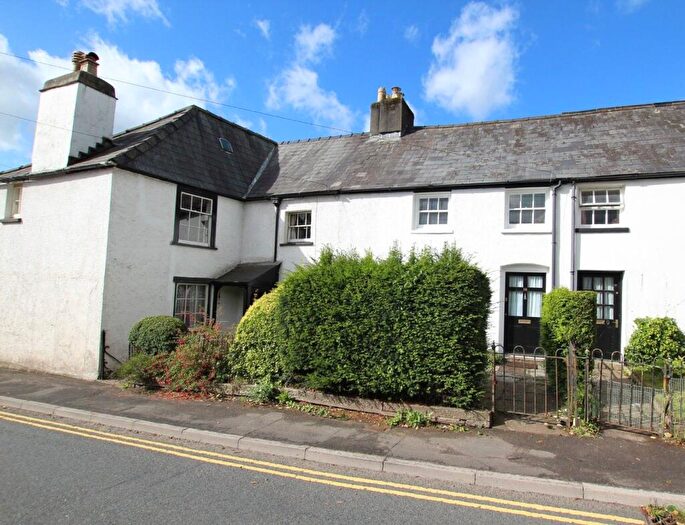
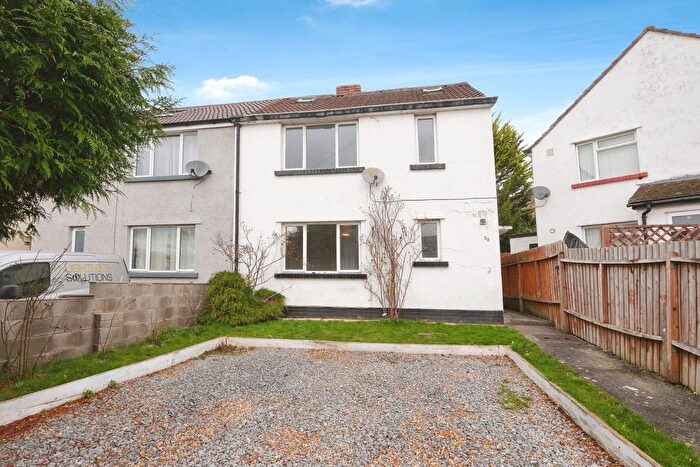
Properties for sale in St. John
Roads and Postcodes in St. John
Navigate through our locations to find the location of your next house in St. John, Brecon for sale or to rent.
| Streets | Postcodes |
|---|---|
| Beacons Park | LD3 9BP LD3 9BQ LD3 9BR |
| Beech Grove | LD3 9ET LD3 9EY |
| Bron Y Crug | LD3 9LE LD3 9LF |
| Bryn De Winton | LD3 9HL LD3 9HN |
| Cae Derw | LD3 9UD |
| Cathedral Close | LD3 9DP |
| Coryton Close | LD3 9HP LD3 9HW |
| Cradoc Close | LD3 9UA LD3 9UB LD3 9UE |
| Cradoc Road | LD3 9LG LD3 9LH LD3 9PF |
| Dainter Street | LD3 9DY |
| Dan Y Crug | LD3 9LD |
| Fenni Fach Road | LD3 9LL |
| Fronwen Terrace | LD3 9HB |
| Golwg Y Fan | LD3 9HJ |
| Honddu Court | LD3 7JW |
| Maendu Street | LD3 9HD |
| Maendu Terrace | LD3 9HF LD3 9HH |
| Maes Y Ffynnon | LD3 9PL |
| Maes Y Fynnon | LD3 9PN |
| Mill Green | LD3 9BA |
| North Road | LD3 9DR |
| Parc Pendre | LD3 9ER LD3 9ES |
| Pendre | LD3 9EA LD3 9HG |
| Pendre Close | LD3 9EH LD3 9EL LD3 9EN LD3 9EW LD3 9ED LD3 9EU |
| Pendre Gardens | LD3 9EP LD3 9EQ |
| Peppercorn Lane | LD3 9EG |
| Pontwilym | LD3 9BS LD3 9BT |
| Priory Court | LD3 9DX |
| Priory Gardens | LD3 9DL |
| Priory Hill | LD3 9DN LD3 9DW |
| Priory Row | LD3 9HE |
| Prospect Close | LD3 9HA |
| St Johns Court | LD3 9EF |
| St Johns Road | LD3 9DS |
| St Johns Terrace | LD3 9EB |
| The Struet | LD3 7LP |
| The Uplands | LD3 9HR LD3 9HT LD3 9HU LD3 9HY LD3 9HS |
| LD3 9PG LD3 9UF |
Transport near St. John
-
Llangammarch Station
-
Garth (Powys) Station
-
Cilmeri Station
-
Rhymney Station
-
Merthyr Tydfil Station
-
Llanwrtyd Station
-
Ebbw Vale Town Station
- FAQ
- Price Paid By Year
- Property Type Price
Frequently asked questions about St. John
What is the average price for a property for sale in St. John?
The average price for a property for sale in St. John is £258,817. This amount is 12% lower than the average price in Brecon. There are 297 property listings for sale in St. John.
What streets have the most expensive properties for sale in St. John?
The streets with the most expensive properties for sale in St. John are Cradoc Road at an average of £353,535, Beacons Park at an average of £338,229 and Pendre Close at an average of £303,750.
What streets have the most affordable properties for sale in St. John?
The streets with the most affordable properties for sale in St. John are Maes Y Ffynnon at an average of £130,800, Dainter Street at an average of £135,750 and Maendu Street at an average of £156,000.
Which train stations are available in or near St. John?
Some of the train stations available in or near St. John are Llangammarch, Garth (Powys) and Cilmeri.
Property Price Paid in St. John by Year
The average sold property price by year was:
| Year | Average Sold Price | Price Change |
Sold Properties
|
|---|---|---|---|
| 2025 | £268,323 | 7% |
30 Properties |
| 2024 | £249,310 | -5% |
38 Properties |
| 2023 | £261,271 | 4% |
31 Properties |
| 2022 | £250,701 | 4% |
43 Properties |
| 2021 | £239,700 | 23% |
56 Properties |
| 2020 | £185,104 | -4% |
34 Properties |
| 2019 | £192,896 | -9% |
39 Properties |
| 2018 | £209,681 | 10% |
35 Properties |
| 2017 | £188,646 | -2% |
44 Properties |
| 2016 | £192,225 | 15% |
46 Properties |
| 2015 | £164,225 | -4% |
38 Properties |
| 2014 | £170,232 | 4% |
28 Properties |
| 2013 | £163,478 | -1% |
37 Properties |
| 2012 | £165,329 | -9% |
34 Properties |
| 2011 | £180,373 | 6% |
32 Properties |
| 2010 | £170,122 | -1% |
21 Properties |
| 2009 | £171,549 | -2% |
29 Properties |
| 2008 | £175,000 | 9% |
19 Properties |
| 2007 | £159,458 | -9% |
70 Properties |
| 2006 | £173,958 | 9% |
59 Properties |
| 2005 | £158,300 | 6% |
30 Properties |
| 2004 | £149,574 | 12% |
55 Properties |
| 2003 | £130,951 | 12% |
53 Properties |
| 2002 | £115,122 | 30% |
51 Properties |
| 2001 | £80,119 | 10% |
53 Properties |
| 2000 | £72,019 | 7% |
46 Properties |
| 1999 | £66,689 | -14% |
51 Properties |
| 1998 | £75,969 | 17% |
44 Properties |
| 1997 | £62,762 | 5% |
53 Properties |
| 1996 | £59,629 | -7% |
59 Properties |
| 1995 | £63,814 | - |
49 Properties |
Property Price per Property Type in St. John
Here you can find historic sold price data in order to help with your property search.
The average Property Paid Price for specific property types in the last three years are:
| Property Type | Average Sold Price | Sold Properties |
|---|---|---|
| Semi Detached House | £245,619.00 | 36 Semi Detached Houses |
| Detached House | £325,689.00 | 36 Detached Houses |
| Terraced House | £187,251.00 | 27 Terraced Houses |

