Houses for sale & to rent in Knighton, Knighton
House Prices in Knighton
Properties in Knighton have an average house price of £231,088.00 and had 105 Property Transactions within the last 3 years¹.
Knighton is an area in Knighton, Powys - Powys with 1,399 households², where the most expensive property was sold for £650,000.00.
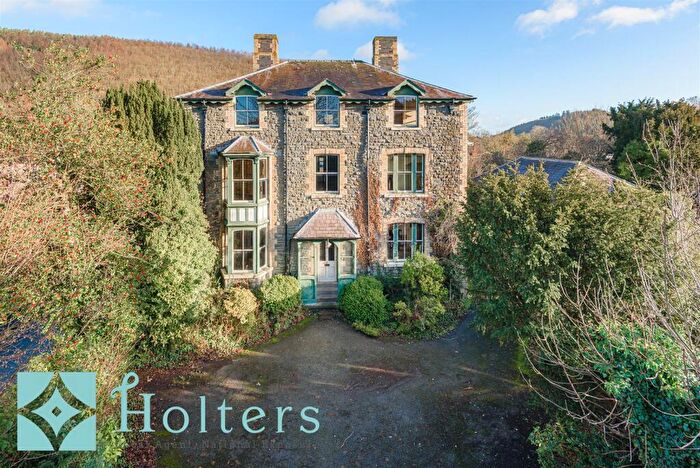
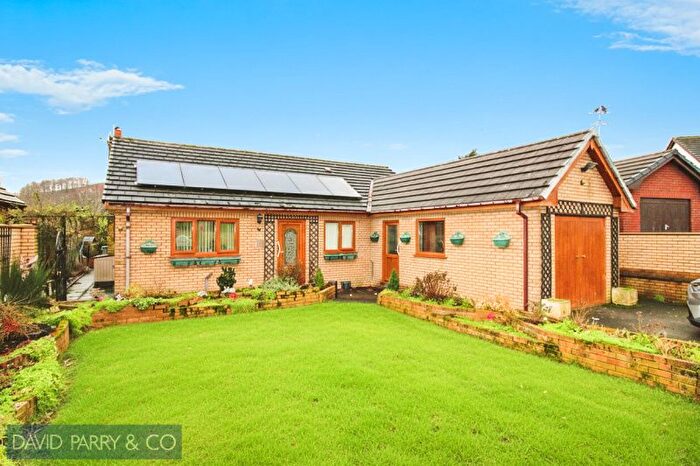
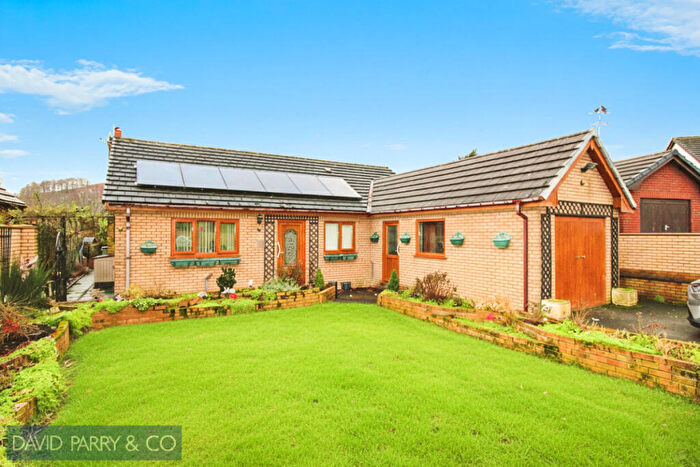
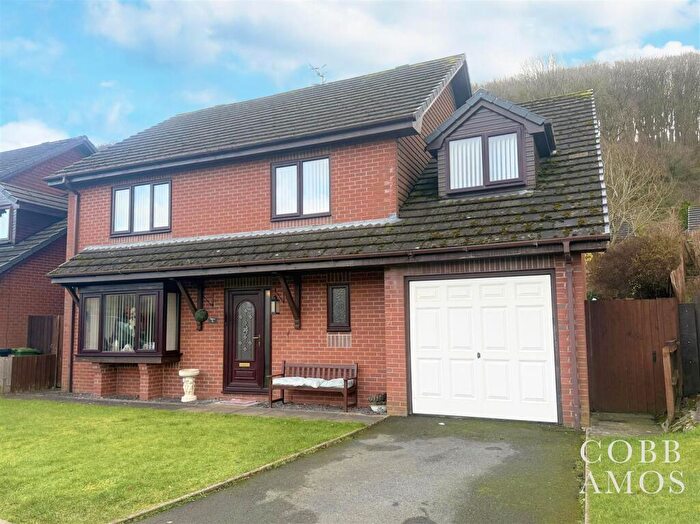
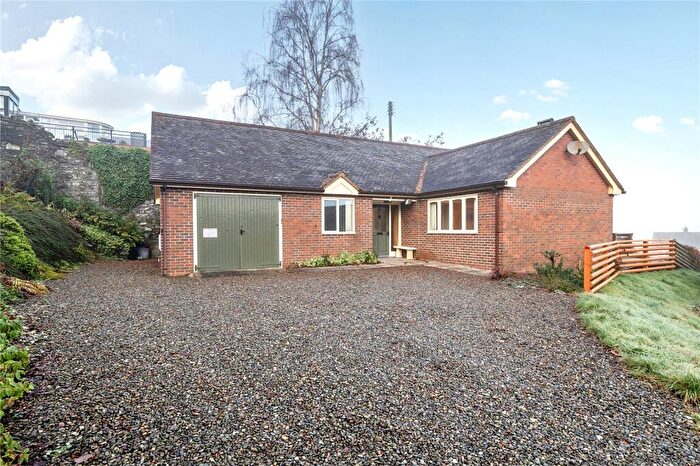
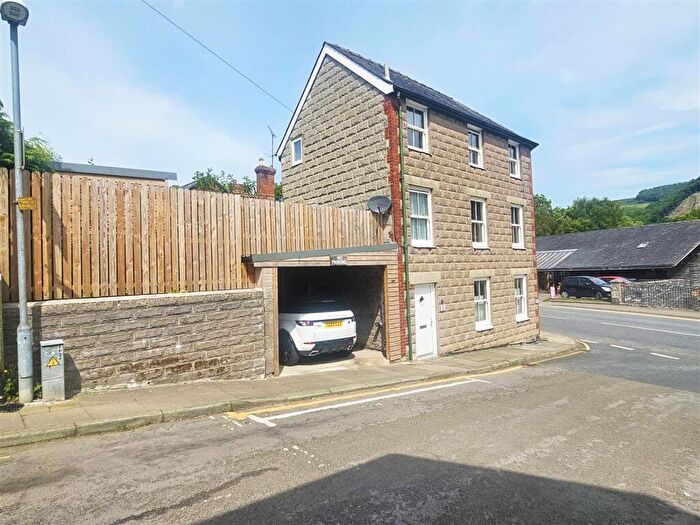
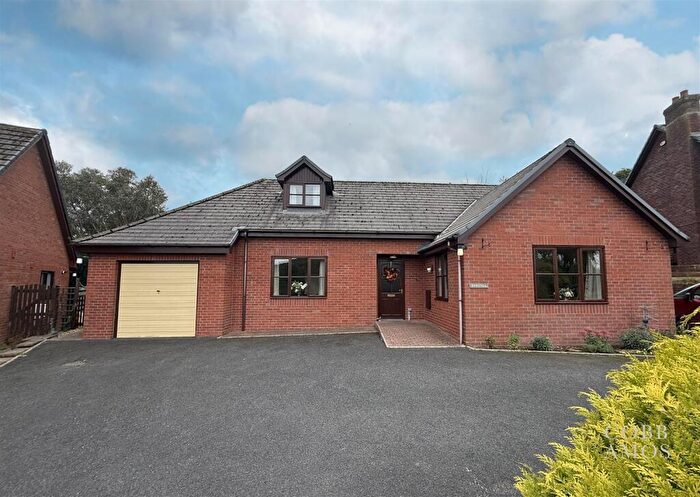
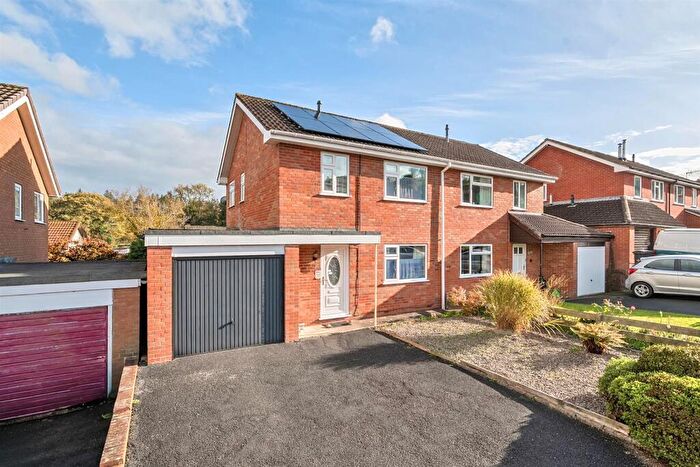
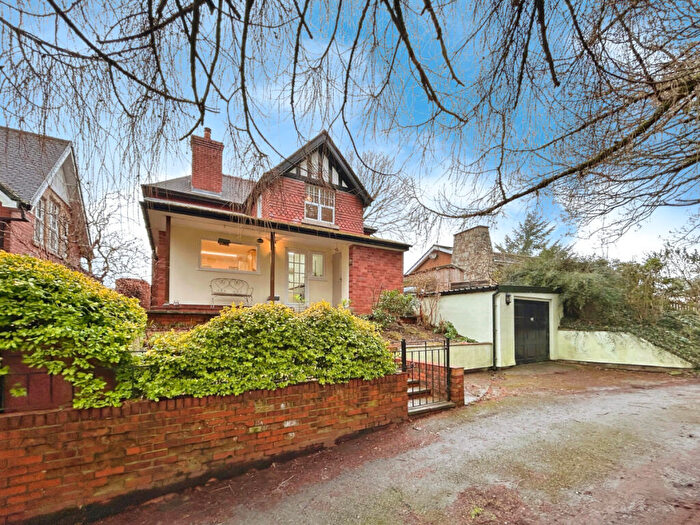
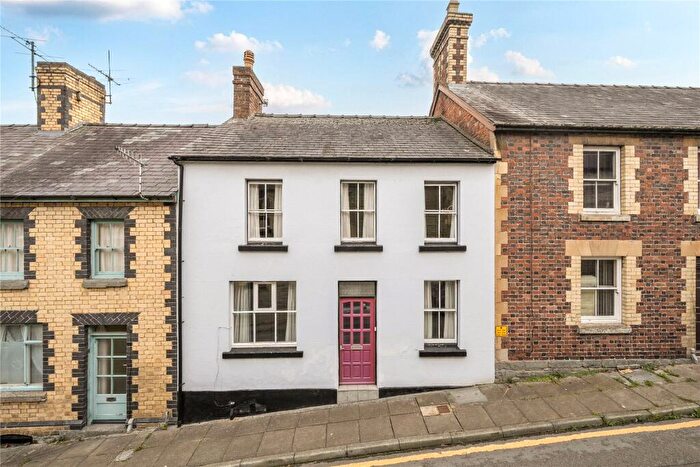
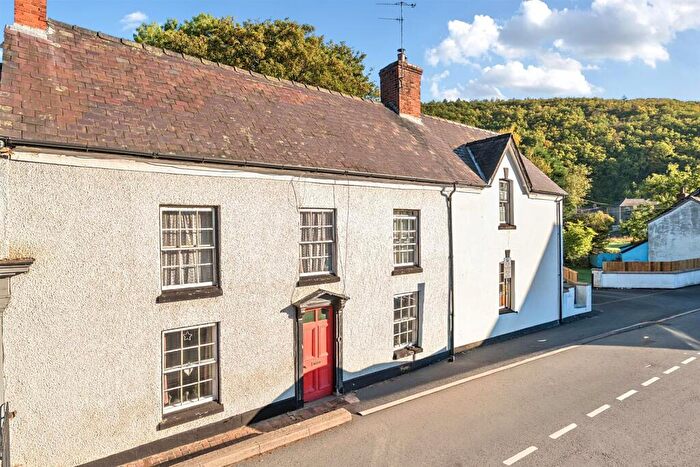
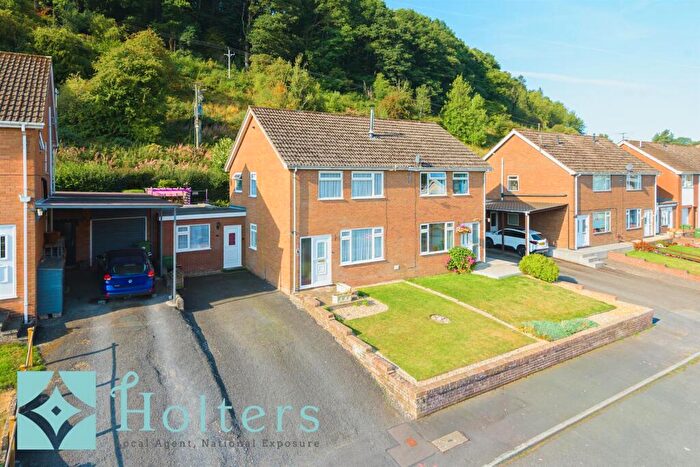
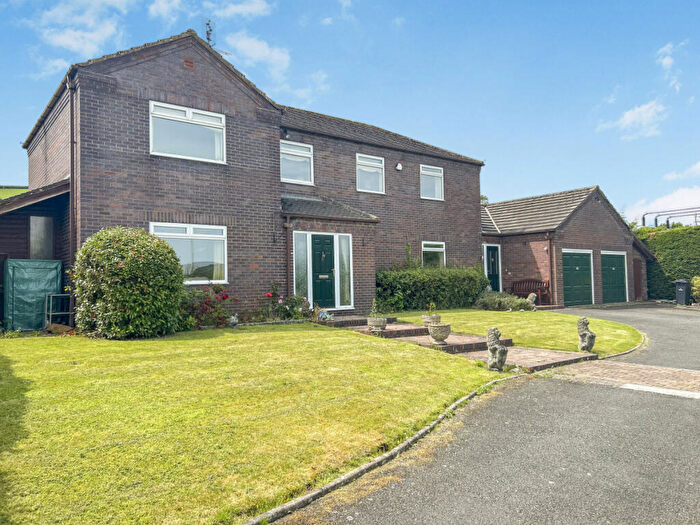
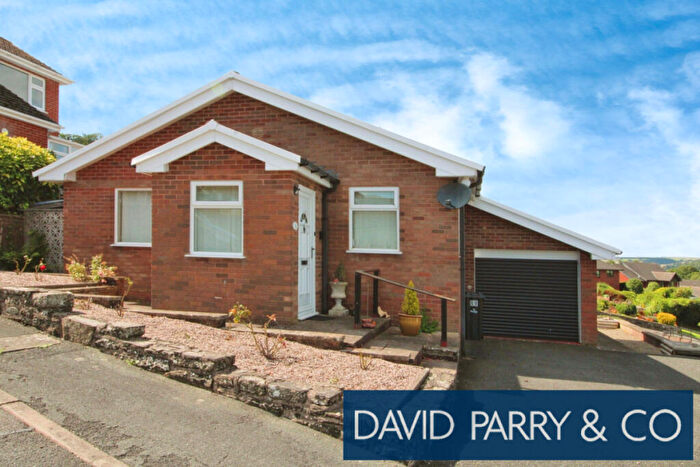
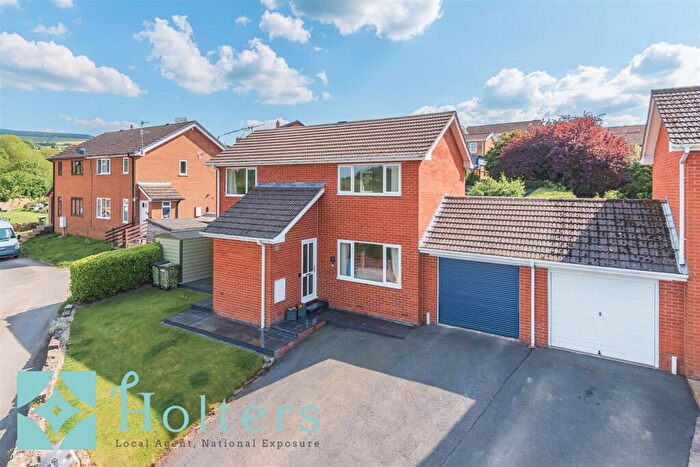
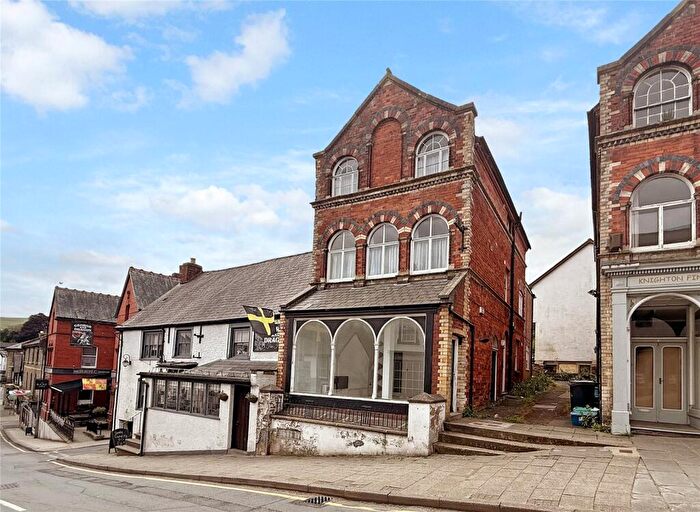
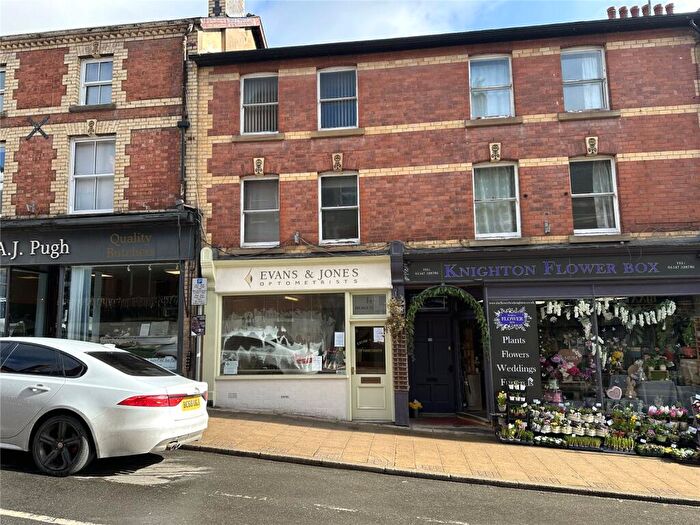
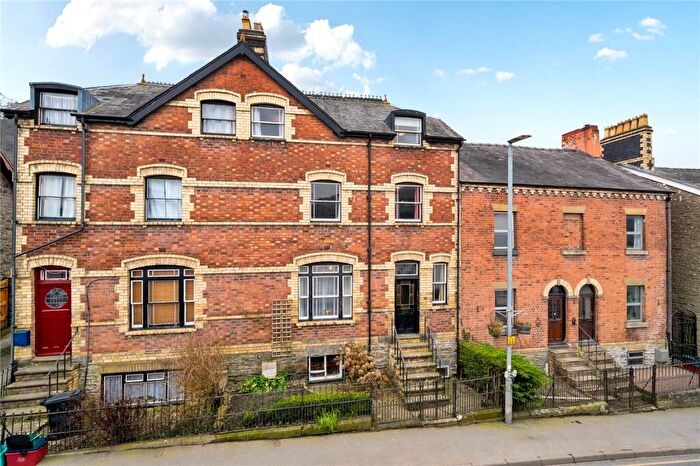
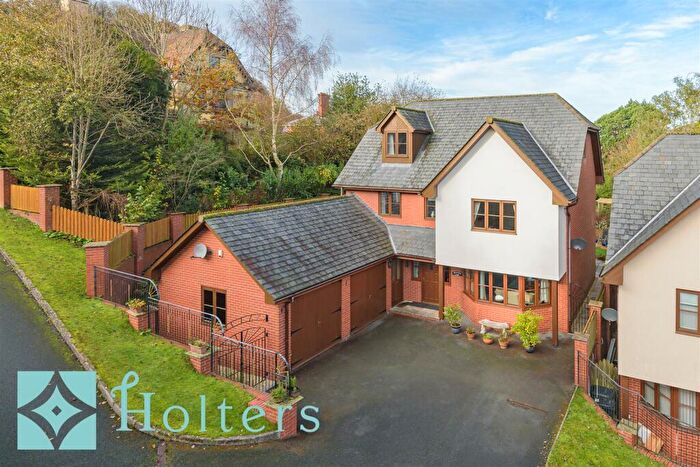
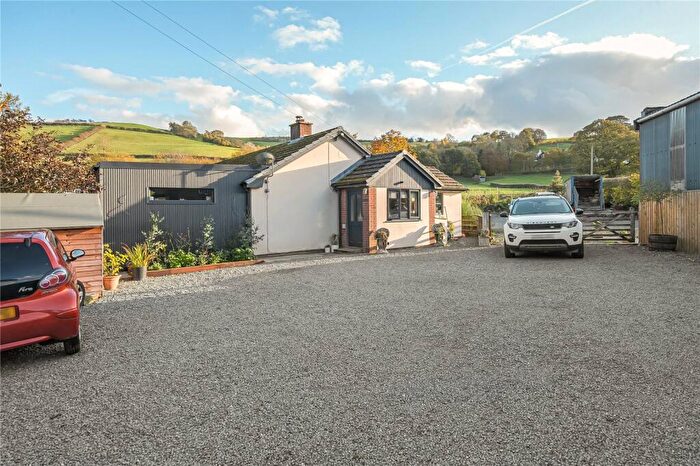
Properties for sale in Knighton
Roads and Postcodes in Knighton
Navigate through our locations to find the location of your next house in Knighton, Knighton for sale or to rent.
| Streets | Postcodes |
|---|---|
| Bowling Green Lane | LD7 1DR LD7 1DS |
| Bridge Street | LD7 1BT LD7 1HU LD7 1BG |
| Broad Street | LD7 1AF LD7 1BS |
| Brookside | LD7 1DP LD7 1DW |
| Bryntirion Close | LD7 1HX |
| Cae Clawdd | LD7 1DQ |
| Castle Road | LD7 1BA |
| Chapel Close | LD7 1BL |
| Church Road | LD7 1EB LD7 1ED |
| Church Street | LD7 1AG |
| Conjurors Drive | LD7 1EP |
| Crabtree Walk | LD7 1EW |
| Cwmgilla Lane | LD7 1PG |
| Farrington Lane | LD7 1LA |
| Fernwood Court | LD7 1HZ |
| Ffrydd Close | LD7 1DH |
| Ffrydd Road | LD7 1DB LD7 1DE LD7 1DF |
| Ffrydd Terrace | LD7 1DL |
| Fronhir Estate | LD7 1HT |
| Garth Lane | LD7 1HH LD7 1SA LD7 1SB |
| Garth Meadow | LD7 1LG |
| Garth Terrace | LD7 1HB |
| George Close | LD7 1HL |
| George Road | LD7 1HF LD7 1RS |
| Grove Close | LD7 1LJ |
| Hatfield Court | LD7 1EH |
| Hatfield Meadow | LD7 1RY |
| High Street | LD7 1AT LD7 1AU |
| Jackets Close | LD7 1EG |
| Knighton Enterprise Park | LD7 1HJ |
| Knucklas Road | LD7 1UP |
| Larkey Lane | LD7 1DN |
| Laurels Meadow | LD7 1HD |
| Llanshay Lane | LD7 1LW |
| Ludlow Road | LD7 1HP LD7 1LP |
| Market Street | LD7 1EY LD7 1BB |
| Mill Green | LD7 1EE |
| Mill Road | LD7 1RT |
| Millfield Close | LD7 1HE |
| Noble Court | LD7 1LB |
| Norton Street | LD7 1ET |
| Offas Road | LD7 1ER LD7 1ES |
| Offas Way | LD7 1AL |
| Penybont Road | LD7 1SD |
| Plough Road | LD7 1HA |
| Pontfaen Close | LD7 1HW |
| Pontfaen Estate | LD7 1HS |
| Presteigne Road | LD7 1HY LD7 1LN |
| Radnor Drive | LD7 1HN |
| Rockes Meadow | LD7 1LE |
| Rookery Lane | LD7 1UR |
| Russell Street | LD7 1EU |
| Seven Acres | LD7 1LF |
| St Edwards Close | LD7 1AJ LD7 1AS LD7 1AN LD7 1AP LD7 1AR LD7 1AW LD7 1BE |
| Station Road | LD7 1DT |
| The Cwm | LD7 1HG |
| The Dingle | LD7 1LD |
| Under Ffrydd Wood | LD7 1EF |
| Underhill Crescent | LD7 1DG |
| Victoria Road | LD7 1BD |
| West Street | LD7 1EN |
| Wylcwm Court | LD7 1AQ |
| Wylcwm Place | LD7 1AE |
| Wylcwm Street | LD7 1AA LD7 1AD |
| LD7 1LR LD7 1LT LD7 1NA LD7 1NG LD7 1PH LD7 1DJ LD7 1HQ LD7 1LS LD7 1LU LD7 1LY LD7 1UT |
Transport near Knighton
- FAQ
- Price Paid By Year
- Property Type Price
Frequently asked questions about Knighton
What is the average price for a property for sale in Knighton?
The average price for a property for sale in Knighton is £231,088. This amount is 7% lower than the average price in Knighton. There are 261 property listings for sale in Knighton.
What streets have the most expensive properties for sale in Knighton?
The streets with the most expensive properties for sale in Knighton are Wylcwm Street at an average of £550,000, Presteigne Road at an average of £389,750 and Ffrydd Road at an average of £360,833.
What streets have the most affordable properties for sale in Knighton?
The streets with the most affordable properties for sale in Knighton are St Edwards Close at an average of £63,366, Radnor Drive at an average of £113,875 and Chapel Close at an average of £120,000.
Which train stations are available in or near Knighton?
Some of the train stations available in or near Knighton are Knighton, Knucklas and Bucknell.
Property Price Paid in Knighton by Year
The average sold property price by year was:
| Year | Average Sold Price | Price Change |
Sold Properties
|
|---|---|---|---|
| 2025 | £230,952 | -6% |
37 Properties |
| 2024 | £245,500 | 9% |
26 Properties |
| 2023 | £222,286 | -6% |
42 Properties |
| 2022 | £236,083 | 20% |
60 Properties |
| 2021 | £188,015 | 13% |
65 Properties |
| 2020 | £163,865 | -3% |
47 Properties |
| 2019 | £168,158 | -2% |
50 Properties |
| 2018 | £170,730 | -8% |
54 Properties |
| 2017 | £184,569 | 2% |
54 Properties |
| 2016 | £181,638 | 5% |
43 Properties |
| 2015 | £172,217 | 11% |
37 Properties |
| 2014 | £152,604 | -2% |
56 Properties |
| 2013 | £155,147 | -4% |
37 Properties |
| 2012 | £160,633 | -5% |
33 Properties |
| 2011 | £168,958 | 22% |
24 Properties |
| 2010 | £131,722 | -9% |
30 Properties |
| 2009 | £144,103 | -16% |
29 Properties |
| 2008 | £167,358 | -7% |
39 Properties |
| 2007 | £178,728 | 6% |
63 Properties |
| 2006 | £167,237 | 17% |
50 Properties |
| 2005 | £138,542 | 10% |
53 Properties |
| 2004 | £124,963 | 8% |
38 Properties |
| 2003 | £114,378 | 6% |
59 Properties |
| 2002 | £107,214 | 30% |
53 Properties |
| 2001 | £74,976 | 4% |
65 Properties |
| 2000 | £71,752 | 27% |
39 Properties |
| 1999 | £52,285 | -3% |
53 Properties |
| 1998 | £53,931 | -8% |
41 Properties |
| 1997 | £58,274 | 14% |
49 Properties |
| 1996 | £49,837 | 0,5% |
46 Properties |
| 1995 | £49,602 | - |
36 Properties |
Property Price per Property Type in Knighton
Here you can find historic sold price data in order to help with your property search.
The average Property Paid Price for specific property types in the last three years are:
| Property Type | Average Sold Price | Sold Properties |
|---|---|---|
| Semi Detached House | £227,391.00 | 23 Semi Detached Houses |
| Detached House | £300,092.00 | 42 Detached Houses |
| Terraced House | £168,656.00 | 37 Terraced Houses |
| Flat | £63,366.00 | 3 Flats |

