
Houses for sale & to rent in Glantwymyn, Machynlleth
House Prices in Glantwymyn
Properties in Glantwymyn have an average house price of £236,967.00 and had 61 Property Transactions within the last 3 years¹.
Glantwymyn is an area in Machynlleth, Powys - Powys with 888 households², where the most expensive property was sold for £590,000.00.
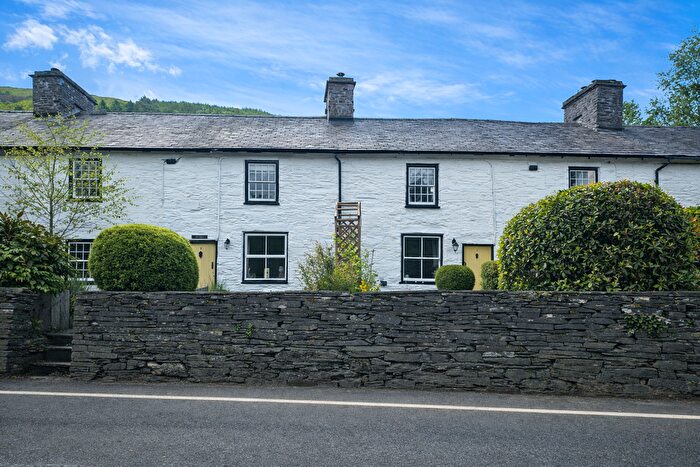
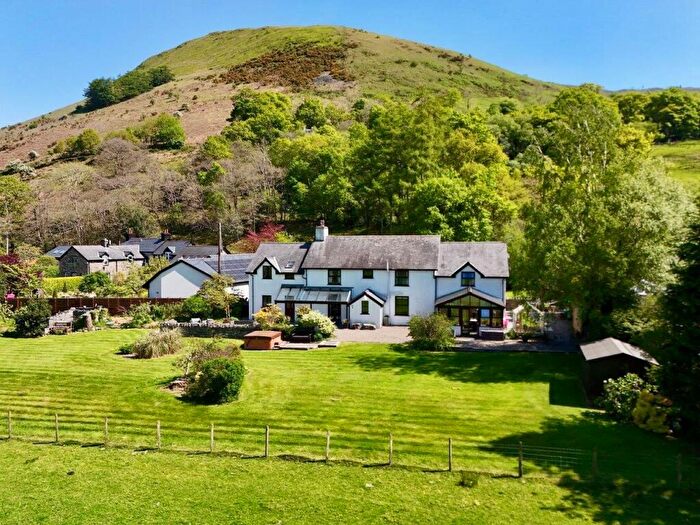
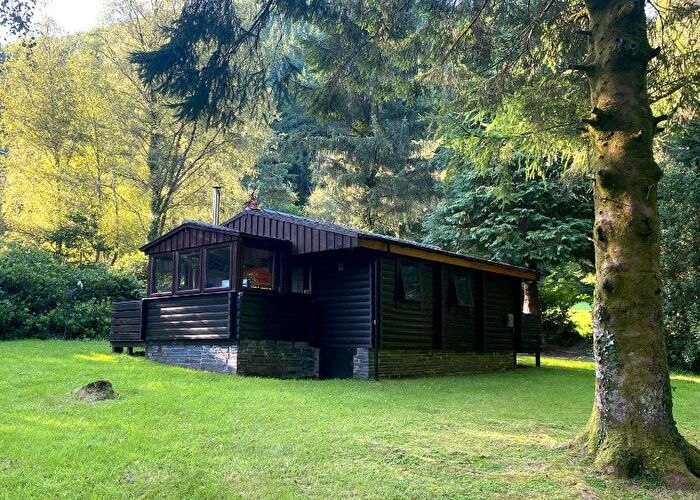
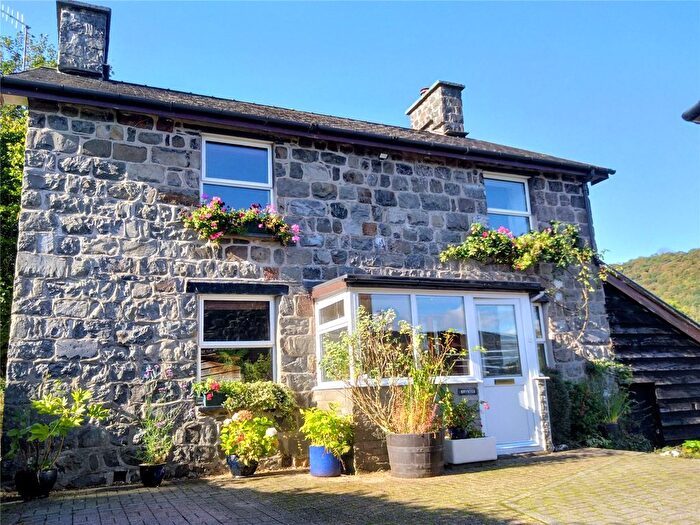
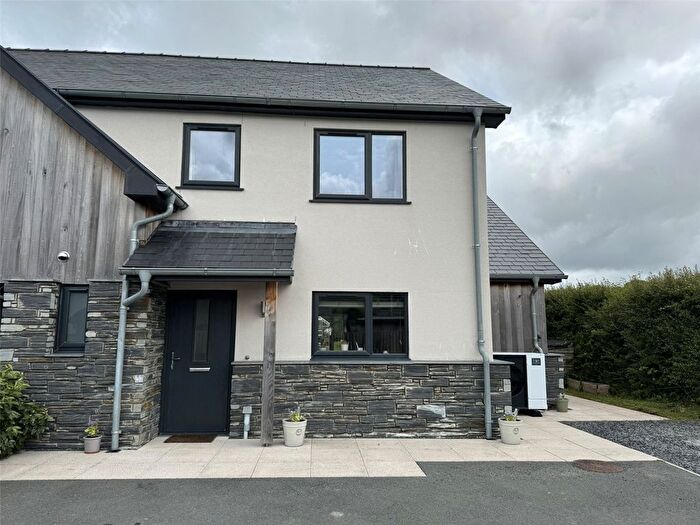
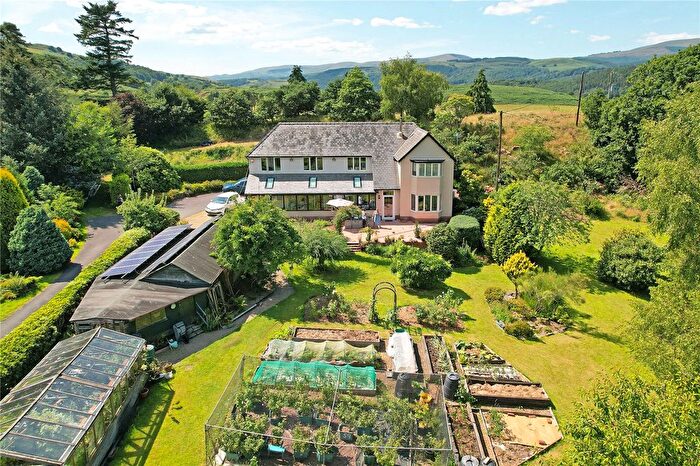
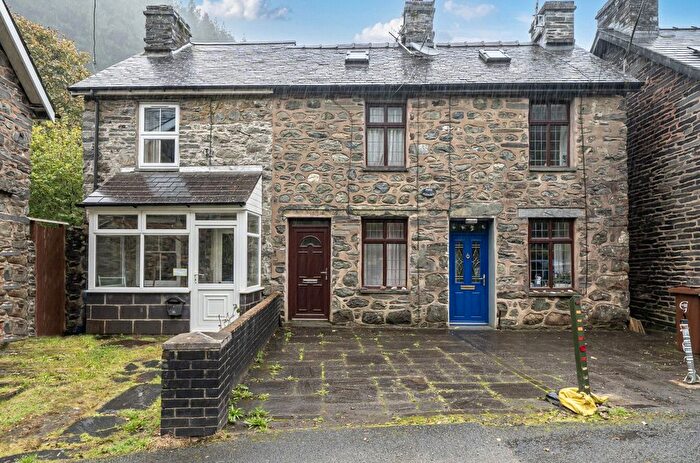
Properties for sale in Glantwymyn
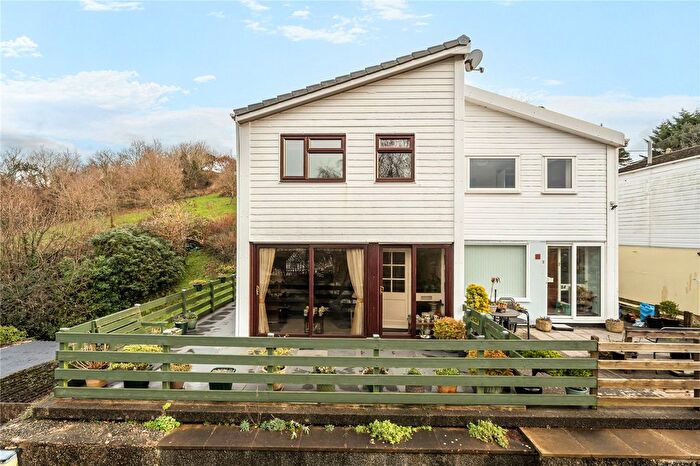
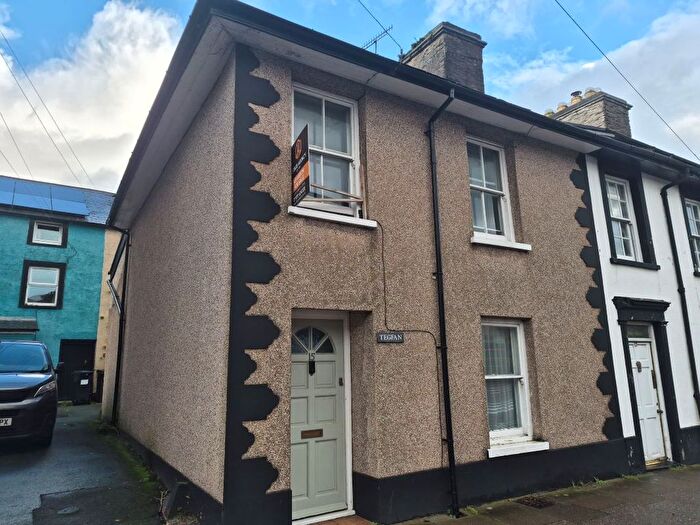
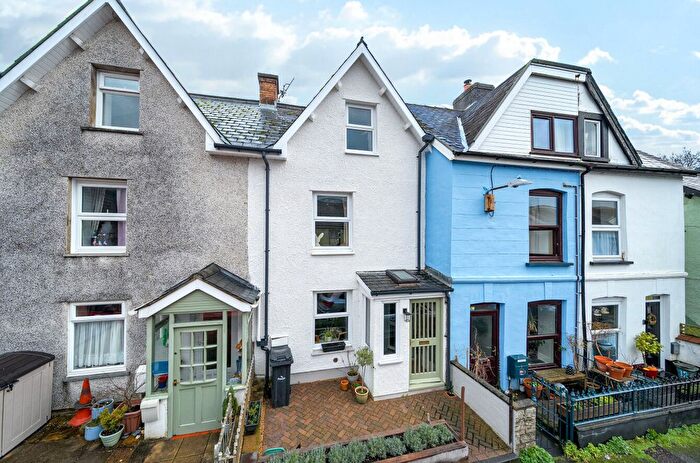
![]()
If you are looking to sell your house, let it out, or receive a property valuation, an expert can help you.
Click the button below to get started.
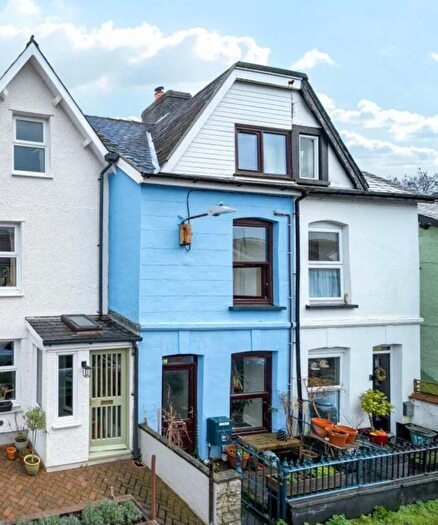
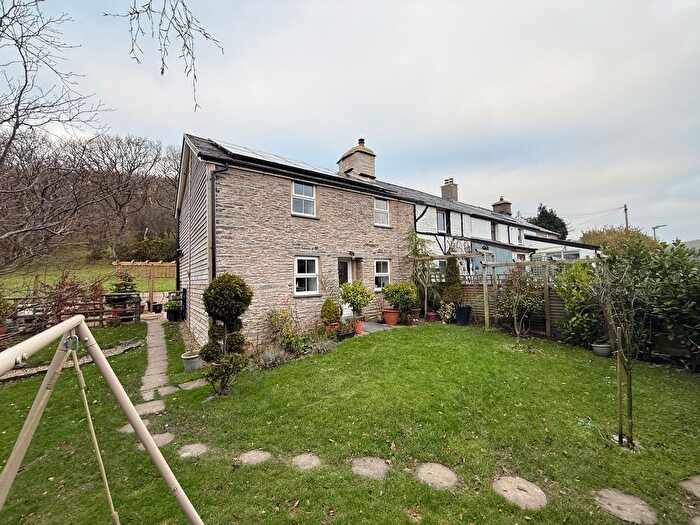
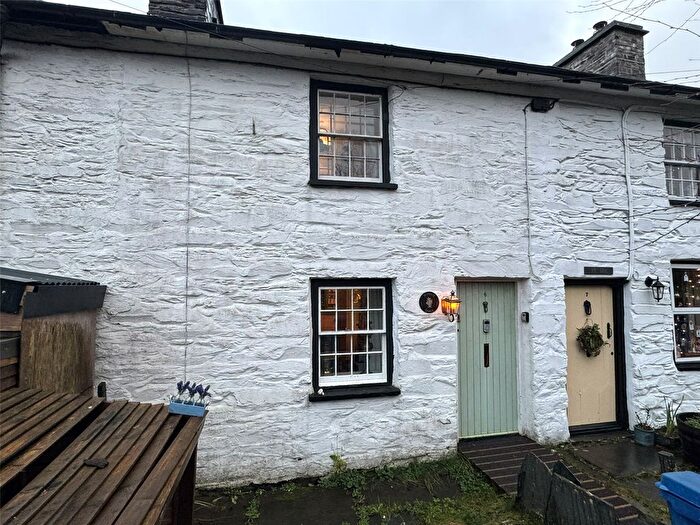
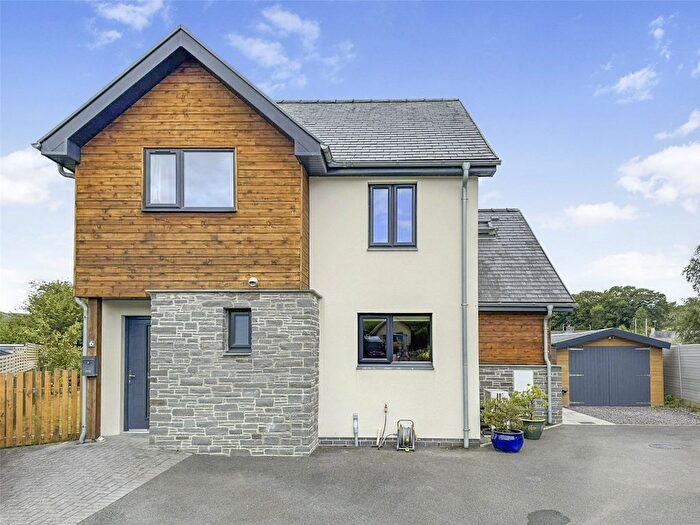
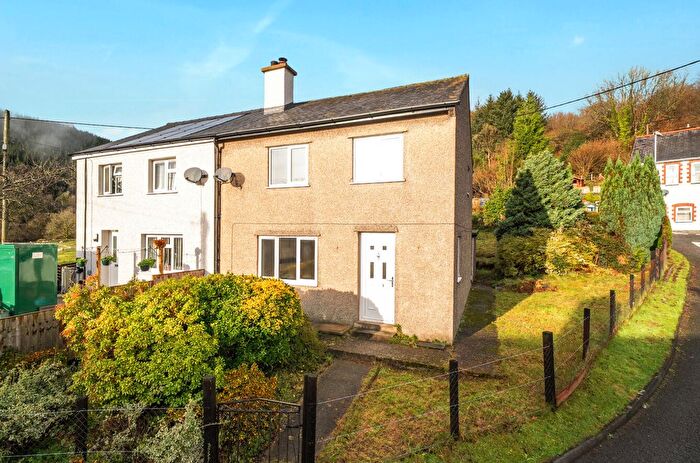
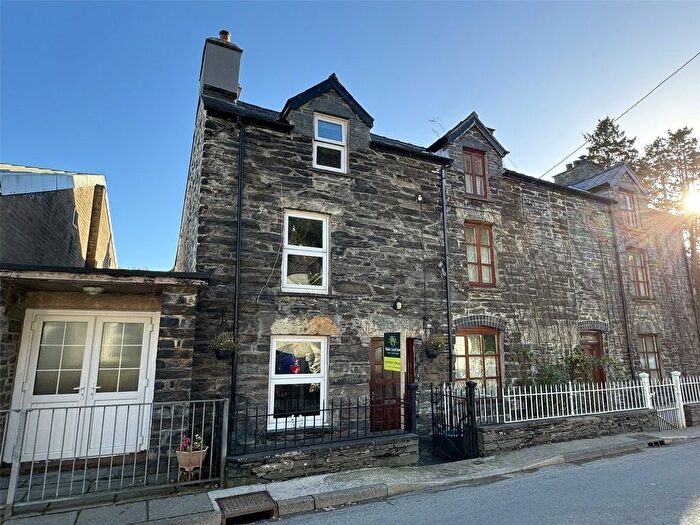
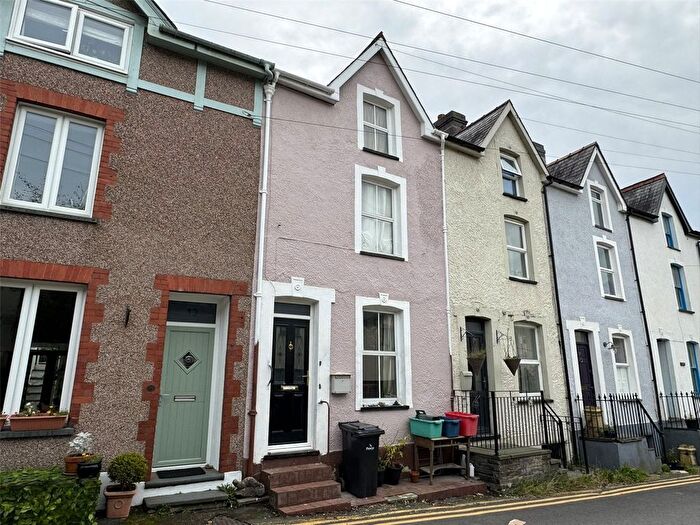
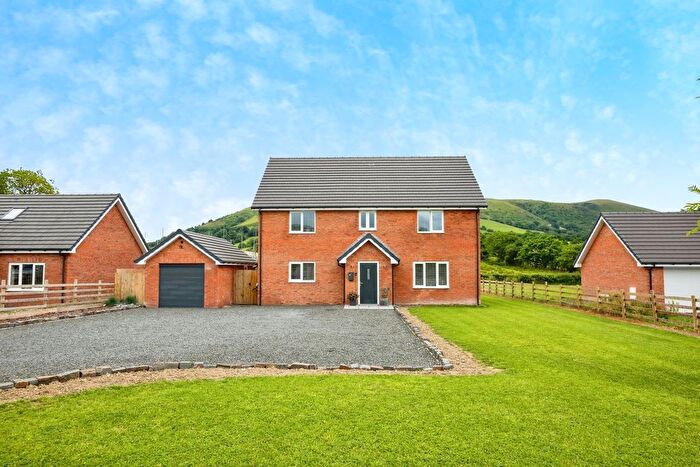
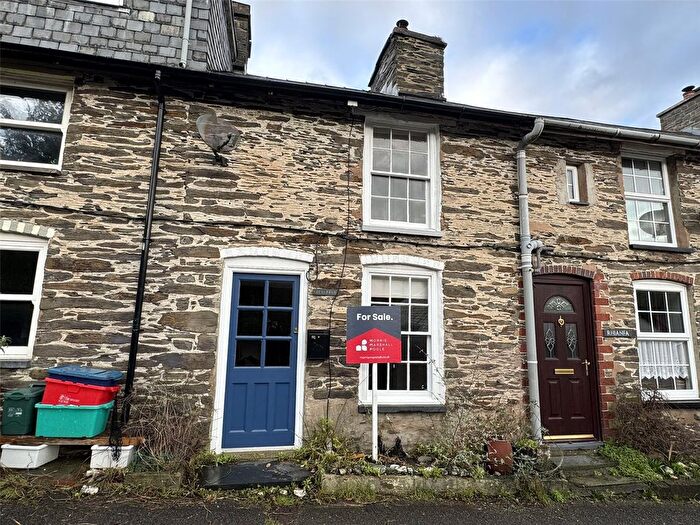
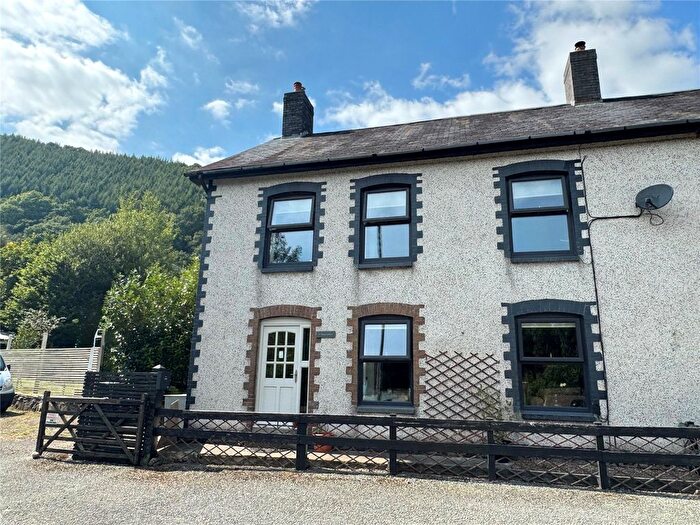
Previously listed properties in Glantwymyn

![]()
If you are looking to sell your house, let it out, or receive a property valuation, an expert can help you.
Click the button below to get started.
Roads and Postcodes in Glantwymyn
Navigate through our locations to find the location of your next house in Glantwymyn, Machynlleth for sale or to rent.
Transport near Glantwymyn
-
 Machynlleth Station
 -
Dovey Junction Station
-
Penhelig Station
-
Morfa Mawddach Station
-
Aberdovey Station
-
Fairbourne Station
-
Tywyn Station
-
Llwyngwril Station
-
Barmouth Station
-
Borth Station
- FAQ
- Price Paid By Year
- Property Type Price
Frequently asked questions about Glantwymyn
What is the average price for a property for sale in Glantwymyn?
The average price for a property for sale in Glantwymyn is £236,967. This amount is 11% higher than the average price in Machynlleth. There are 320 property listings for sale in Glantwymyn.
What streets have the most expensive properties for sale in Glantwymyn?
The streets with the most expensive properties for sale in Glantwymyn are Forge at an average of £312,178, Cemmaes Road at an average of £300,000 and Pencaemawr at an average of £294,583.
What streets have the most affordable properties for sale in Glantwymyn?
The streets with the most affordable properties for sale in Glantwymyn are The Terrace at an average of £120,166, Ivy Terrace at an average of £143,750 and Glynderwen at an average of £169,000.
Which train stations are available in or near Glantwymyn?
Some of the train stations available in or near Glantwymyn are Machynlleth, Dovey Junction and Penhelig.
Property Price Paid in Glantwymyn by Year
The average sold property price by year was:
| Year | Average Sold Price | Price Change |
Sold Properties
|
|---|---|---|---|
| 2025 | £229,000 | 1% |
12 Properties |
| 2024 | £226,352 | -10% |
22 Properties |
| 2023 | £249,157 | -12% |
27 Properties |
| 2022 | £278,573 | 10% |
24 Properties |
| 2021 | £251,927 | 14% |
38 Properties |
| 2020 | £216,775 | 17% |
29 Properties |
| 2019 | £180,397 | -11% |
36 Properties |
| 2018 | £201,077 | 16% |
35 Properties |
| 2017 | £169,428 | -11% |
30 Properties |
| 2016 | £187,508 | 21% |
28 Properties |
| 2015 | £148,675 | 1% |
20 Properties |
| 2014 | £146,976 | -24% |
26 Properties |
| 2013 | £181,851 | 13% |
18 Properties |
| 2012 | £158,531 | 18% |
16 Properties |
| 2011 | £130,170 | -29% |
21 Properties |
| 2010 | £168,102 | -2% |
19 Properties |
| 2009 | £170,725 | 6% |
30 Properties |
| 2008 | £161,005 | 6% |
27 Properties |
| 2007 | £150,963 | -5% |
27 Properties |
| 2006 | £158,779 | -4% |
27 Properties |
| 2005 | £165,887 | 30% |
31 Properties |
| 2004 | £116,440 | 5% |
25 Properties |
| 2003 | £110,379 | 29% |
34 Properties |
| 2002 | £78,336 | 16% |
26 Properties |
| 2001 | £65,678 | 23% |
38 Properties |
| 2000 | £50,850 | 19% |
25 Properties |
| 1999 | £41,094 | -35% |
18 Properties |
| 1998 | £55,292 | 23% |
17 Properties |
| 1997 | £42,550 | -15% |
20 Properties |
| 1996 | £48,781 | 5% |
16 Properties |
| 1995 | £46,318 | - |
11 Properties |
Property Price per Property Type in Glantwymyn
Here you can find historic sold price data in order to help with your property search.
The average Property Paid Price for specific property types in the last three years are:
| Property Type | Average Sold Price | Sold Properties |
|---|---|---|
| Semi Detached House | £227,750.00 | 11 Semi Detached Houses |
| Detached House | £314,151.00 | 28 Detached Houses |
| Terraced House | £143,340.00 | 22 Terraced Houses |