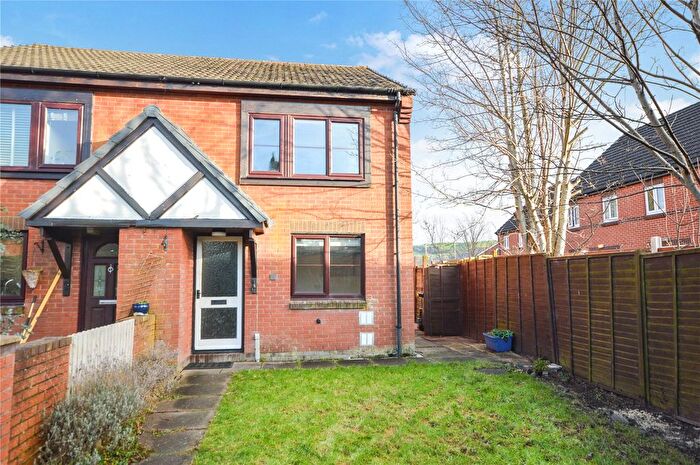
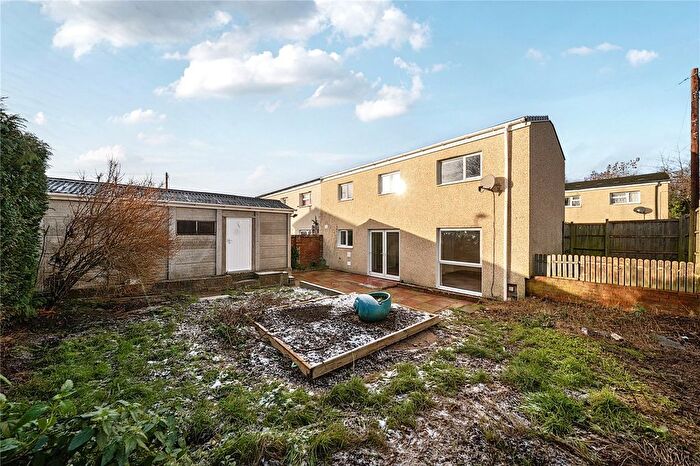
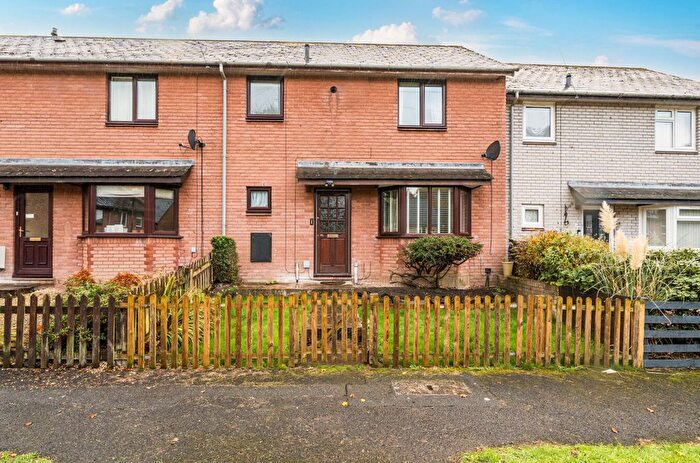
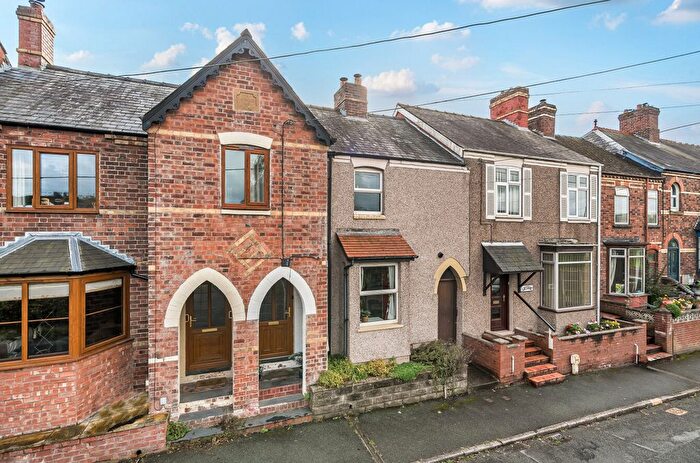
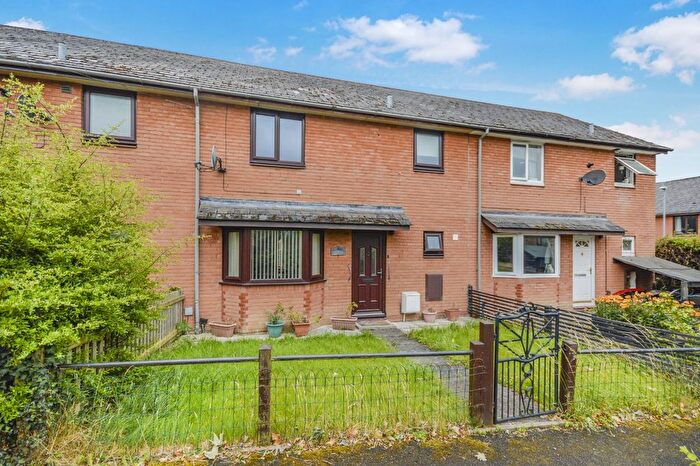
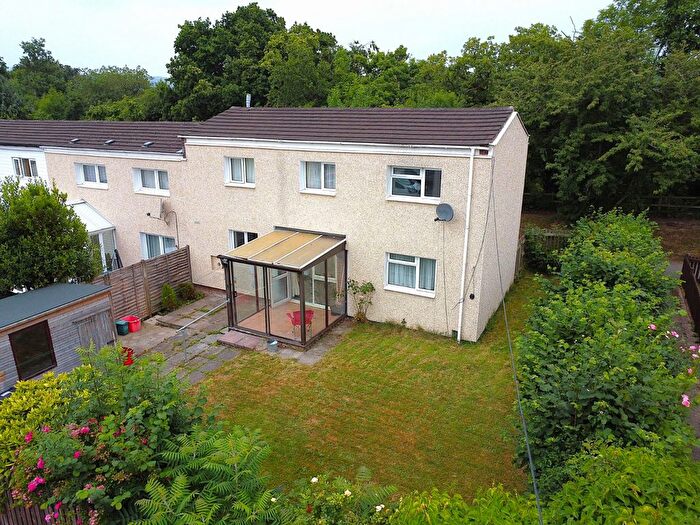
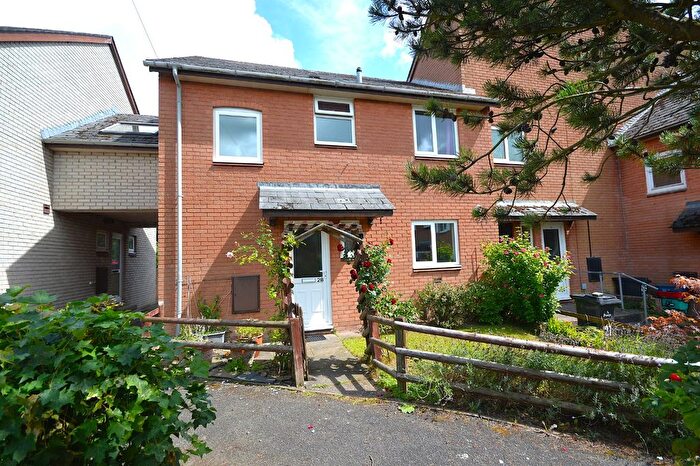
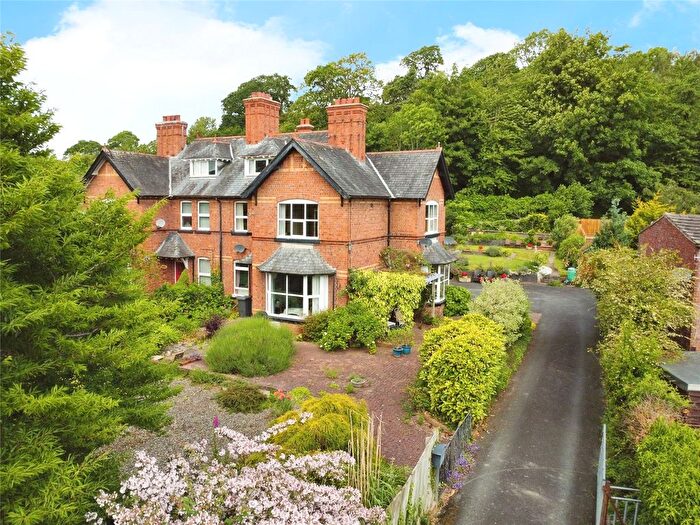
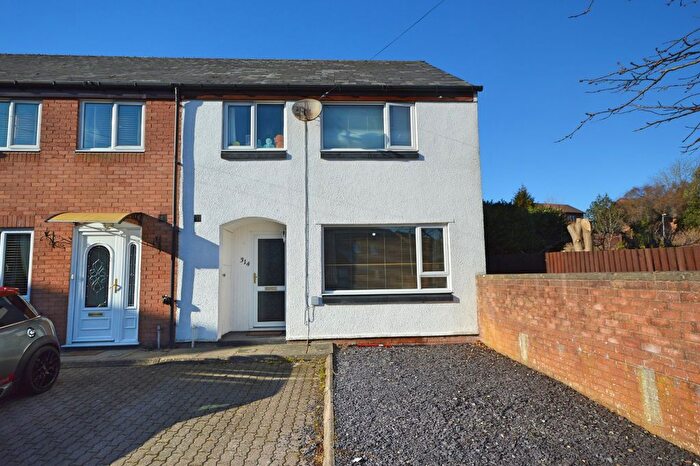
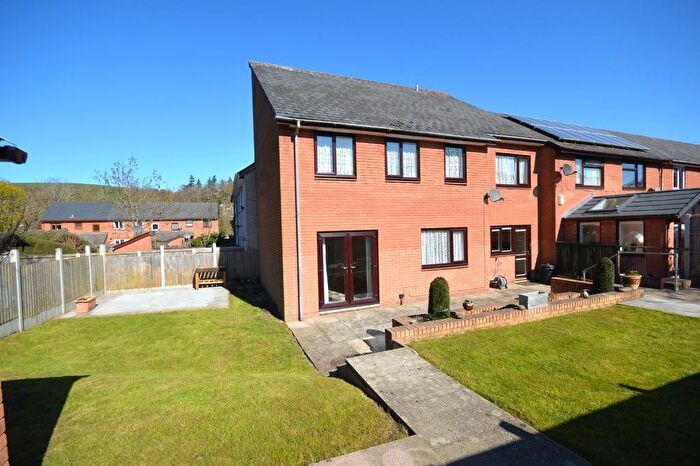
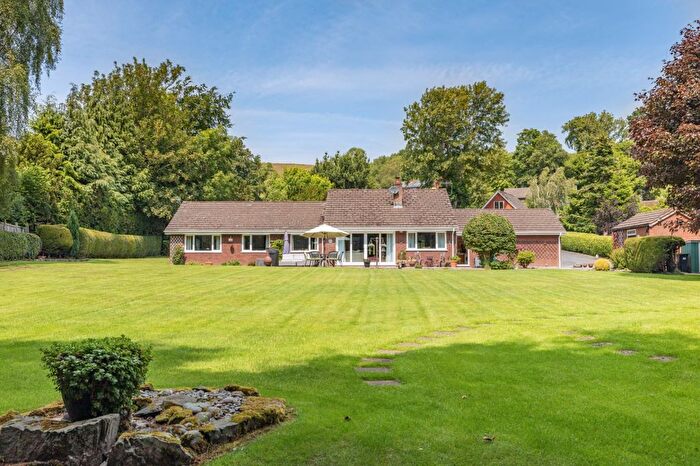
Houses for sale & to rent in Newtown Central, Newtown
House Prices in Newtown Central
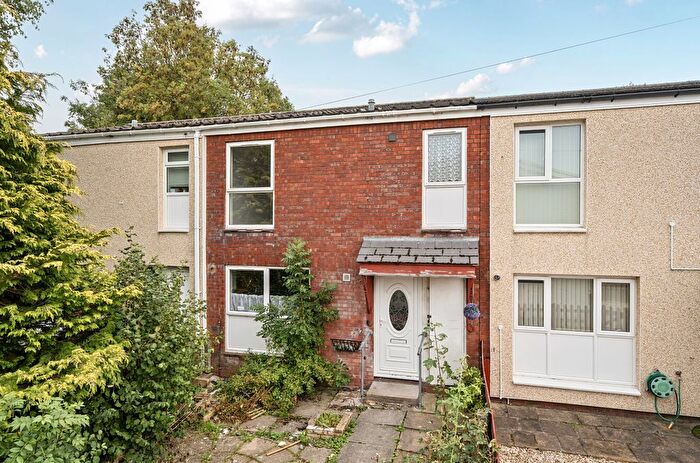
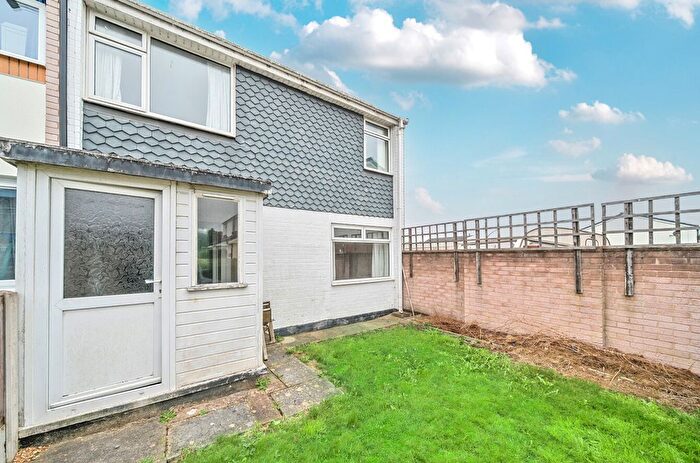
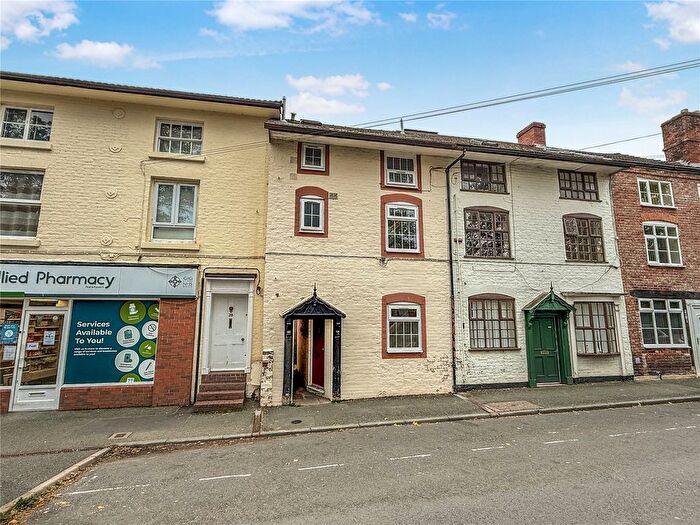
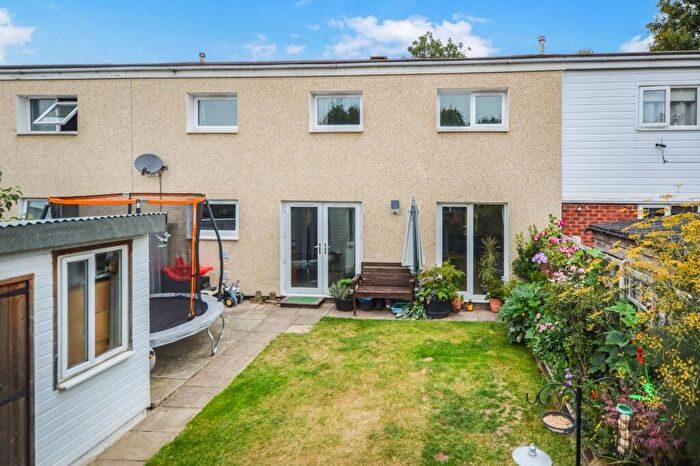
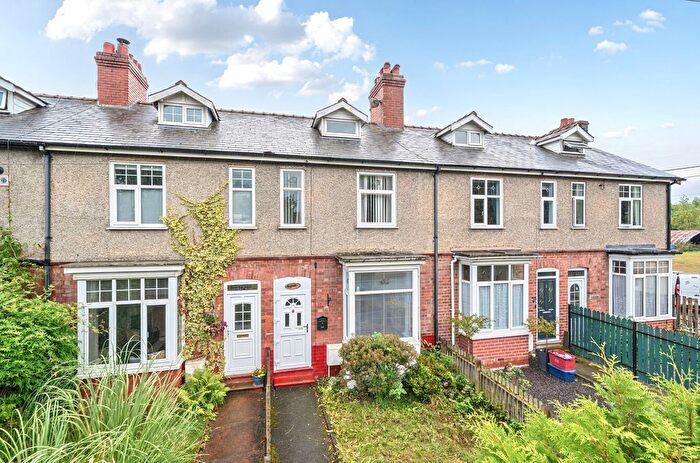
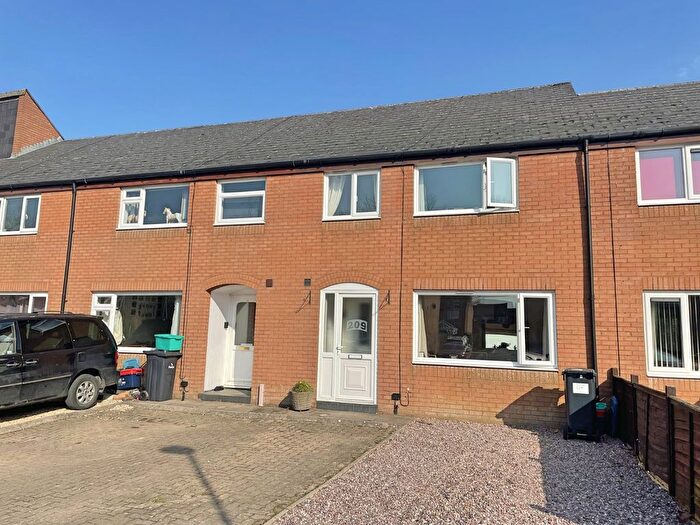
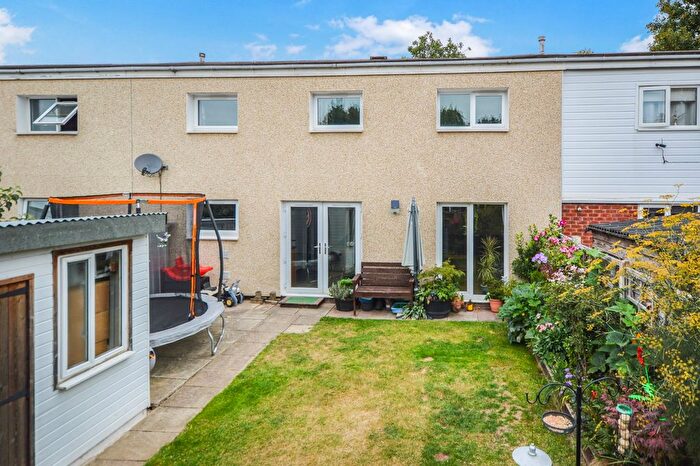
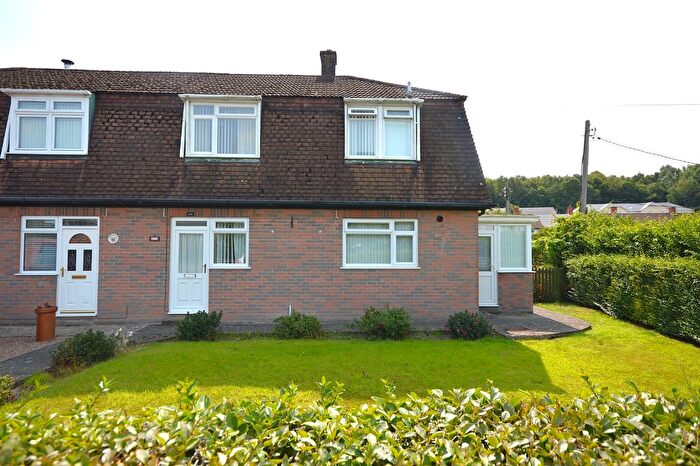
Properties in Newtown Central have an average house price of £158,403.00 and had 103 Property Transactions within the last 3 years¹.
Newtown Central is an area in Newtown, Powys - Powys with 1,338 households², where the most expensive property was sold for £435,000.00.
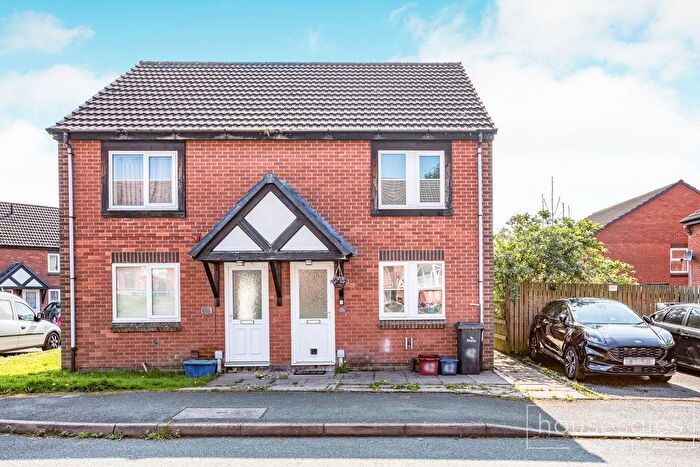
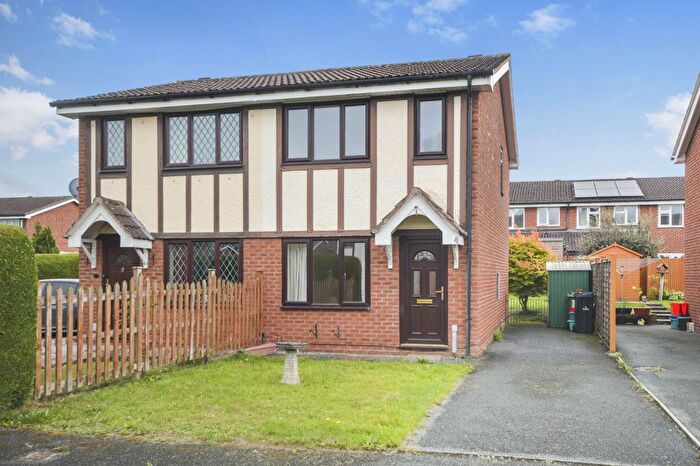
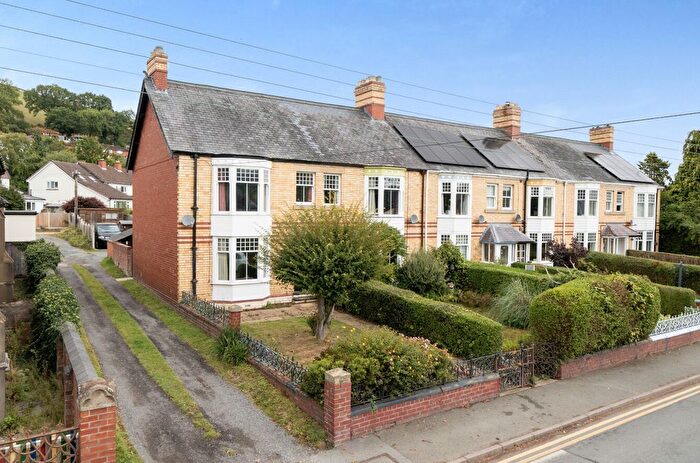
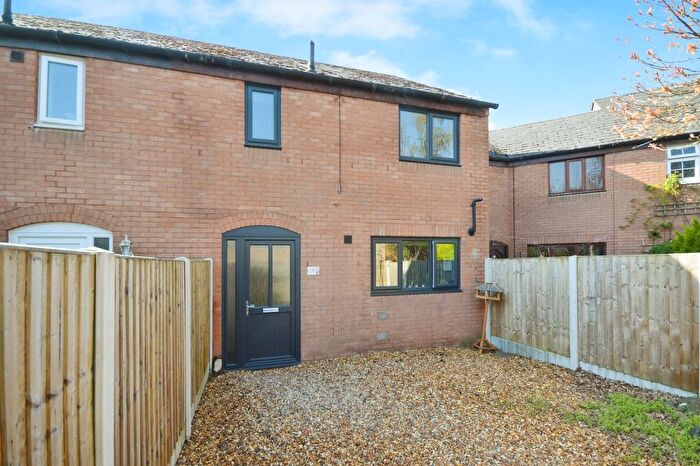
Properties for sale in Newtown Central
Previously listed properties in Newtown Central
Roads and Postcodes in Newtown Central
Navigate through our locations to find the location of your next house in Newtown Central, Newtown for sale or to rent.
| Streets | Postcodes |
|---|---|
| Clos Glandwr | SY16 1RF |
| Dolfach | SY16 1LL |
| Gerddi Glandwr | SY16 1RJ |
| Glandwr | SY16 1RE SY16 1RQ |
| Green Acres | SY16 1HZ |
| Heol Pengwern | SY16 1RG |
| Heol Vaynor | SY16 1RL |
| Heol Y Coleg | SY16 1RA |
| Heol Y Nant | SY16 1QZ |
| Hill View Close | SY16 1HE |
| Latham Drive | SY16 1ED |
| Llanidloes Road | SY16 1EP SY16 1ES SY16 1ET SY16 1EZ SY16 1HF SY16 1HG SY16 1HH SY16 1HL SY16 1EU SY16 1HA |
| Llys Bedw | SY16 1PS |
| Llys Celyn | SY16 1PT |
| Llys Dulas | SY16 1QL |
| Llys Eglwys | SY16 1LP |
| Llys Lelog | SY16 1PU |
| Lon Afallen | SY16 1PX |
| Lon Ceirios | SY16 1PR |
| Lon Derw | SY16 1QB |
| Lon Dol Y Bont | SY16 1QX |
| Lon Dolafon | SY16 1QY |
| Lon Eithin | SY16 1QD |
| Lon Glanyrafon | SY16 1QT SY16 1QU |
| Lon Gwern | SY16 1PZ SY16 1QA |
| Lon Helyg | SY16 1HY |
| Lon Masarn | SY16 1QG |
| Lon Pinwydd | SY16 1QF |
| Lon Rhosod | SY16 1QE |
| Mayfield Terrace | SY16 1HQ |
| Minafon | SY16 1RH |
| Oakfield Terrace | SY16 1HJ |
| Park Close | SY16 1EL |
| Park Lane | SY16 1DE SY16 1EN |
| Park Street | SY16 1EW |
| Park Terrace | SY16 1ER |
| Parklands | SY16 1LW |
| Pavilion Court | SY16 1EA SY16 1EB |
| Pines Gardens | SY16 1EY |
| Wynfields | SY16 1HB SY16 1HD |
| SY16 1AH SY16 1LS SY16 1PW SY16 1PY SY16 1QN SY16 1RR |
Transport near Newtown Central
-
Newtown Station
-
Caersws Station
-
Llanbister Road Station
-
Welshpool Station
-
Llangynllo Station
-
Knucklas Station
- FAQ
- Price Paid By Year
- Property Type Price
Frequently asked questions about Newtown Central
What is the average price for a property for sale in Newtown Central?
The average price for a property for sale in Newtown Central is £158,403. This amount is 27% lower than the average price in Newtown. There are 132 property listings for sale in Newtown Central.
What streets have the most expensive properties for sale in Newtown Central?
The streets with the most expensive properties for sale in Newtown Central are Green Acres at an average of £263,333, Llanidloes Road at an average of £243,571 and Parklands at an average of £237,500.
What streets have the most affordable properties for sale in Newtown Central?
The streets with the most affordable properties for sale in Newtown Central are Llys Bedw at an average of £107,500, Lon Rhosod at an average of £111,000 and Lon Ceirios at an average of £115,000.
Which train stations are available in or near Newtown Central?
Some of the train stations available in or near Newtown Central are Newtown, Caersws and Llanbister Road.
Property Price Paid in Newtown Central by Year
The average sold property price by year was:
| Year | Average Sold Price | Price Change |
Sold Properties
|
|---|---|---|---|
| 2025 | £189,454 | 22% |
22 Properties |
| 2024 | £147,966 | -4% |
33 Properties |
| 2023 | £154,211 | 4% |
27 Properties |
| 2022 | £147,666 | 4% |
21 Properties |
| 2021 | £141,814 | 21% |
43 Properties |
| 2020 | £112,592 | -2% |
21 Properties |
| 2019 | £114,644 | 1% |
36 Properties |
| 2018 | £113,094 | 14% |
36 Properties |
| 2017 | £97,512 | -11% |
37 Properties |
| 2016 | £107,897 | -9% |
39 Properties |
| 2015 | £117,828 | 8% |
37 Properties |
| 2014 | £108,794 | -7% |
39 Properties |
| 2013 | £116,250 | 12% |
26 Properties |
| 2012 | £101,799 | 7% |
20 Properties |
| 2011 | £94,295 | -9% |
22 Properties |
| 2010 | £102,939 | 2% |
19 Properties |
| 2009 | £100,936 | 6% |
27 Properties |
| 2008 | £94,546 | -12% |
27 Properties |
| 2007 | £106,363 | -7% |
46 Properties |
| 2006 | £113,817 | 13% |
55 Properties |
| 2005 | £98,804 | 19% |
33 Properties |
| 2004 | £80,440 | 12% |
42 Properties |
| 2003 | £70,925 | 21% |
62 Properties |
| 2002 | £55,834 | 17% |
41 Properties |
| 2001 | £46,133 | 13% |
48 Properties |
| 2000 | £40,067 | -11% |
38 Properties |
| 1999 | £44,647 | 1% |
35 Properties |
| 1998 | £44,006 | 9% |
28 Properties |
| 1997 | £40,179 | -10% |
49 Properties |
| 1996 | £44,106 | 1% |
37 Properties |
| 1995 | £43,562 | - |
35 Properties |
Property Price per Property Type in Newtown Central
Here you can find historic sold price data in order to help with your property search.
The average Property Paid Price for specific property types in the last three years are:
| Property Type | Average Sold Price | Sold Properties |
|---|---|---|
| Semi Detached House | £151,421.00 | 32 Semi Detached Houses |
| Detached House | £215,444.00 | 18 Detached Houses |
| Terraced House | £144,825.00 | 51 Terraced Houses |
| Flat | £103,000.00 | 2 Flats |

