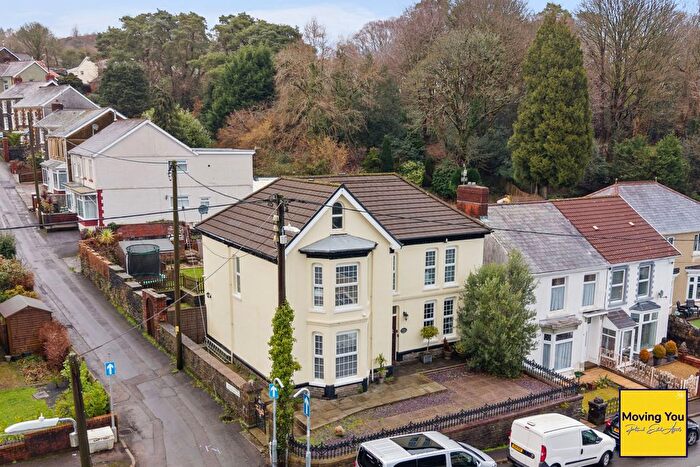
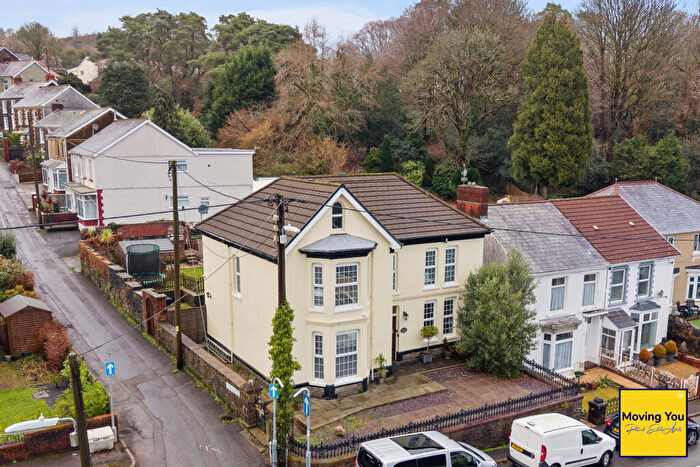
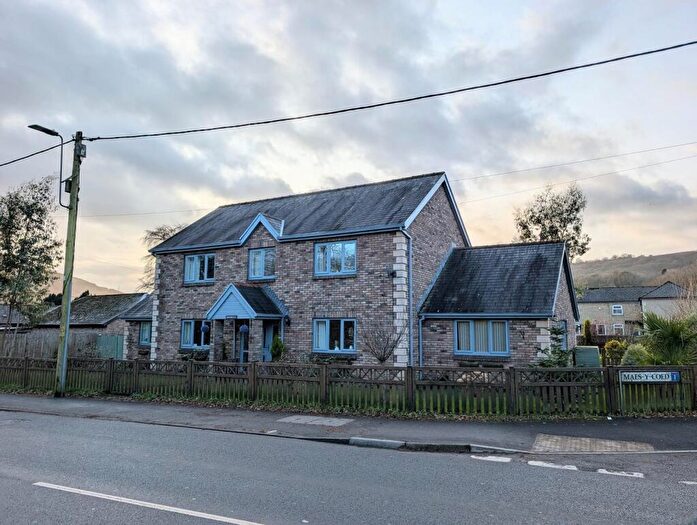
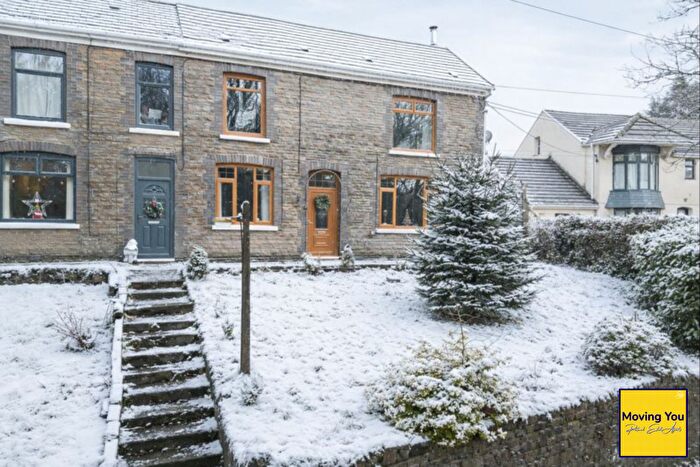
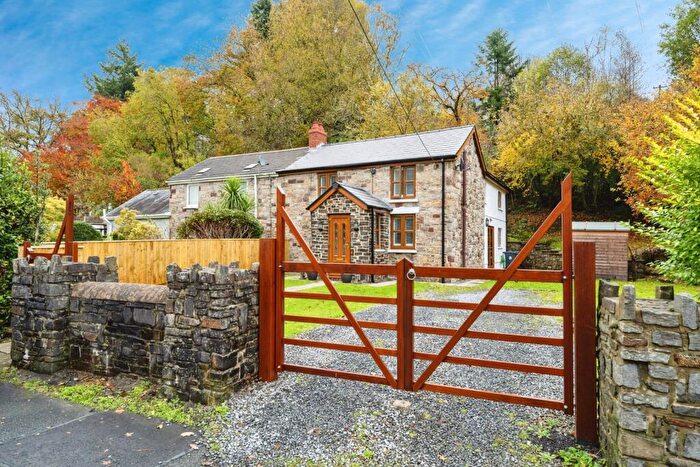
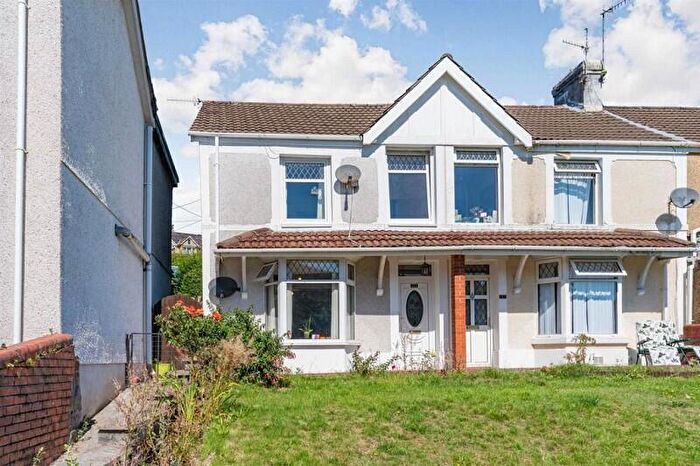
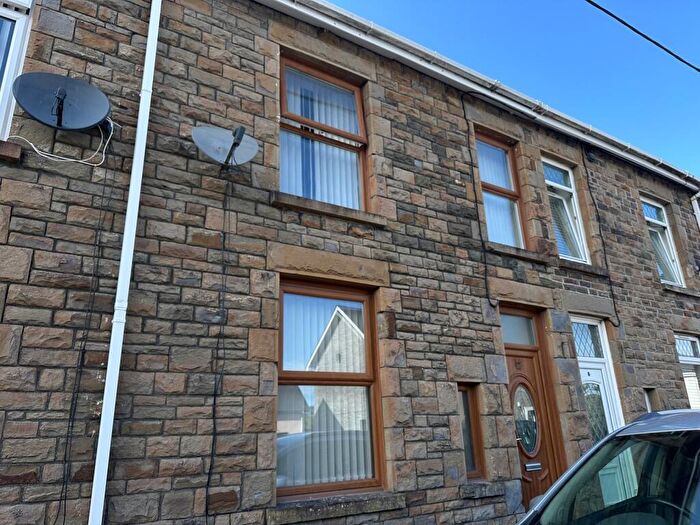
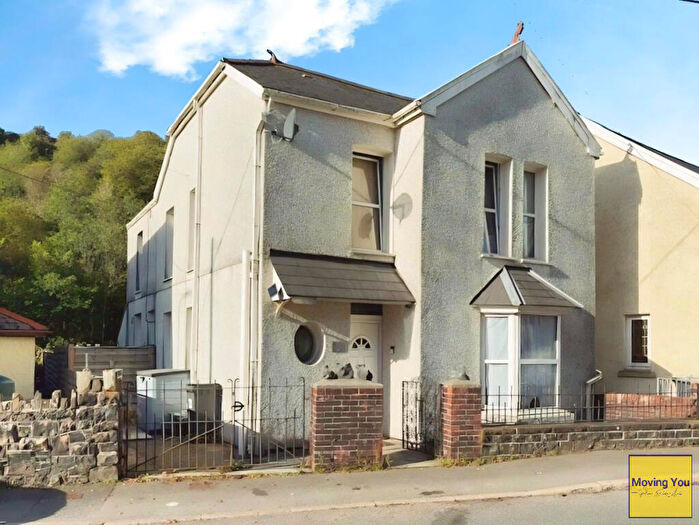
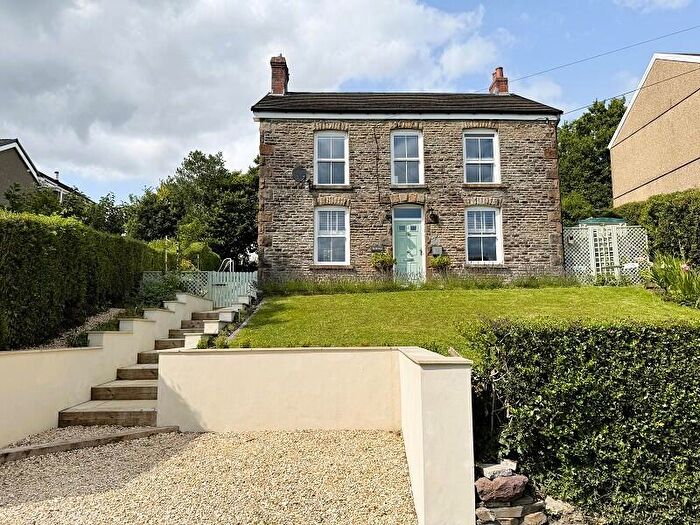
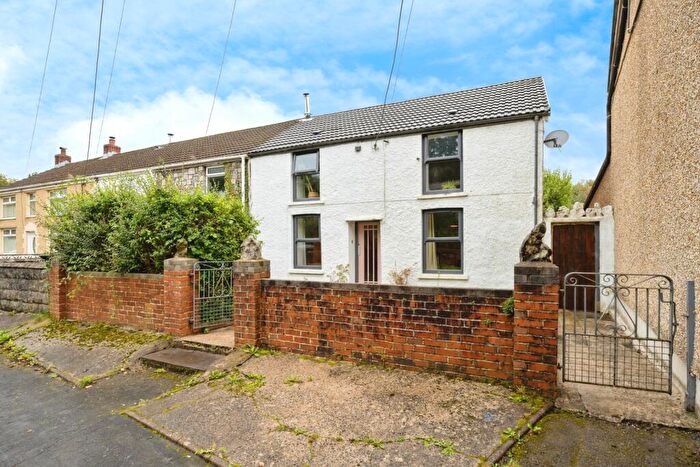
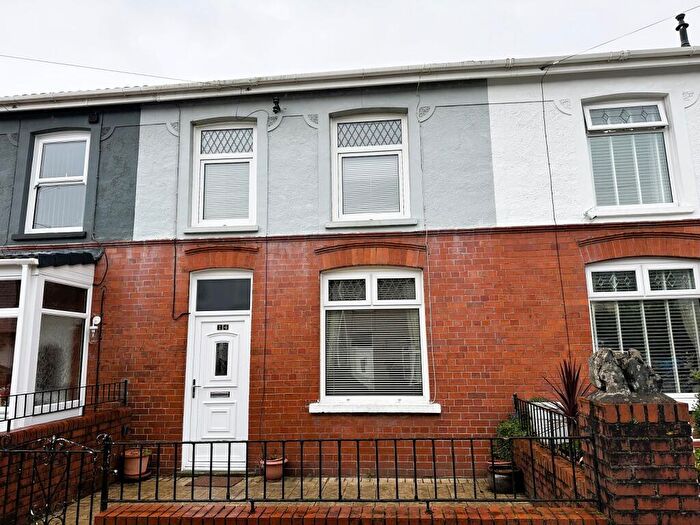
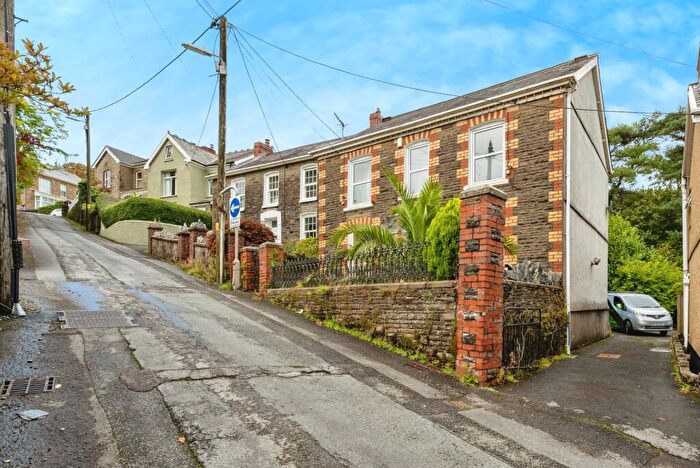
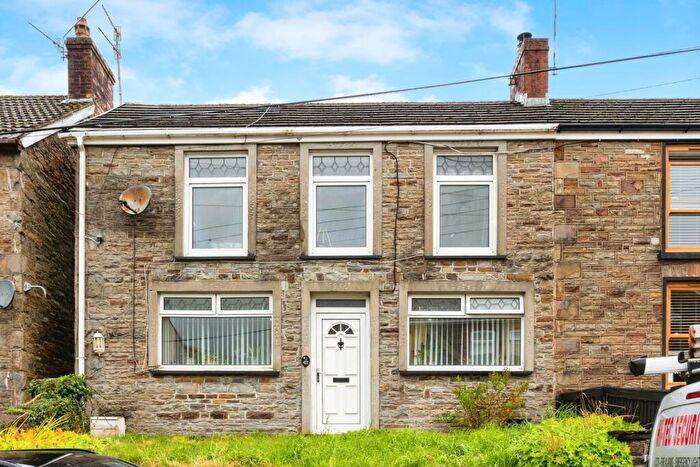
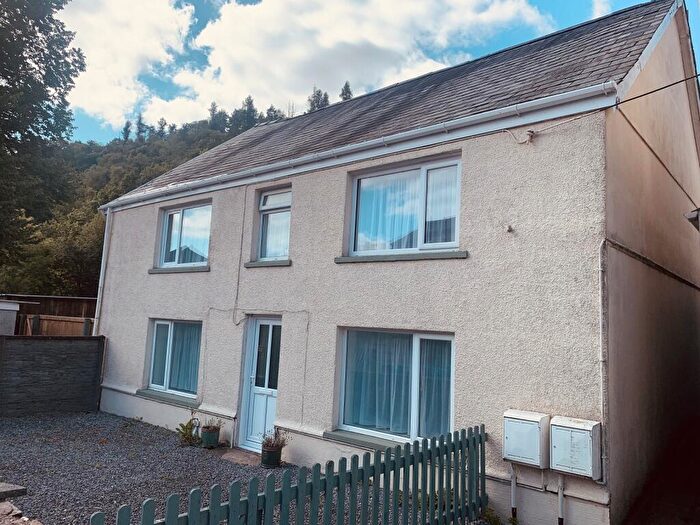
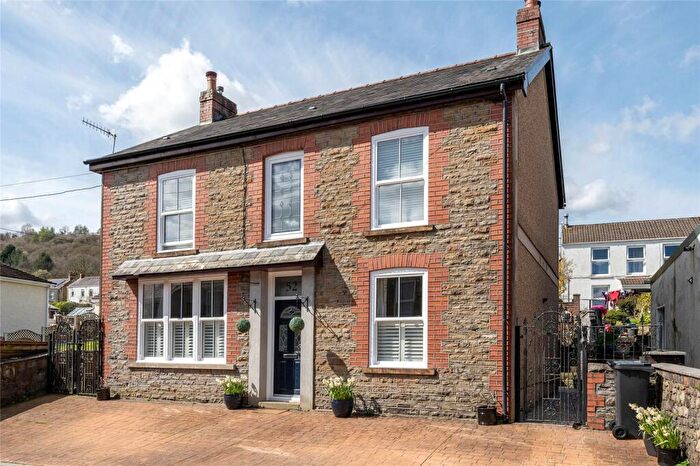
Houses for sale & to rent in Cwm-twrch, Swansea
House Prices in Cwm-twrch
Properties in Cwm-twrch have an average house price of £187,624.00 and had 107 Property Transactions within the last 3 years¹.
Cwm-twrch is an area in Swansea, Powys - Powys with 866 households², where the most expensive property was sold for £720,000.00.
Properties for sale in Cwm-twrch
Roads and Postcodes in Cwm-twrch
Navigate through our locations to find the location of your next house in Cwm-twrch, Swansea for sale or to rent.
| Streets | Postcodes |
|---|---|
| Bethel Road | SA9 2PS SA9 2PT SA9 2PU SA9 2HW |
| Bridge Street | SA9 2SY |
| Bryn Gorof | SA9 1DN |
| Cambrian Place | SA9 2US |
| Coedlan | SA9 1ED |
| Cwmphil Road | SA9 1DE SA9 1DQ SA9 2PX SA9 2PY SA9 2QA SA9 2QB SA9 2QD |
| Cwmphill Road | SA9 1DF |
| Cwrt Y Gamlas | SA9 1EP |
| Cwrt Y Gloch | SA9 1FF |
| Cynwal Terrace | SA9 2UP |
| Gilfach Road | SA9 2UU |
| Glyncynwal Road | SA9 2UL SA9 2UN SA9 2UR |
| Golden Lion Terrace | SA9 2SX |
| Gorof Road | SA9 1DS SA9 1DX SA9 1EH SA9 1DU SA9 1DZ |
| Gurnos Villas | SA9 1DD |
| Gwysfryn | SA9 2XF |
| Gyrnosfa | SA9 1DR |
| Hafan Close | SA9 1EJ |
| Heol Aaron | SA9 1EA |
| Heol Abram | SA9 1EB |
| Heol Gleien | SA9 2TT SA9 2TW SA9 2TZ SA9 2UF SA9 2TU |
| Heol Gron | SA9 1DL |
| Heol Gwys | SA9 2XG SA9 2XQ |
| Heol Maes Pica | SA9 2PP |
| Heol Mai | SA9 1FN |
| Heol Meurig | SA9 1DJ |
| Heol Philip | SA9 1DP |
| Heol Tredeg | SA9 2XD SA9 2XE |
| Heol Twrch | SA9 2TD SA9 2TE |
| Lynden | SA9 1DW |
| Maes Y Gorof | SA9 1DA |
| Midland Terrace | SA9 1BZ |
| New Houses | SA9 1EG |
| Palleg Place | SA9 1DG |
| Palleg Road | SA9 2QE SA9 2QF |
| Police Houses | SA9 1DY |
| School Road | SA9 1EQ |
| Spencer Terrace | SA9 1EE SA9 1EF SA9 1EZ SA9 1FL |
| Swn Y Nant | SA9 2PN |
| Tai Gwalia | SA9 2UW |
| Wharf Cottages | SA9 1BY |
| Ynys Tre Deg | SA9 2XN SA9 2XP |
| SA9 1BX SA9 1DB SA9 2QQ SA9 2LA SA9 2QJ SA9 2QL SA9 2SU SA9 2UT SA9 1FP SA9 2XW |
Transport near Cwm-twrch
-
Neath Station
-
Skewen Station
-
Llansamlet Station
-
Pantyffynnon Station
-
Ammanford Station
-
Briton Ferry Station
-
Llandybie Station
- FAQ
- Price Paid By Year
- Property Type Price
Frequently asked questions about Cwm-twrch
What is the average price for a property for sale in Cwm-twrch?
The average price for a property for sale in Cwm-twrch is £187,624. This amount is 0.22% lower than the average price in Swansea. There are 994 property listings for sale in Cwm-twrch.
What streets have the most expensive properties for sale in Cwm-twrch?
The streets with the most expensive properties for sale in Cwm-twrch are Cwrt Y Gamlas at an average of £440,000, Heol Maes Pica at an average of £298,000 and Gorof Road at an average of £254,675.
What streets have the most affordable properties for sale in Cwm-twrch?
The streets with the most affordable properties for sale in Cwm-twrch are Heol Twrch at an average of £104,676, Tai Gwalia at an average of £118,333 and Spencer Terrace at an average of £132,500.
Which train stations are available in or near Cwm-twrch?
Some of the train stations available in or near Cwm-twrch are Neath, Skewen and Llansamlet.
Property Price Paid in Cwm-twrch by Year
The average sold property price by year was:
| Year | Average Sold Price | Price Change |
Sold Properties
|
|---|---|---|---|
| 2025 | £140,662 | -28% |
12 Properties |
| 2024 | £180,429 | -19% |
34 Properties |
| 2023 | £215,339 | 12% |
28 Properties |
| 2022 | £188,598 | 28% |
33 Properties |
| 2021 | £134,881 | -0,2% |
38 Properties |
| 2020 | £135,170 | -4% |
20 Properties |
| 2019 | £140,092 | 15% |
27 Properties |
| 2018 | £119,071 | -18% |
14 Properties |
| 2017 | £140,375 | 25% |
22 Properties |
| 2016 | £105,741 | 4% |
42 Properties |
| 2015 | £101,813 | -3% |
19 Properties |
| 2014 | £104,972 | 10% |
18 Properties |
| 2013 | £94,997 | 11% |
25 Properties |
| 2012 | £85,000 | -25% |
10 Properties |
| 2011 | £106,016 | -13% |
12 Properties |
| 2010 | £119,690 | 3% |
21 Properties |
| 2009 | £116,056 | -6% |
15 Properties |
| 2008 | £122,644 | 11% |
17 Properties |
| 2007 | £108,677 | -27% |
33 Properties |
| 2006 | £138,012 | 28% |
23 Properties |
| 2005 | £99,255 | 4% |
27 Properties |
| 2004 | £95,263 | 36% |
32 Properties |
| 2003 | £61,027 | 28% |
19 Properties |
| 2002 | £44,105 | -6% |
30 Properties |
| 2001 | £46,582 | 20% |
26 Properties |
| 2000 | £37,475 | -34% |
26 Properties |
| 1999 | £50,223 | 25% |
13 Properties |
| 1998 | £37,550 | 20% |
28 Properties |
| 1997 | £30,136 | -53% |
23 Properties |
| 1996 | £46,170 | 22% |
20 Properties |
| 1995 | £35,915 | - |
13 Properties |
Property Price per Property Type in Cwm-twrch
Here you can find historic sold price data in order to help with your property search.
The average Property Paid Price for specific property types in the last three years are:
| Property Type | Average Sold Price | Sold Properties |
|---|---|---|
| Semi Detached House | £139,112.00 | 35 Semi Detached Houses |
| Detached House | £279,919.00 | 39 Detached Houses |
| Terraced House | £131,874.00 | 32 Terraced Houses |
| Flat | £70,000.00 | 1 Flat |

