
Houses for sale & to rent in Rhiwcynon, Welshpool
House Prices in Rhiwcynon
Properties in Rhiwcynon have an average house price of £318k and had 9 Property Transactions within the last 3 years¹.
Rhiwcynon is an area in Welshpool, Powys - Powys with 169 households², where the most expensive property was sold for £393k.
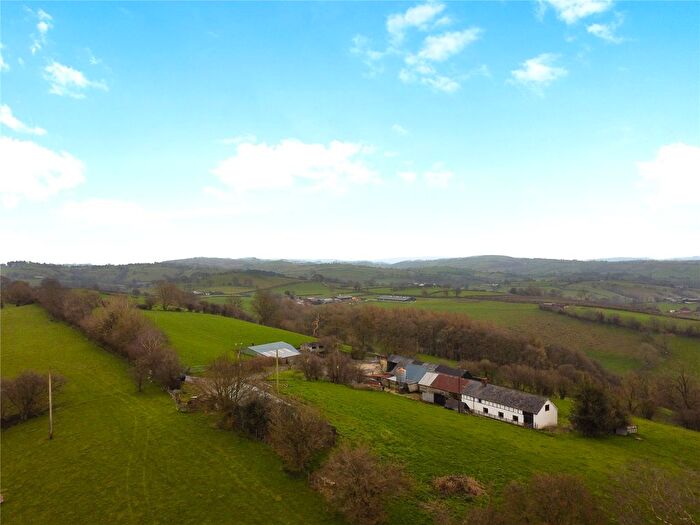
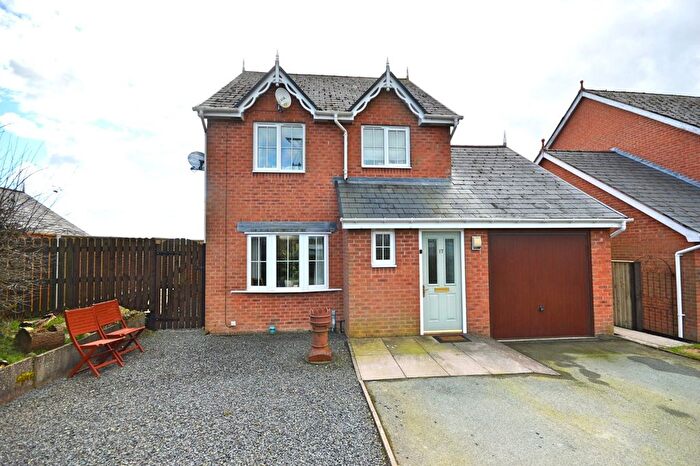
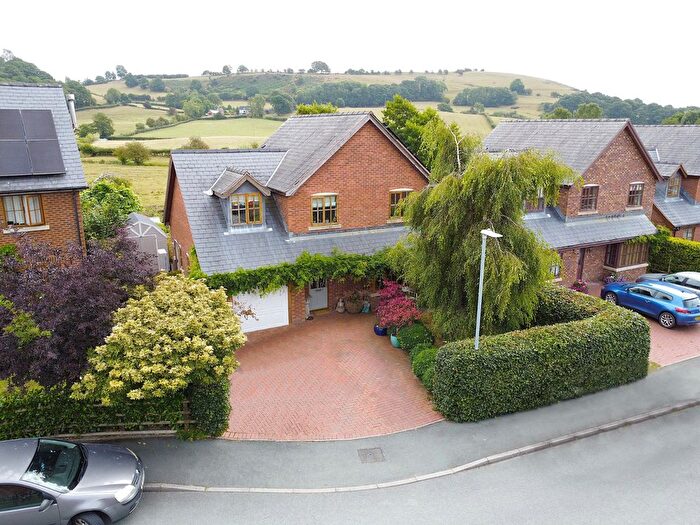
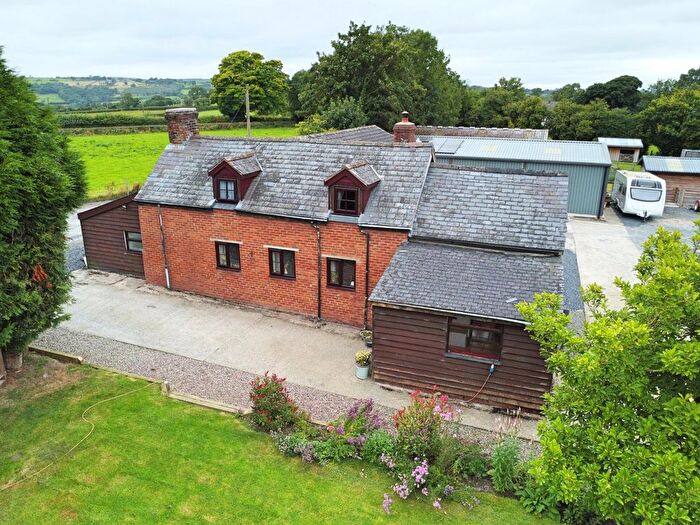
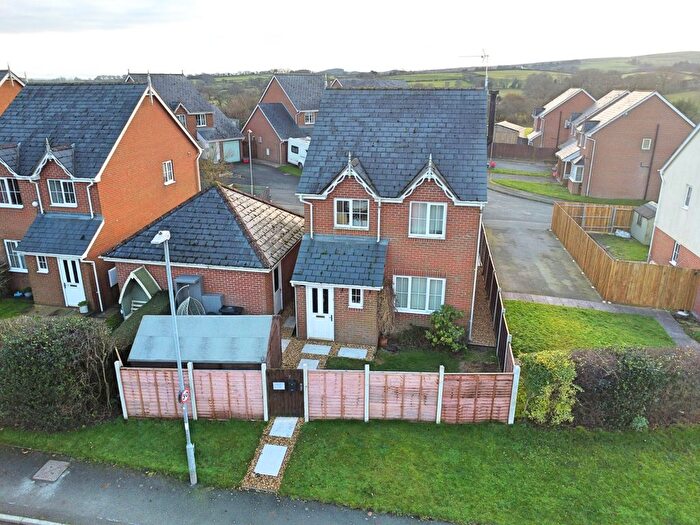
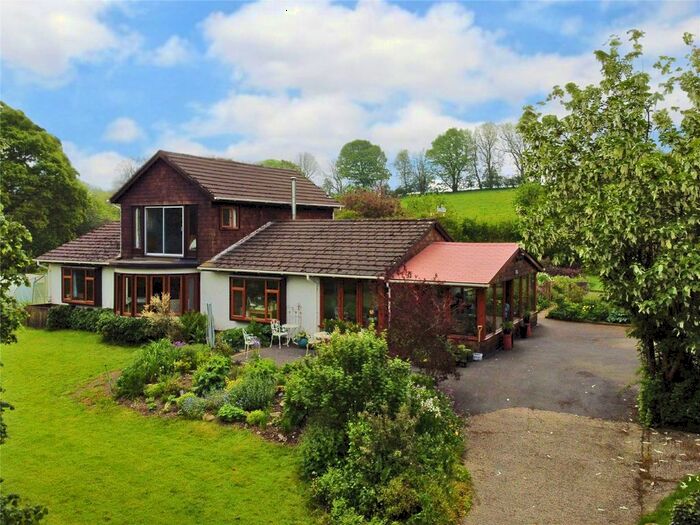
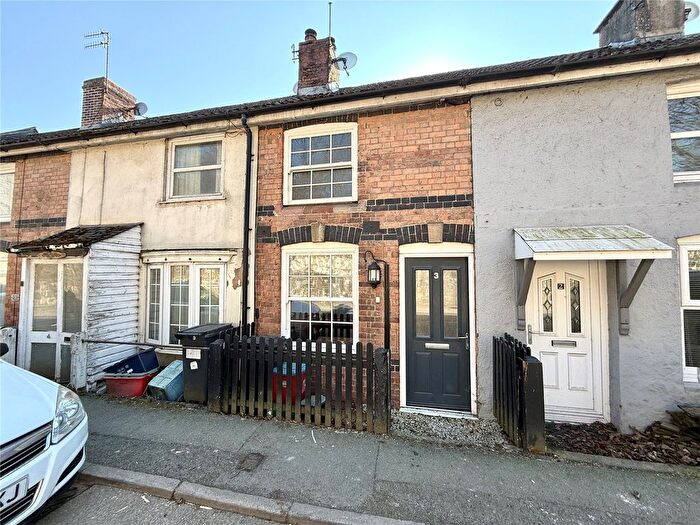
Properties for sale in Rhiwcynon
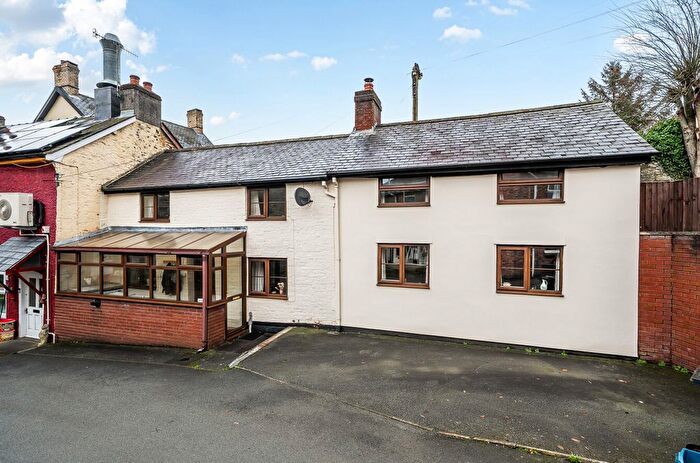
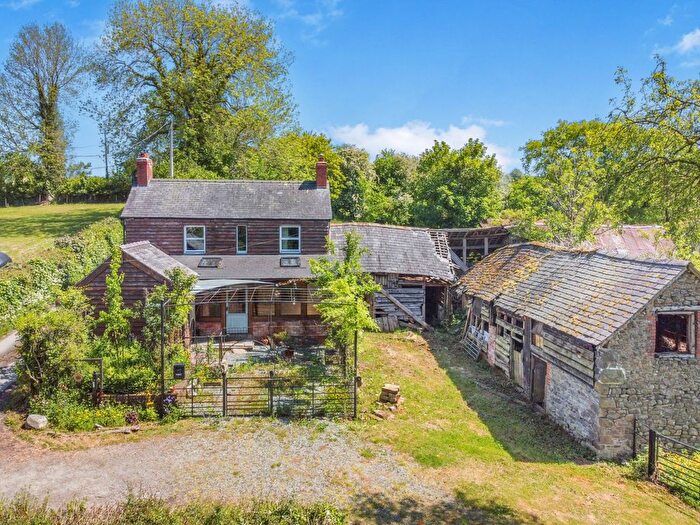
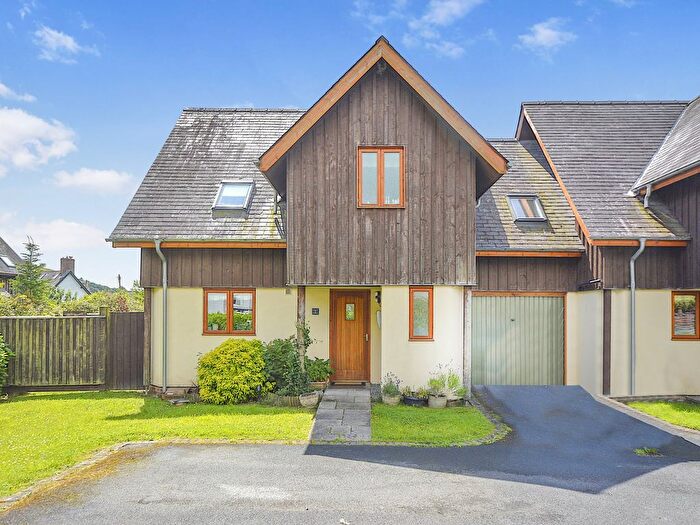
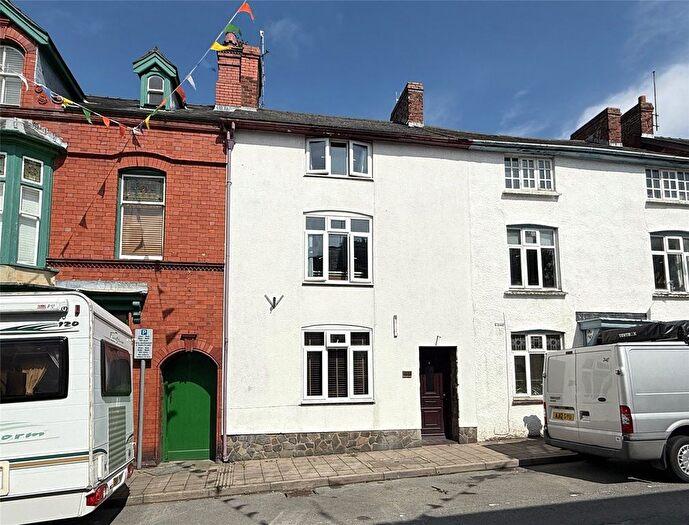
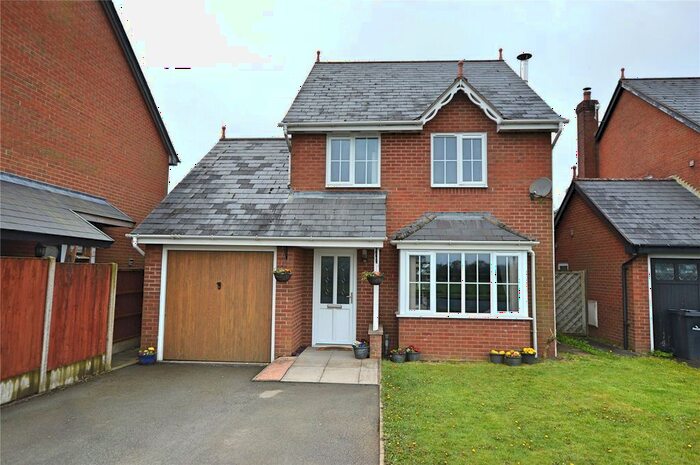
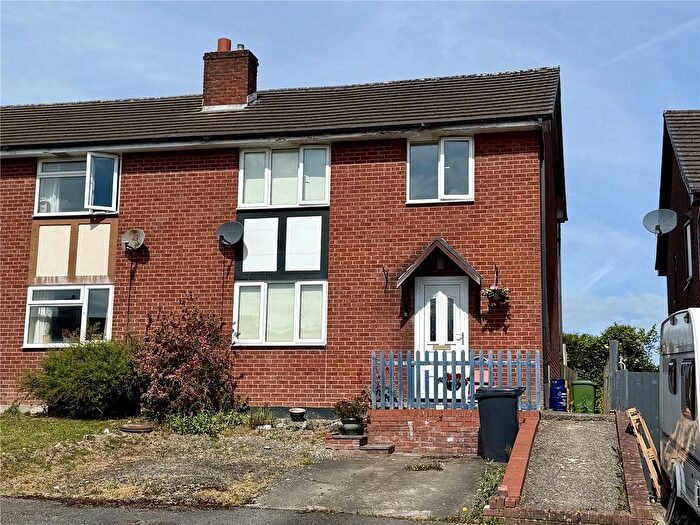
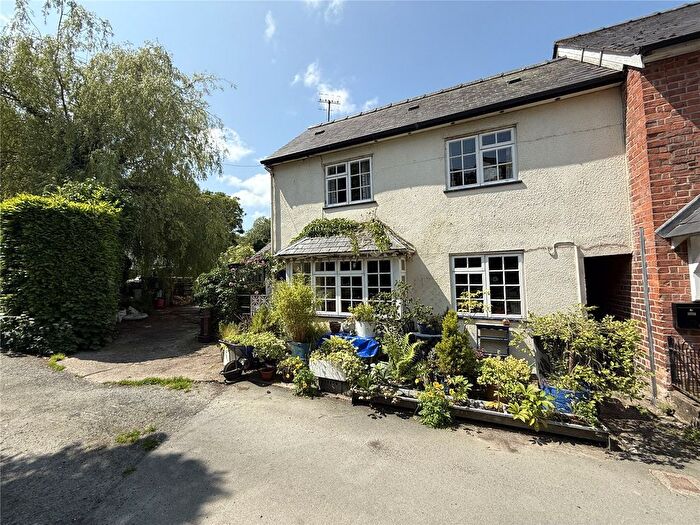
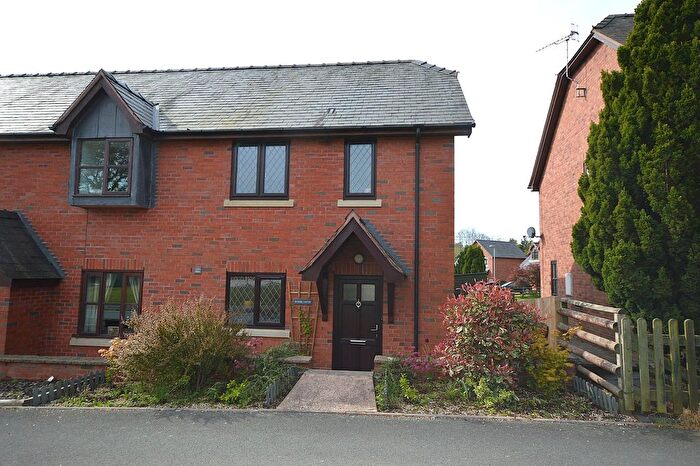
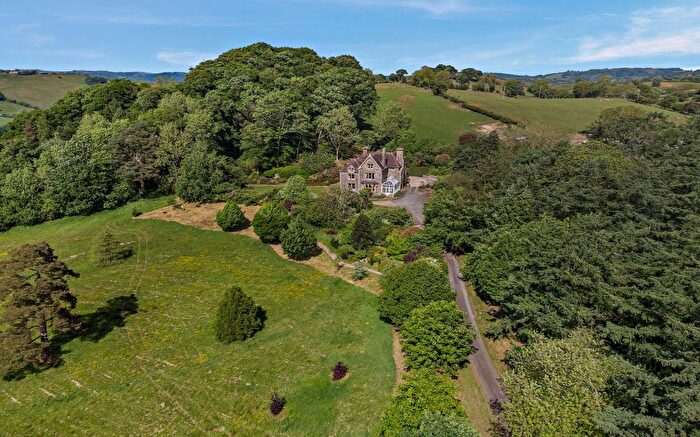
Previously listed properties in Rhiwcynon
![]()
If you are looking to sell your house, let it out, or receive a property valuation, an expert can help you.
Click the button below to get started.


Roads and Postcodes in Rhiwcynon
Navigate through our locations to find the location of your next house in Rhiwcynon, Welshpool for sale or to rent.
| Streets | Postcodes |
|---|---|
| Brynllugan | SY21 0AR |
| Church Cottages | SY21 8BN |
| Trem Hirnant | SY21 8BX |
| SY21 0AB SY21 0AE SY21 0AG SY21 0AH SY21 0AN SY21 0AW SY21 0AY SY21 8BJ SY21 8BL SY21 8BP SY21 8BW SY21 8QU SY21 9AY SY21 0AF SY21 0AJ SY21 0AL SY21 0AP SY21 0AQ SY21 0AX SY21 0AZ SY21 0EW SY21 8BS |
Transport near Rhiwcynon

- FAQ
- Price Paid By Year
- Property Type Price
Frequently asked questions about Rhiwcynon
What is the average price for a property for sale in Rhiwcynon?
The average price for a property for sale in Rhiwcynon is £317,555. This amount is 23% higher than the average price in Welshpool. There are 105 property listings for sale in Rhiwcynon.
Which train stations are available in or near Rhiwcynon?
Some of the train stations available in or near Rhiwcynon are Caersws, Newtown and Welshpool.
Property Price Paid in Rhiwcynon by Year
The average sold property price by year was:
| Year | Average Sold Price | Price Change |
Sold Properties
|
|---|---|---|---|
| 2025 | £325,000 | 2% |
2 Properties |
| 2024 | £318,000 | 6% |
6 Properties |
| 2023 | £300,000 | -28% |
1 Property |
| 2022 | £385,000 | 15% |
4 Properties |
| 2021 | £326,778 | 12% |
7 Properties |
| 2020 | £286,000 | 27% |
3 Properties |
| 2019 | £209,250 | -7% |
4 Properties |
| 2018 | £223,500 | -8% |
5 Properties |
| 2017 | £240,857 | 11% |
7 Properties |
| 2016 | £214,000 | 11% |
4 Properties |
| 2015 | £189,666 | -16% |
3 Properties |
| 2014 | £219,510 | 21% |
9 Properties |
| 2013 | £172,500 | 4% |
2 Properties |
| 2012 | £165,000 | -46% |
2 Properties |
| 2011 | £241,333 | 54% |
3 Properties |
| 2010 | £110,000 | -118% |
1 Property |
| 2009 | £239,983 | -2% |
3 Properties |
| 2008 | £244,500 | -41% |
4 Properties |
| 2007 | £345,000 | 29% |
2 Properties |
| 2006 | £245,000 | -15% |
2 Properties |
| 2005 | £281,487 | 37% |
4 Properties |
| 2004 | £178,000 | 13% |
5 Properties |
| 2003 | £154,590 | 14% |
5 Properties |
| 2002 | £133,000 | 14% |
3 Properties |
| 2001 | £114,000 | -4% |
2 Properties |
| 2000 | £118,916 | 34% |
6 Properties |
| 1999 | £79,000 | 24% |
3 Properties |
| 1998 | £60,000 | 29% |
2 Properties |
| 1997 | £42,500 | -84% |
4 Properties |
| 1996 | £78,000 | -17% |
1 Property |
| 1995 | £91,500 | - |
1 Property |
Property Price per Property Type in Rhiwcynon
Here you can find historic sold price data in order to help with your property search.
The average Property Paid Price for specific property types in the last three years are:
| Property Type | Average Sold Price | Sold Properties |
|---|---|---|
| Semi Detached House | £245,000.00 | 1 Semi Detached House |
| Detached House | £326,625.00 | 8 Detached Houses |