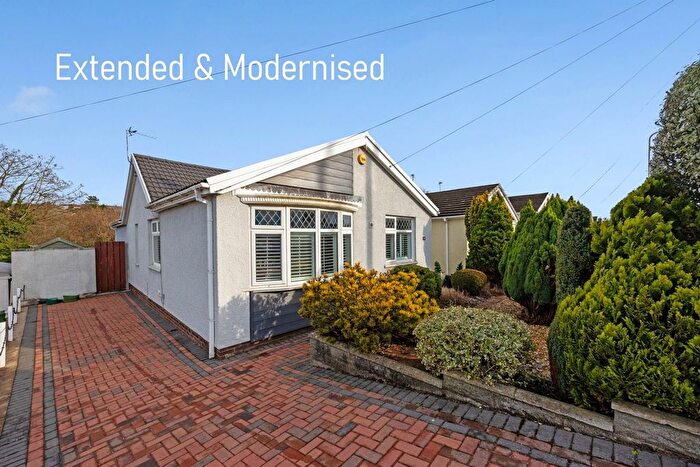
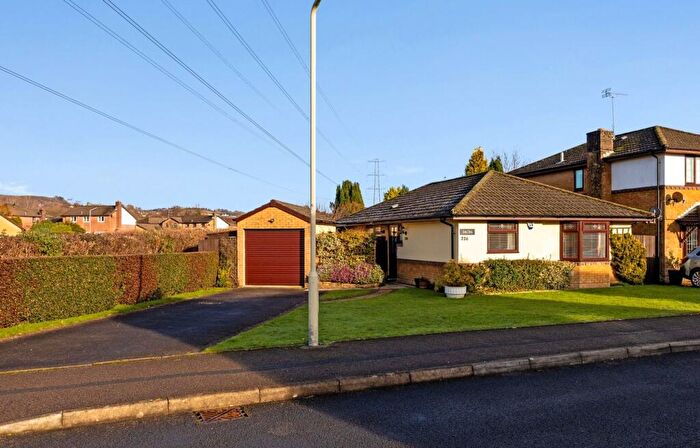
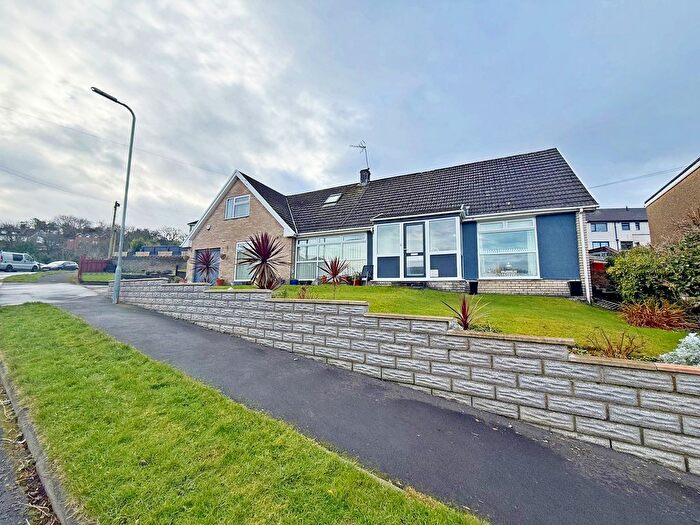
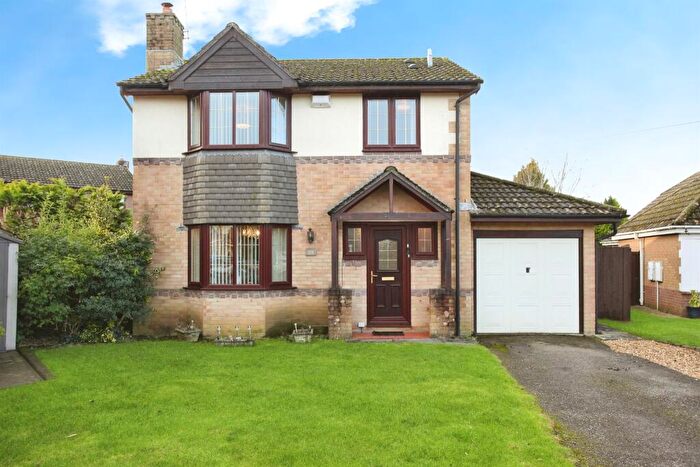
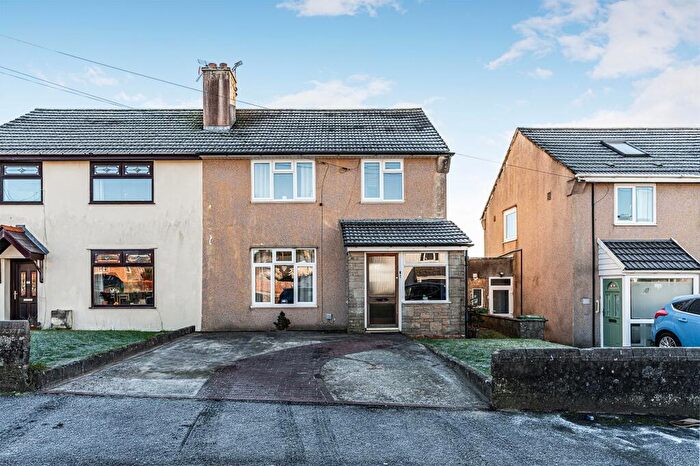
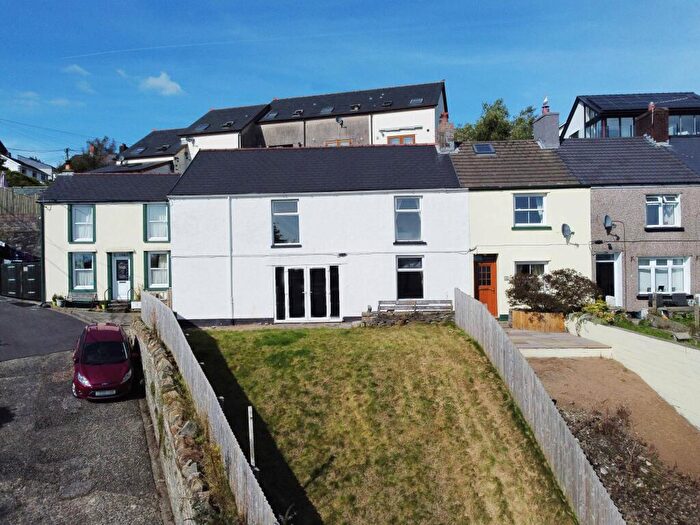
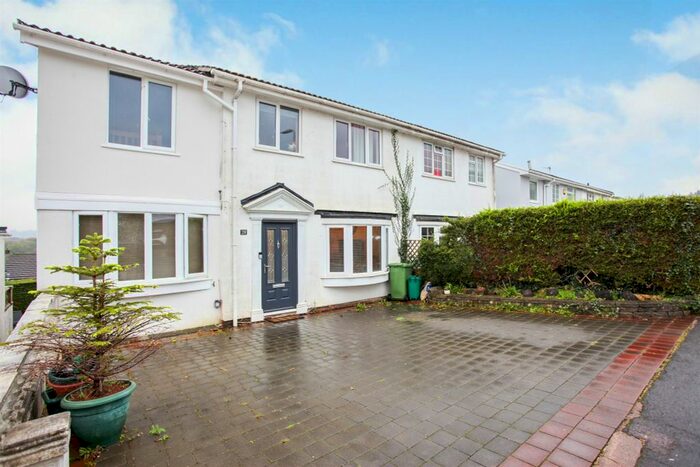
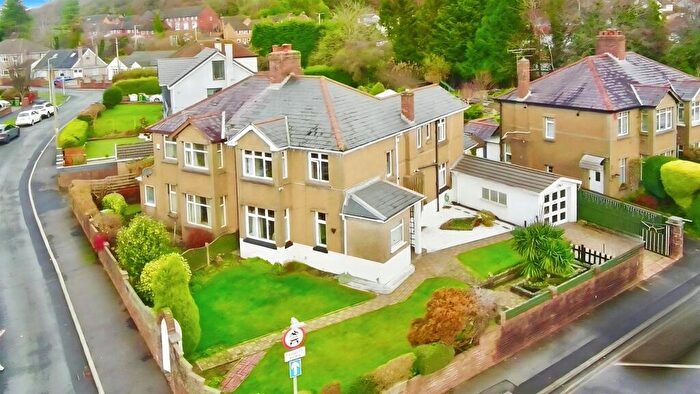
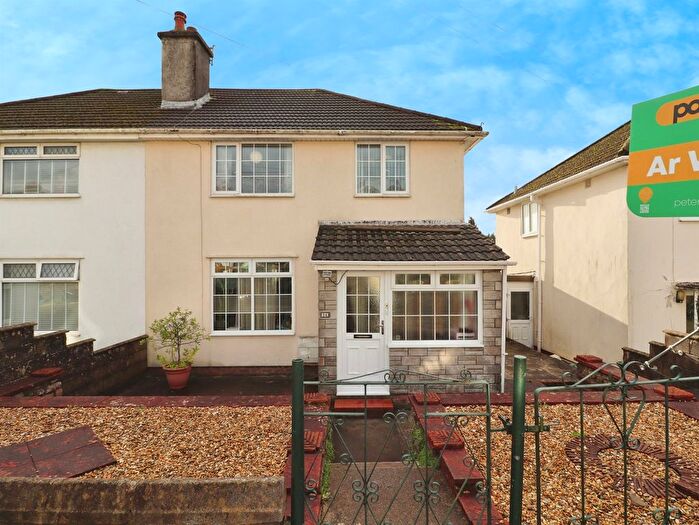
Houses for sale & to rent in Talbot Green, Pontyclun
House Prices in Talbot Green
Properties in Talbot Green have an average house price of £241,747.00 and had 120 Property Transactions within the last 3 years¹.
Talbot Green is an area in Pontyclun, Rhondda Cynon Taf - Rhondda Cynon Taf with 1,194 households², where the most expensive property was sold for £695,000.00.
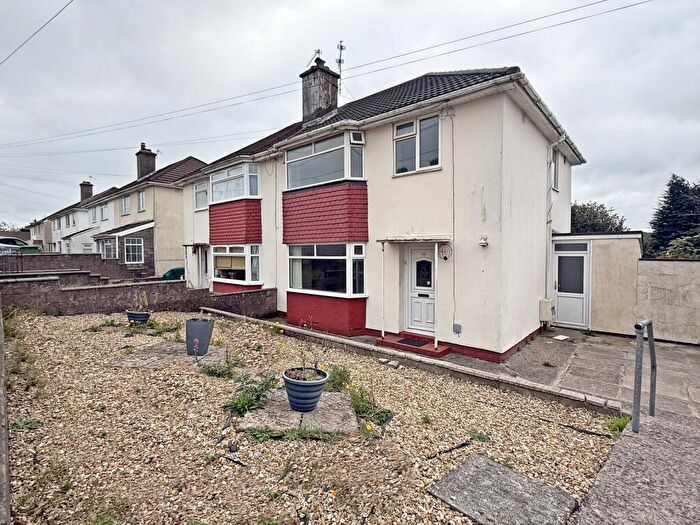
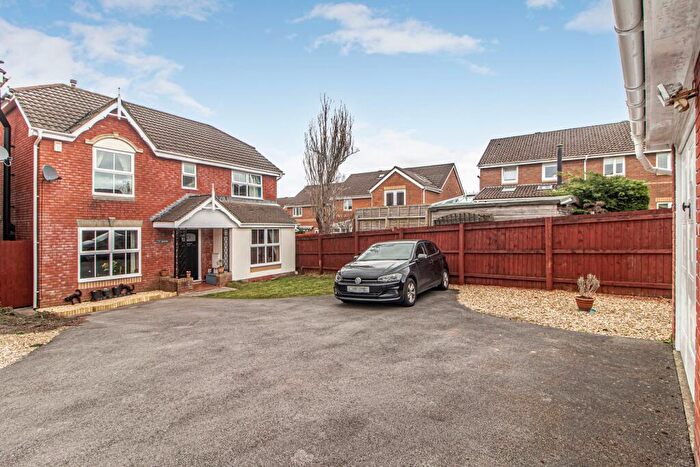
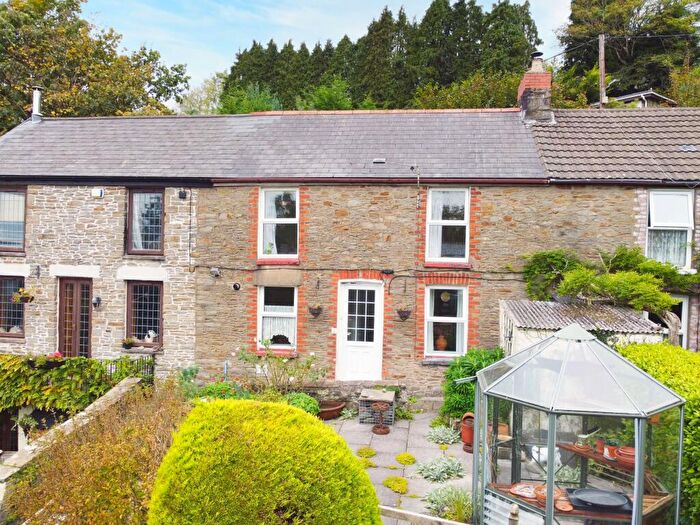
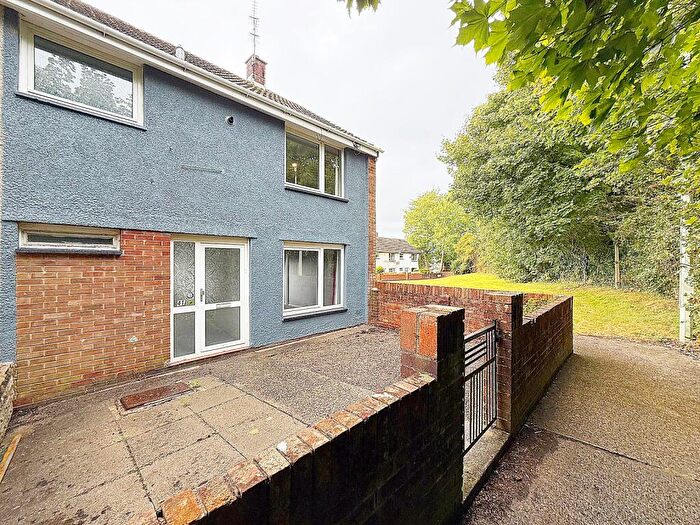
Properties for sale in Talbot Green
Roads and Postcodes in Talbot Green
Navigate through our locations to find the location of your next house in Talbot Green, Pontyclun for sale or to rent.
| Streets | Postcodes |
|---|---|
| Ash Walk | CF72 8RE |
| Bronhaul | CF72 8HW |
| Cherry Tree Walk | CF72 8RG |
| Clos Springfield | CF72 8FE |
| Cowbridge Road | CF72 8HS CF72 8FH CF72 8HL CF72 8UU CF72 8XU CF72 8YQ |
| Dan Y Graig Heights | CF72 8FD |
| Danygraig Crescent | CF72 8AR |
| Danygraig Drive | CF72 8AQ |
| Dunraven Crescent | CF72 8JD |
| Ely Valley Road | CF72 8AP CF72 8LL CF72 8AL CF72 8FP CF72 8GL |
| Fairways View | CF72 8JG |
| Fanheulog | CF72 8HQ |
| Firbanks Way | CF72 8LB |
| Forest Hills Drive | CF72 8JB |
| Forest View | CF72 8RD |
| Forest Walk | CF72 8HH |
| Garth Maelwg | CF72 8HN |
| Glamorgan Vale Retail Park | CF72 8RP |
| Green Lane | CF72 8RQ |
| Green Meadow | CF72 8XT |
| Green Park | CF72 8RB CF72 8RJ CF72 8RL CF72 8RN CF72 8SD |
| Heol Gwaun Eli | CF72 8FL |
| Heol Johnson | CF72 8HR |
| Heol Miaren | CF72 9WL |
| Heol Miles | CF72 8HU |
| Heol Y Gyfraith | CF72 8AJ |
| Lanelay Close | CF72 8JA |
| Lanelay Cottages | CF72 8HX |
| Lanelay Lane | CF72 9ZJ |
| Lanelay Park | CF72 8RA |
| Lanelay Road | CF72 8HY CF72 8HZ |
| Llys Catwg | CF72 8SE |
| Maes Y Rhedyn | CF72 8AN |
| Oak Close | CF72 8RF |
| Parc Newydd Shopping Centre | CF72 8SY |
| Pine Court | CF72 8LA |
| Pinewood Hill | CF72 8JE |
| Riverside Court | CF72 8TP |
| Stuart Terrace | CF72 8AA CF72 8HT |
| Talbot Close | CF72 8AS |
| Talbot Green Retail Park | CF72 8LW |
| Talbot Road | CF72 8AE CF72 8AF CF72 8AH CF72 8AW CF72 8AD |
| Talbot Square | CF72 8AB |
| Woodfield Road | CF72 8JF |
| Ynysbryn Close | CF72 8AX |
| CF72 8AU CF72 0BZ CF72 0DG CF72 0DH CF72 0DN CF72 0DQ CF72 0DW CF72 0DZ CF72 0EA CF72 0EE CF72 8UX CF72 8WP CF72 8XL CF72 8XR CF72 9YY CF72 9ZA |
Transport near Talbot Green
-
Pontyclun Station
-
Llanharan Station
-
Trefforest Station
-
Trefforest Estate Station
-
Pontypridd Station
-
Pencoed Station
- FAQ
- Price Paid By Year
- Property Type Price
Frequently asked questions about Talbot Green
What is the average price for a property for sale in Talbot Green?
The average price for a property for sale in Talbot Green is £241,747. This amount is 8% lower than the average price in Pontyclun. There are 611 property listings for sale in Talbot Green.
What streets have the most expensive properties for sale in Talbot Green?
The streets with the most expensive properties for sale in Talbot Green are Ely Valley Road at an average of £695,000, Pine Court at an average of £372,250 and Lanelay Road at an average of £351,857.
What streets have the most affordable properties for sale in Talbot Green?
The streets with the most affordable properties for sale in Talbot Green are Fanheulog at an average of £140,000, Forest View at an average of £146,333 and Lanelay Park at an average of £176,250.
Which train stations are available in or near Talbot Green?
Some of the train stations available in or near Talbot Green are Pontyclun, Llanharan and Trefforest.
Property Price Paid in Talbot Green by Year
The average sold property price by year was:
| Year | Average Sold Price | Price Change |
Sold Properties
|
|---|---|---|---|
| 2025 | £241,565 | -2% |
23 Properties |
| 2024 | £247,560 | 10% |
33 Properties |
| 2023 | £223,626 | -13% |
30 Properties |
| 2022 | £252,219 | 14% |
34 Properties |
| 2021 | £217,098 | 0,1% |
47 Properties |
| 2020 | £216,933 | 9% |
37 Properties |
| 2019 | £196,413 | 2% |
48 Properties |
| 2018 | £192,294 | 1% |
44 Properties |
| 2017 | £191,132 | -7% |
49 Properties |
| 2016 | £204,623 | 18% |
42 Properties |
| 2015 | £168,017 | 10% |
47 Properties |
| 2014 | £151,225 | -13% |
54 Properties |
| 2013 | £170,761 | 4% |
36 Properties |
| 2012 | £164,394 | 6% |
26 Properties |
| 2011 | £154,775 | -3% |
20 Properties |
| 2010 | £159,893 | 3% |
29 Properties |
| 2009 | £155,021 | 11% |
23 Properties |
| 2008 | £138,018 | -11% |
19 Properties |
| 2007 | £153,832 | 5% |
56 Properties |
| 2006 | £146,612 | 4% |
33 Properties |
| 2005 | £140,853 | 3% |
63 Properties |
| 2004 | £136,457 | 5% |
123 Properties |
| 2003 | £129,959 | 30% |
74 Properties |
| 2002 | £91,019 | 21% |
41 Properties |
| 2001 | £71,782 | 7% |
37 Properties |
| 2000 | £66,434 | 7% |
22 Properties |
| 1999 | £61,500 | 15% |
31 Properties |
| 1998 | £52,286 | -5% |
38 Properties |
| 1997 | £54,980 | 6% |
35 Properties |
| 1996 | £51,576 | 7% |
28 Properties |
| 1995 | £47,731 | - |
27 Properties |
Property Price per Property Type in Talbot Green
Here you can find historic sold price data in order to help with your property search.
The average Property Paid Price for specific property types in the last three years are:
| Property Type | Average Sold Price | Sold Properties |
|---|---|---|
| Semi Detached House | £244,216.00 | 45 Semi Detached Houses |
| Detached House | £340,142.00 | 21 Detached Houses |
| Terraced House | £215,152.00 | 46 Terraced Houses |
| Flat | £122,500.00 | 8 Flats |

