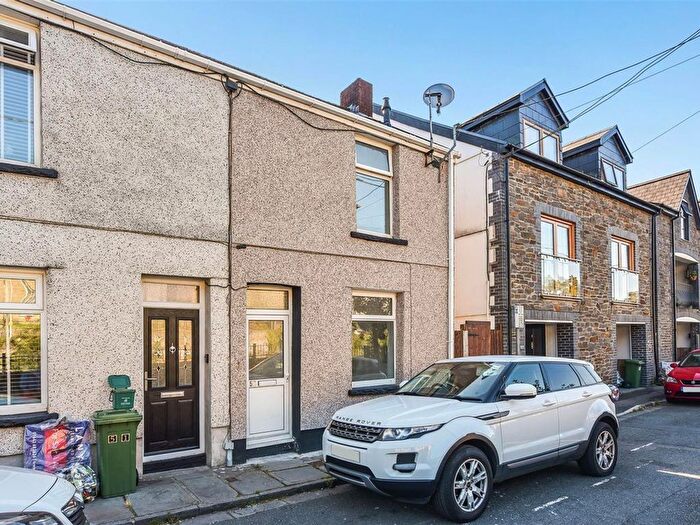
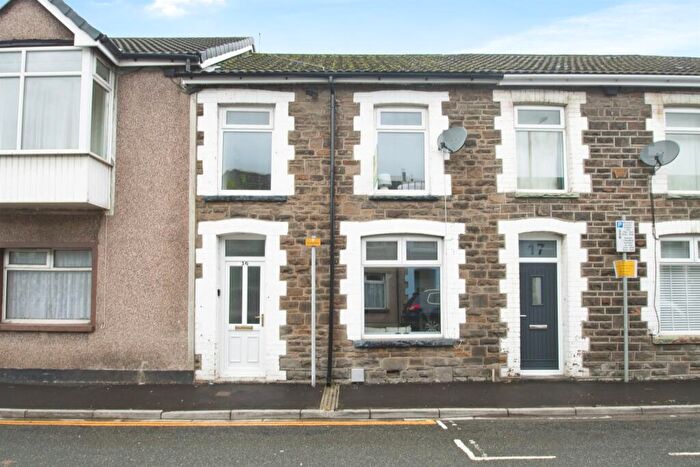
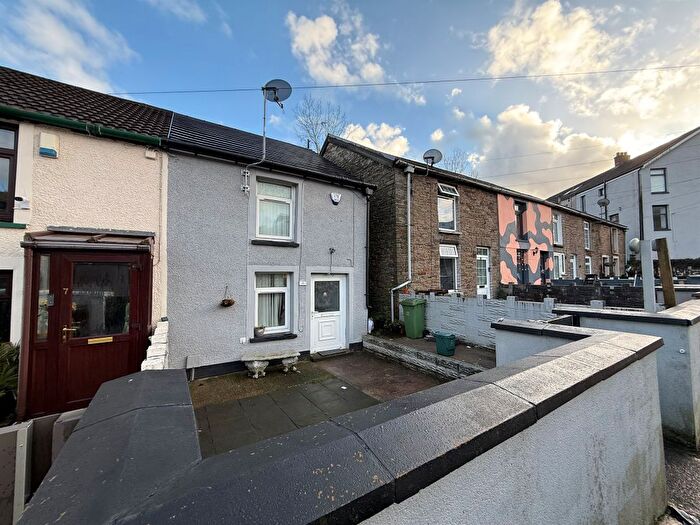
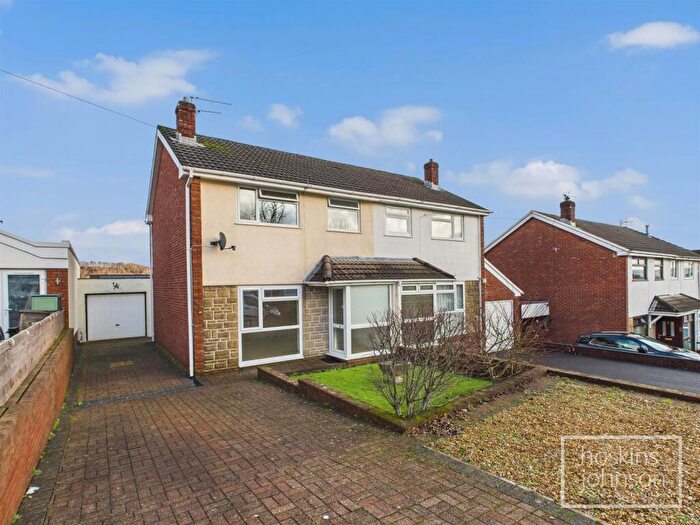
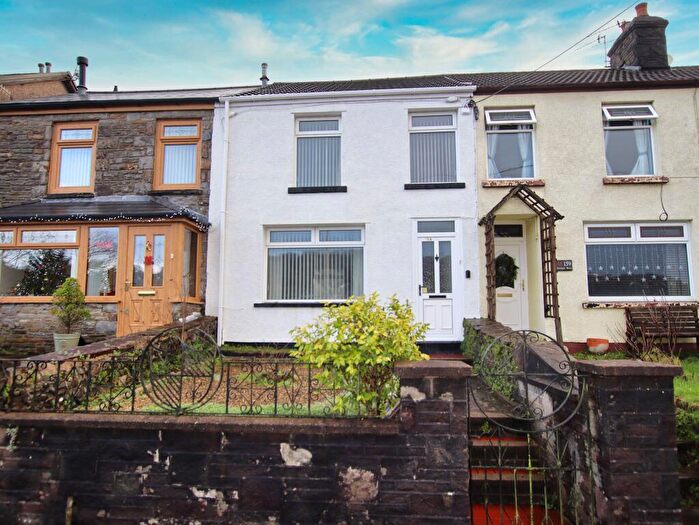
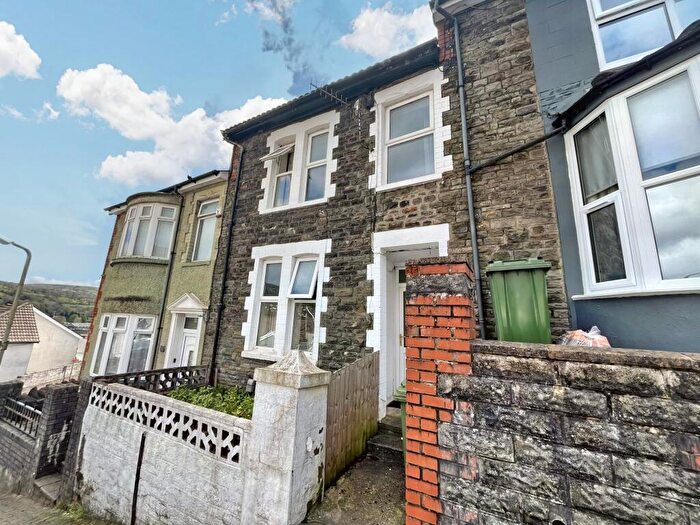
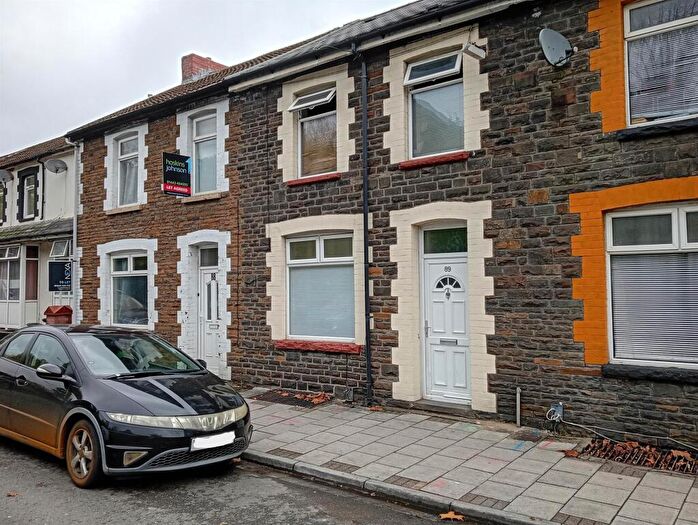
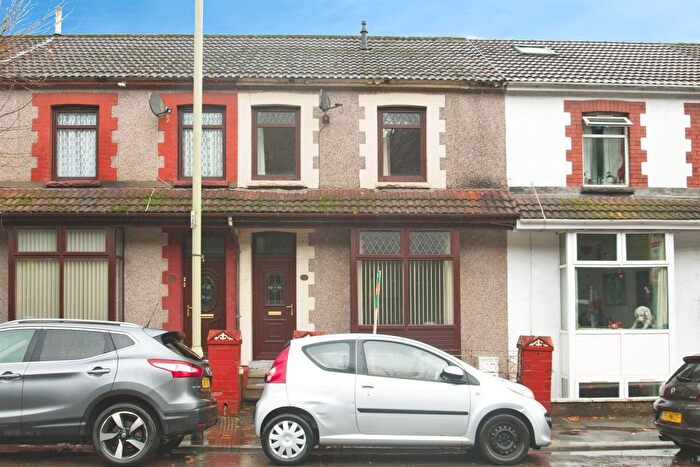
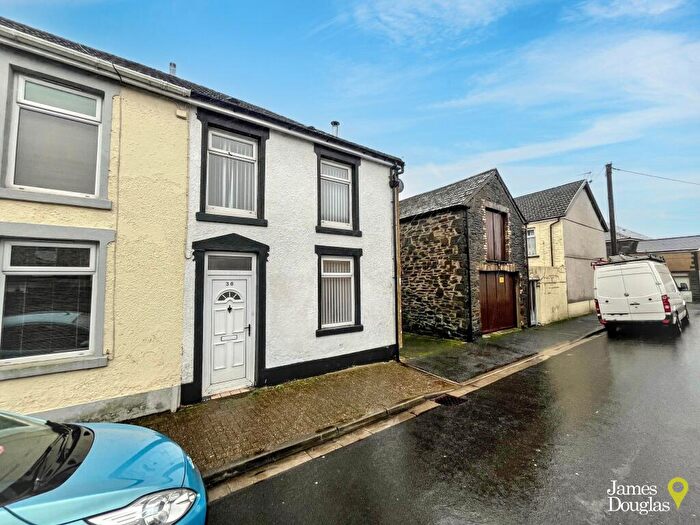
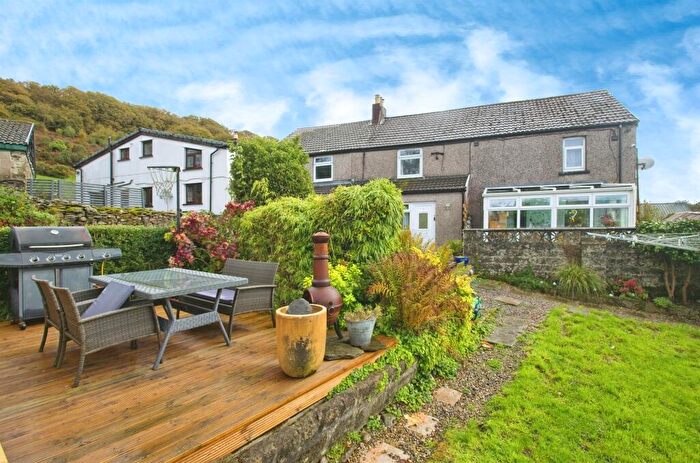
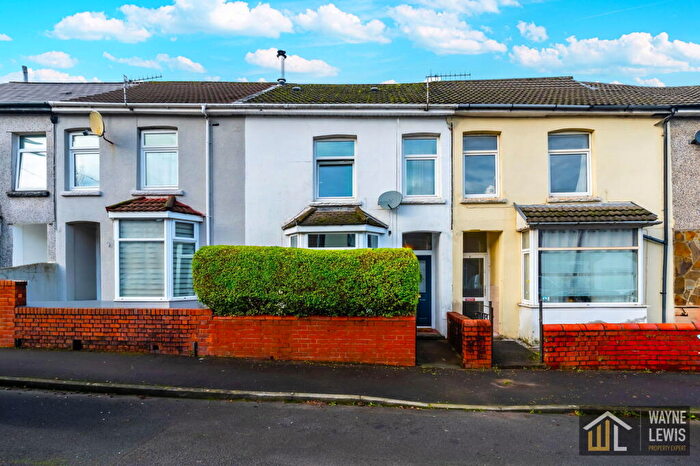
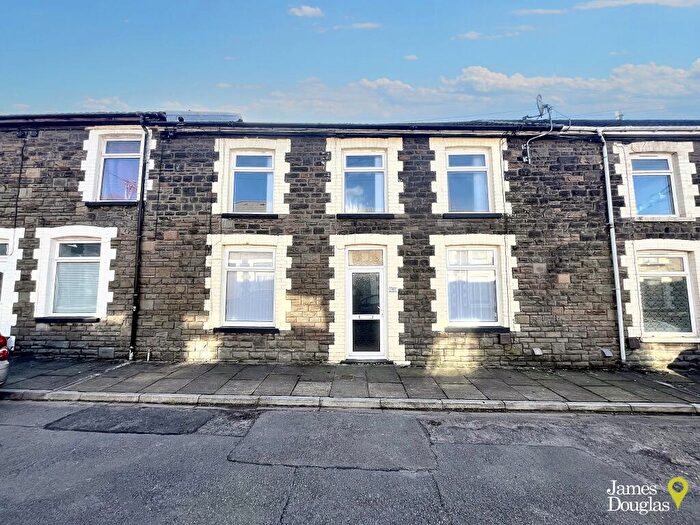
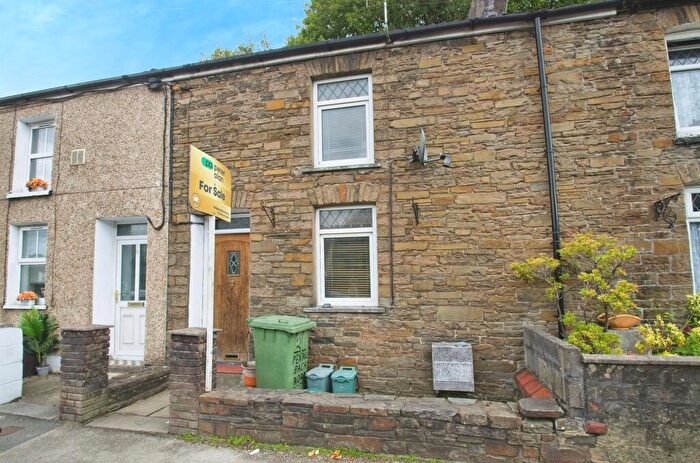
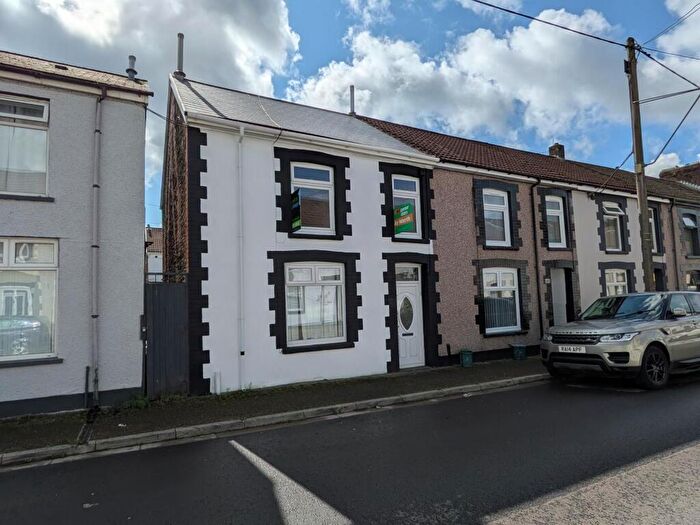
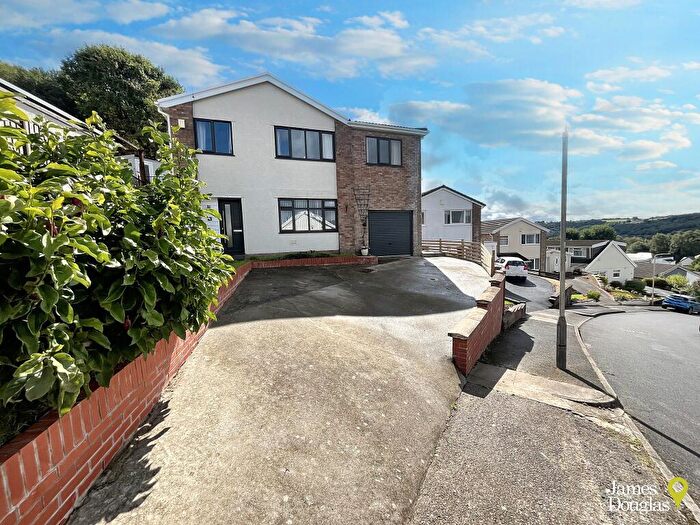
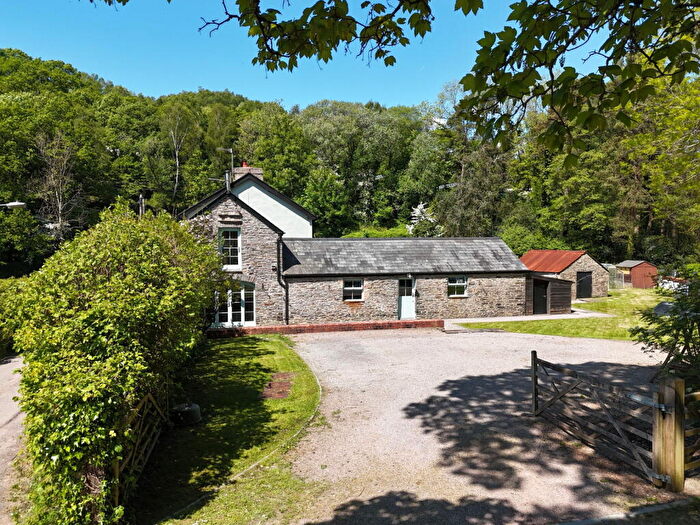
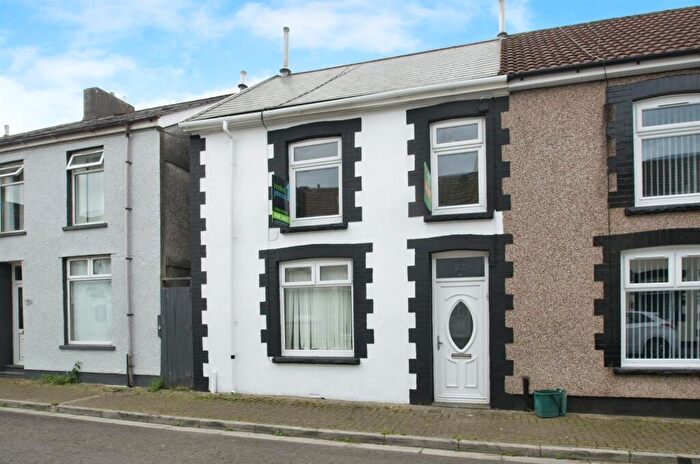
Houses for sale & to rent in Trallwng, Pontypridd
House Prices in Trallwng
Properties in Trallwng have an average house price of £155,303.00 and had 230 Property Transactions within the last 3 years¹.
Trallwng is an area in Pontypridd, Rhondda Cynon Taf - Rhondda Cynon Taf with 1,687 households², where the most expensive property was sold for £350,000.00.
Properties for sale in Trallwng
Roads and Postcodes in Trallwng
Navigate through our locations to find the location of your next house in Trallwng, Pontypridd for sale or to rent.
| Streets | Postcodes |
|---|---|
| Alpha Street | CF37 4RT |
| Bassett Street | CF37 4RU |
| Bonvilston Road | CF37 4RD CF37 4RE CF37 4RF CF37 4RG |
| Bonvilston Terrace | CF37 4RW |
| Bridge Street | CF37 4PE CF37 4PF |
| Brookfield Lane | CF37 4DN |
| Bryn Olwg | CF37 4DQ |
| Canal Cottages | CF37 4LL |
| Central Square | CF37 4PN |
| Ceridwen Terrace | CF37 4PD |
| Church Road | CF37 4RN |
| Clos Camlas | CF37 4RX |
| Coedpenmaen Close | CF37 4LE |
| Coedpenmaen Road | CF37 4LD CF37 4LG CF37 4LH CF37 4LJ CF37 4LP CF37 4LR |
| Common Road | CF37 4AE CF37 4AF |
| Cross Street | CF37 4RY |
| Crossway Street | CF37 4RP |
| Dewi Street | CF37 4RB |
| Dodington Place | CF37 4LN |
| Dorothy Street | CF37 4RR |
| East Street | CF37 4PH CF37 4PJ CF37 4PL CF37 4PQ |
| Fish Lane | CF37 4SH |
| Foundry Place | CF37 4SB |
| Francis Terrace | CF37 4LU |
| Fron Terrace | CF37 4DT |
| Heather View Road | CF37 4DL |
| Hilltop Crescent | CF37 4AD |
| Holly Lane | CF37 4DE |
| Hospital Road | CF37 4AH CF37 4AL |
| Jones Place | CF37 4LW |
| Kenwyn Terrace | CF37 4RA |
| Llanover Road | CF37 4DY |
| Llys Ty Gwyn | CF37 4DZ |
| Lower Taff View | CF37 4LT |
| Mackintosh Road | CF37 4AG |
| Merthyr Road | CF37 4DB CF37 4DD CF37 4DG CF37 4DH |
| Middle Street | CF37 4PP CF37 4PW |
| Moorland Heights | CF37 4AQ |
| New Houses | CF37 4LF CF37 4SA |
| Newbridge Court | CF37 4SG |
| Nightingales Bush | CF37 4BP |
| North Street | CF37 4PT |
| Pencoed Avenue | CF37 4AN |
| Pleasant View | CF37 4DU |
| Ralph Street | CF37 4RS |
| Rockingstone Terrace | CF37 4AP |
| Scarborough Road | CF37 4DS |
| Sion Street | CF37 4SD |
| South Street | CF37 4PR |
| The Avenue | CF37 4DF |
| The Common | CF37 4AX CF37 4DJ |
| The Parade | CF37 4PU CF37 4PY |
| Thurston Road | CF37 4RH CF37 4RL |
| Ty Gwyn Road | CF37 4AA |
| West Street | CF37 4PS |
| Wingfield Close | CF37 4AB |
| Ynysangharad Road | CF37 4DA |
| CF37 4AW CF37 4RZ |
Transport near Trallwng
- FAQ
- Price Paid By Year
- Property Type Price
Frequently asked questions about Trallwng
What is the average price for a property for sale in Trallwng?
The average price for a property for sale in Trallwng is £155,303. This amount is 15% lower than the average price in Pontypridd. There are 706 property listings for sale in Trallwng.
What streets have the most expensive properties for sale in Trallwng?
The streets with the most expensive properties for sale in Trallwng are Hilltop Crescent at an average of £345,000, Pencoed Avenue at an average of £250,000 and Nightingales Bush at an average of £250,000.
What streets have the most affordable properties for sale in Trallwng?
The streets with the most affordable properties for sale in Trallwng are Sion Street at an average of £106,843, Ynysangharad Road at an average of £116,000 and West Street at an average of £118,571.
Which train stations are available in or near Trallwng?
Some of the train stations available in or near Trallwng are Pontypridd, Trefforest and Trehafod.
Property Price Paid in Trallwng by Year
The average sold property price by year was:
| Year | Average Sold Price | Price Change |
Sold Properties
|
|---|---|---|---|
| 2025 | £148,224 | -8% |
45 Properties |
| 2024 | £159,373 | 7% |
56 Properties |
| 2023 | £148,031 | -10% |
56 Properties |
| 2022 | £162,125 | 10% |
73 Properties |
| 2021 | £146,396 | -11% |
76 Properties |
| 2020 | £161,892 | 21% |
47 Properties |
| 2019 | £127,834 | 12% |
76 Properties |
| 2018 | £112,343 | -0,5% |
84 Properties |
| 2017 | £112,877 | -2% |
73 Properties |
| 2016 | £115,325 | -2% |
64 Properties |
| 2015 | £117,714 | 7% |
67 Properties |
| 2014 | £109,368 | 10% |
52 Properties |
| 2013 | £98,666 | -0,5% |
59 Properties |
| 2012 | £99,143 | -3% |
40 Properties |
| 2011 | £102,557 | -15% |
41 Properties |
| 2010 | £118,142 | 20% |
42 Properties |
| 2009 | £94,270 | -19% |
45 Properties |
| 2008 | £112,195 | -10% |
44 Properties |
| 2007 | £123,863 | 8% |
68 Properties |
| 2006 | £114,565 | 12% |
69 Properties |
| 2005 | £100,422 | 7% |
70 Properties |
| 2004 | £93,086 | 20% |
69 Properties |
| 2003 | £74,617 | 22% |
112 Properties |
| 2002 | £58,282 | 17% |
97 Properties |
| 2001 | £48,664 | 9% |
82 Properties |
| 2000 | £44,271 | 7% |
68 Properties |
| 1999 | £41,372 | 7% |
74 Properties |
| 1998 | £38,552 | -13% |
65 Properties |
| 1997 | £43,427 | 9% |
66 Properties |
| 1996 | £39,491 | 16% |
72 Properties |
| 1995 | £33,065 | - |
49 Properties |
Property Price per Property Type in Trallwng
Here you can find historic sold price data in order to help with your property search.
The average Property Paid Price for specific property types in the last three years are:
| Property Type | Average Sold Price | Sold Properties |
|---|---|---|
| Semi Detached House | £198,472.00 | 36 Semi Detached Houses |
| Detached House | £273,333.00 | 3 Detached Houses |
| Terraced House | £145,604.00 | 190 Terraced Houses |
| Flat | £90,000.00 | 1 Flat |

