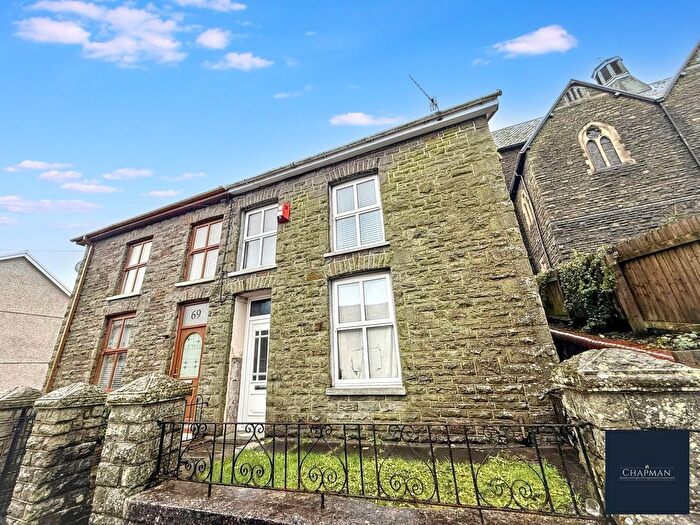
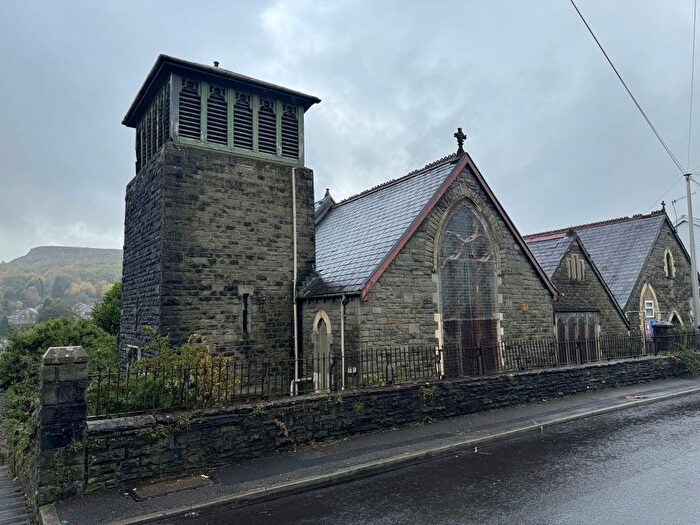
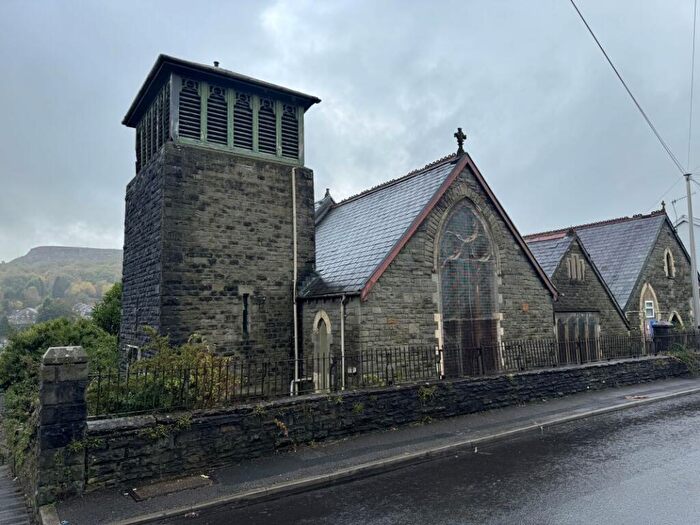
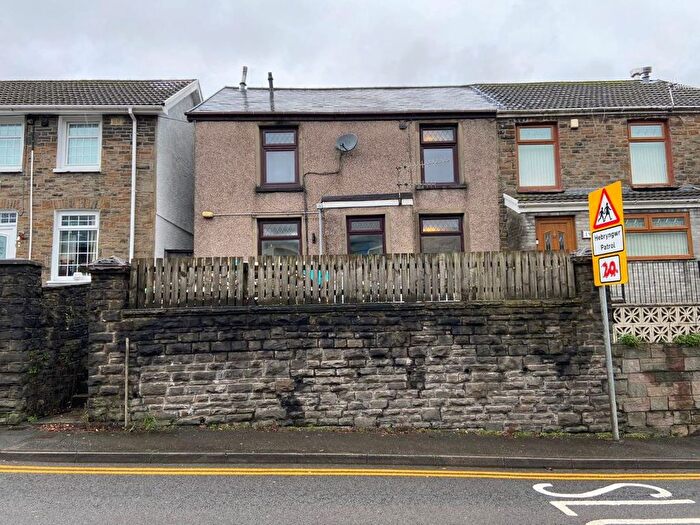
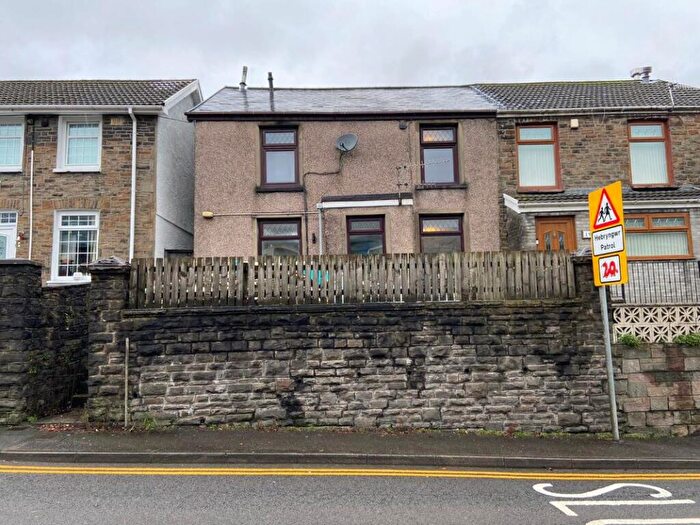
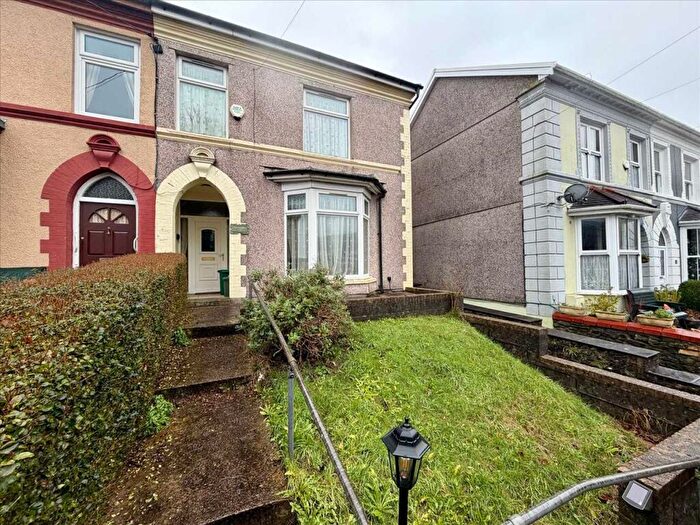
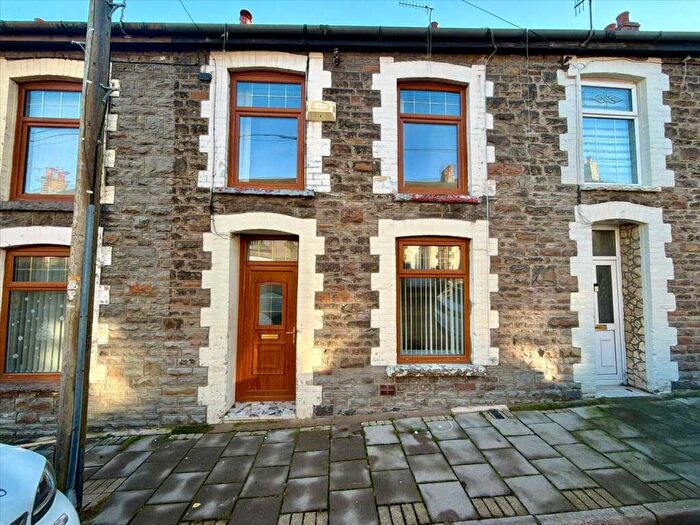
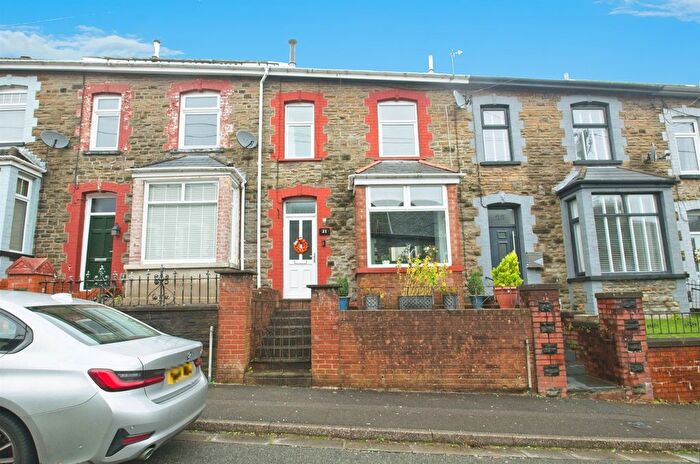
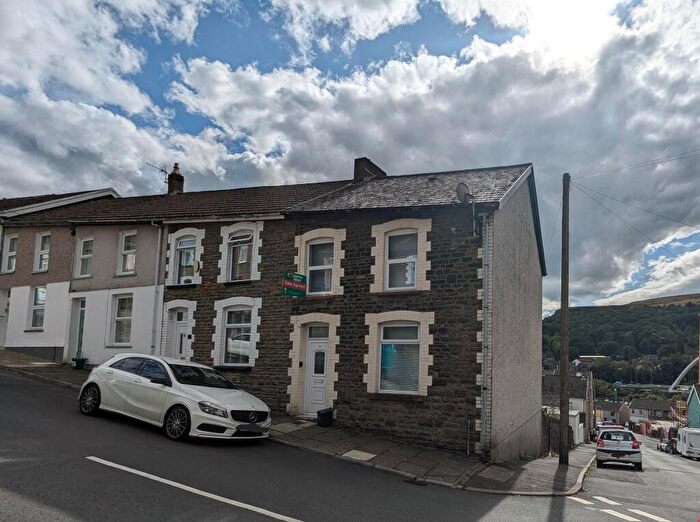
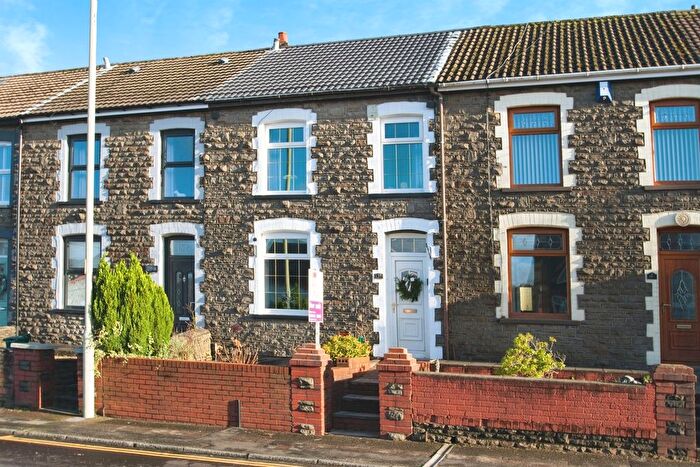
Houses for sale & to rent in Cymmer, Porth
House Prices in Cymmer
Properties in Cymmer have an average house price of £113,300.00 and had 217 Property Transactions within the last 3 years¹.
Cymmer is an area in Porth, Rhondda Cynon Taf - Rhondda Cynon Taf with 2,139 households², where the most expensive property was sold for £317,500.00.
Properties for sale in Cymmer
Roads and Postcodes in Cymmer
Navigate through our locations to find the location of your next house in Cymmer, Porth for sale or to rent.
| Streets | Postcodes |
|---|---|
| Argyle Street | CF39 9AT |
| Aubrey Road | CF39 9HY |
| Avondale Court | CF39 9NH |
| Bedw Close | CF39 9LE |
| Bedw Farm Estate | CF39 9ES |
| Bedw Street | CF39 9LD |
| Belmont Terrace | CF39 9LB |
| Blosse Terrace | CF39 9LH |
| Britannia Street | CF39 9NE |
| Brocks Terrace | CF39 9YS |
| Brook Street | CF39 9AU CF39 9NA |
| Bryn Bedw | CF39 9HP |
| Bryn Crydd | CF39 9EF |
| Bryn Ffynon | CF39 9EE |
| Brynheulog Cottages | CF39 9AL |
| Catherine Crescent | CF39 9HB CF39 9AF |
| Cefn Bryn | CF39 9BJ |
| Channel Avenue | CF39 9EX |
| Clifton Row | CF39 9ND |
| Craig Crescent | CF39 9EB |
| Cross Street | CF39 9LW |
| Cwrt Y Mynydd | CF39 9DW |
| Danygraig Cottages | CF39 9YY |
| Danygraig Terrace | CF39 9YT |
| Dyllas Court | CF39 9HH |
| Dyllas Road | CF39 9LP |
| Edmund Street | CF39 9NF |
| Eirw Road | CF39 9LT CF39 9LU |
| Glan Ffrwd | CF39 9EG |
| Glyn Street | CF39 9LN |
| Glynfach Road | CF39 9LF CF39 9LG |
| Graigwen Road | CF39 9HA |
| Gwaun Bedw | CF39 9HL CF39 9HN |
| Henllys | CF39 9DX CF39 9PJ |
| Heol Eurwen Davies | CF39 9AZ |
| Heol Horeb | CF39 9HD |
| High Street | CF39 9AB CF39 9AD CF39 9AE CF39 9AP CF39 9AR CF39 9AW CF39 9EU CF39 9EY |
| Hillcrest Drive | CF39 9HU |
| Kensington Drive | CF39 9NN |
| Kimberley Way | CF39 9HS |
| Leyshon Terrace | CF39 9LY |
| Lincoln Street | CF39 9AS |
| Llandaff Way | CF39 9HX |
| Maes Bedw | CF39 9HF |
| Morgan Street | CF39 9AG |
| Morgan Terrace | CF39 9LR |
| Nantgwyn | CF39 9EH |
| Office Street | CF39 9AH |
| Olive Terrace | CF39 9YU |
| Palmers Row | CF39 9ER |
| Pen Darren | CF39 9AX |
| Pen Y Dre | CF39 9DJ |
| Pinewalk Drive | CF39 9NL |
| Pontypridd Road | CF39 9BA |
| Radnor Way | CF39 9RJ |
| Rhiwgarn Road | CF39 9HJ CF39 9LJ CF39 9PX |
| Rickards Street | CF39 9LL |
| River Terrace | CF39 9LS |
| School Street | CF39 9AN |
| Shrewsbury Avenue | CF39 9RX |
| St Davids Close | CF39 9EJ |
| St James Court | CF39 9BD |
| St Johns Street | CF39 9LA |
| Tan Y Bryn | CF39 9ED |
| Thomas Place | CF39 9AY |
| Ton Hywel | CF39 9EA CF39 9EN |
| Trebanog Road | CF39 9DS CF39 9DT CF39 9DU CF39 9DY CF39 9EL CF39 9EP CF39 9EW |
| Trem Y Glyn | CF39 9AJ |
| Twyn Bedw | CF39 9HR |
| Waun Wen | CF39 9LX |
| Wyndham Street | CF39 9HT |
| CF39 9BX CF39 9ET CF39 9HG CF39 9HW |
Transport near Cymmer
- FAQ
- Price Paid By Year
- Property Type Price
Frequently asked questions about Cymmer
What is the average price for a property for sale in Cymmer?
The average price for a property for sale in Cymmer is £113,300. This amount is 24% lower than the average price in Porth. There are 740 property listings for sale in Cymmer.
What streets have the most expensive properties for sale in Cymmer?
The streets with the most expensive properties for sale in Cymmer are Pinewalk Drive at an average of £188,333, Kimberley Way at an average of £184,214 and Bedw Street at an average of £172,500.
What streets have the most affordable properties for sale in Cymmer?
The streets with the most affordable properties for sale in Cymmer are Edmund Street at an average of £44,000, Danygraig Terrace at an average of £58,750 and Leyshon Terrace at an average of £66,500.
Which train stations are available in or near Cymmer?
Some of the train stations available in or near Cymmer are Porth, Trehafod and Dinas (Rhondda).
Property Price Paid in Cymmer by Year
The average sold property price by year was:
| Year | Average Sold Price | Price Change |
Sold Properties
|
|---|---|---|---|
| 2025 | £114,398 | 5% |
25 Properties |
| 2024 | £108,653 | -2% |
52 Properties |
| 2023 | £110,709 | -8% |
76 Properties |
| 2022 | £119,723 | 19% |
64 Properties |
| 2021 | £96,691 | 2% |
86 Properties |
| 2020 | £94,342 | 12% |
46 Properties |
| 2019 | £82,835 | 4% |
75 Properties |
| 2018 | £79,406 | -6% |
71 Properties |
| 2017 | £84,353 | 18% |
61 Properties |
| 2016 | £69,500 | 2% |
62 Properties |
| 2015 | £67,925 | -16% |
65 Properties |
| 2014 | £79,045 | 9% |
51 Properties |
| 2013 | £71,980 | 13% |
38 Properties |
| 2012 | £62,834 | -4% |
38 Properties |
| 2011 | £65,077 | -7% |
46 Properties |
| 2010 | £69,818 | -7% |
30 Properties |
| 2009 | £75,050 | -13% |
30 Properties |
| 2008 | £85,143 | 7% |
24 Properties |
| 2007 | £78,893 | -3% |
58 Properties |
| 2006 | £80,949 | 26% |
71 Properties |
| 2005 | £60,255 | 2% |
71 Properties |
| 2004 | £59,225 | 25% |
80 Properties |
| 2003 | £44,405 | 20% |
92 Properties |
| 2002 | £35,351 | 12% |
76 Properties |
| 2001 | £31,049 | 5% |
75 Properties |
| 2000 | £29,508 | -23% |
59 Properties |
| 1999 | £36,186 | 9% |
50 Properties |
| 1998 | £32,989 | 23% |
48 Properties |
| 1997 | £25,408 | -42% |
48 Properties |
| 1996 | £36,160 | 20% |
44 Properties |
| 1995 | £28,971 | - |
47 Properties |
Property Price per Property Type in Cymmer
Here you can find historic sold price data in order to help with your property search.
The average Property Paid Price for specific property types in the last three years are:
| Property Type | Average Sold Price | Sold Properties |
|---|---|---|
| Semi Detached House | £150,109.00 | 45 Semi Detached Houses |
| Terraced House | £102,739.00 | 164 Terraced Houses |
| Flat | £53,666.00 | 3 Flats |
| Detached House | £164,190.00 | 5 Detached Houses |

