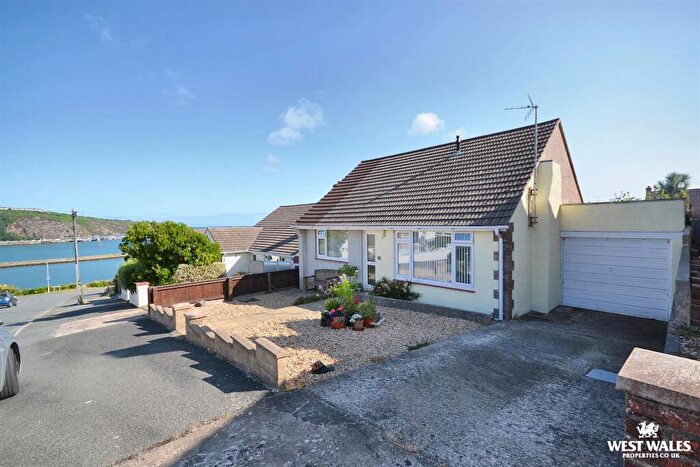
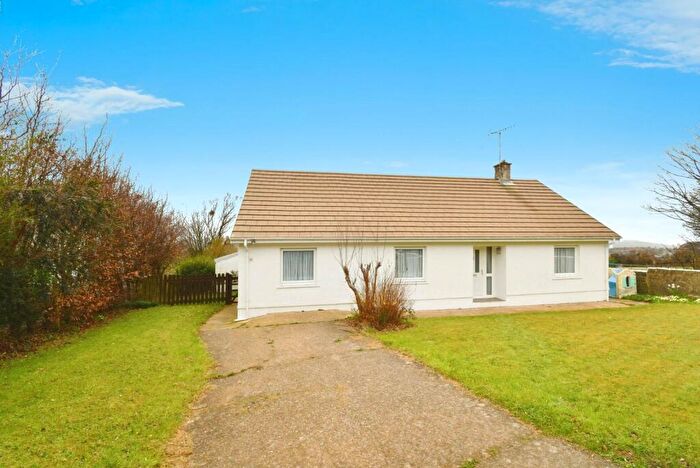
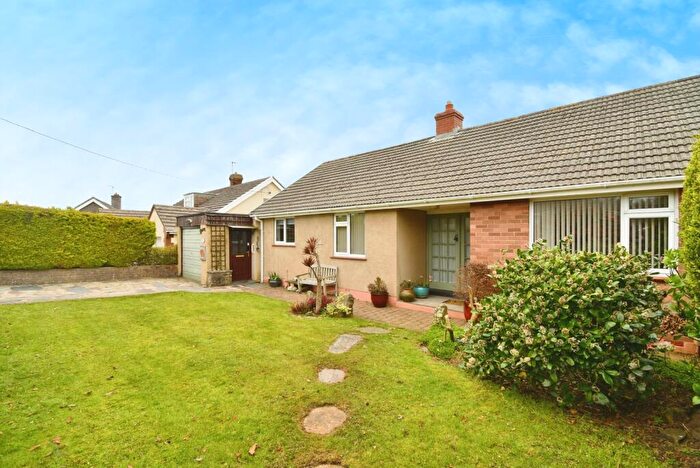
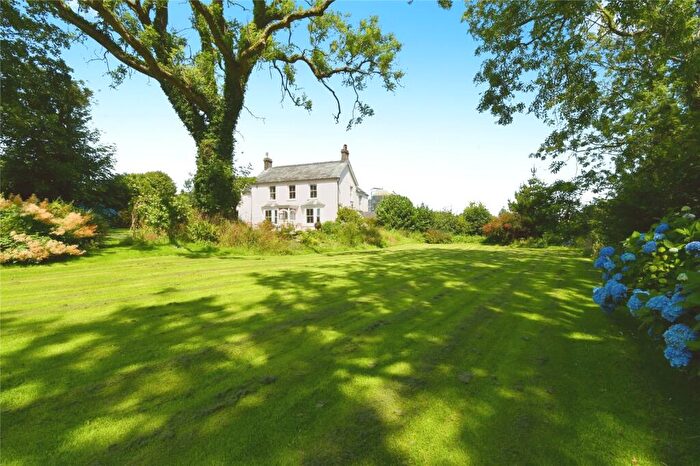
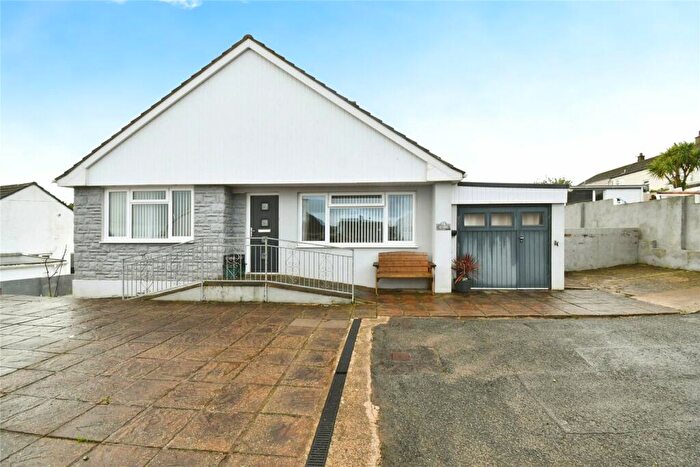
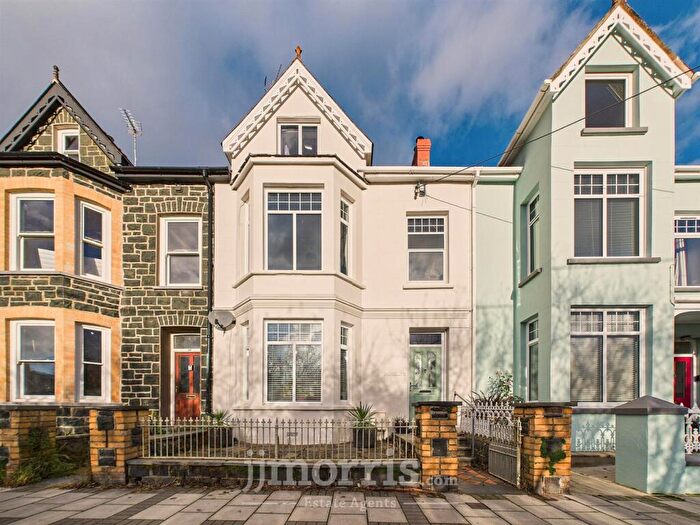
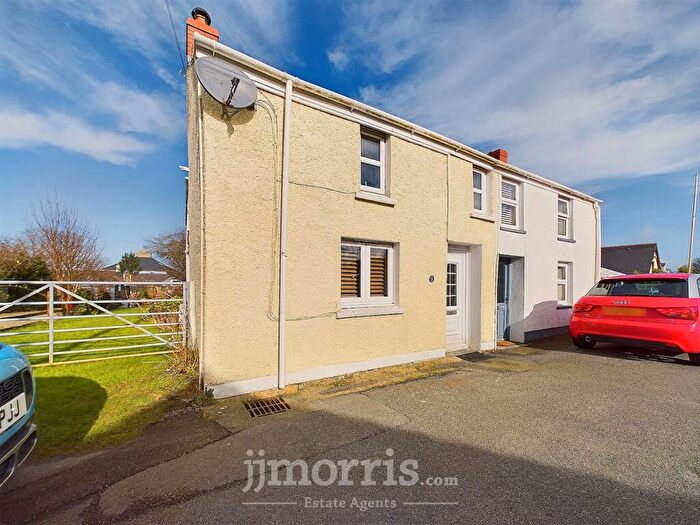
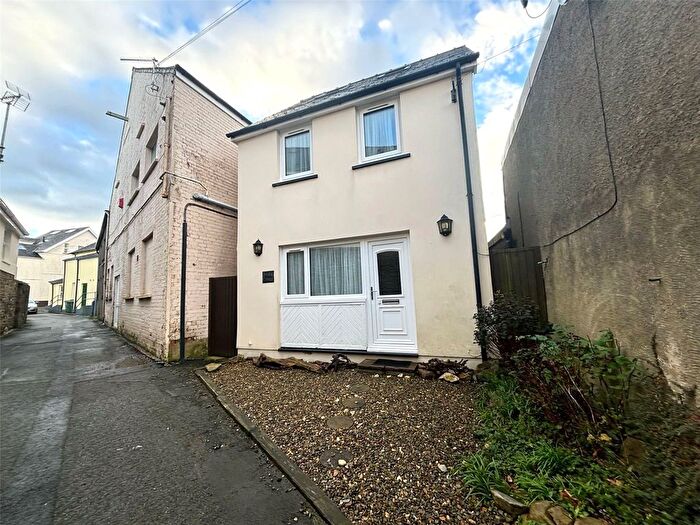
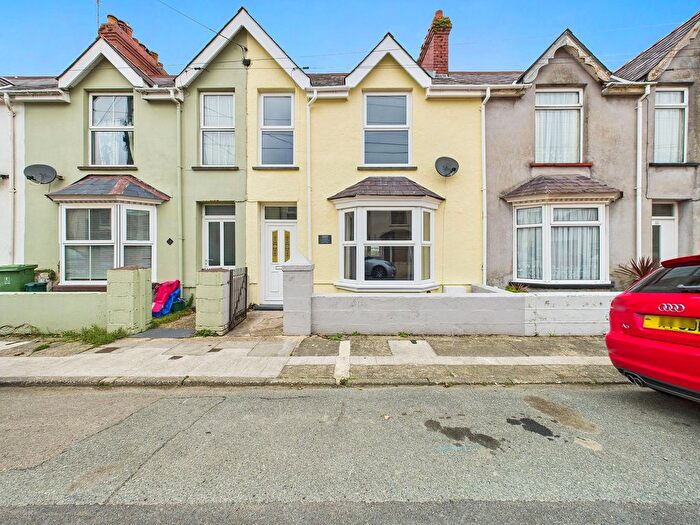
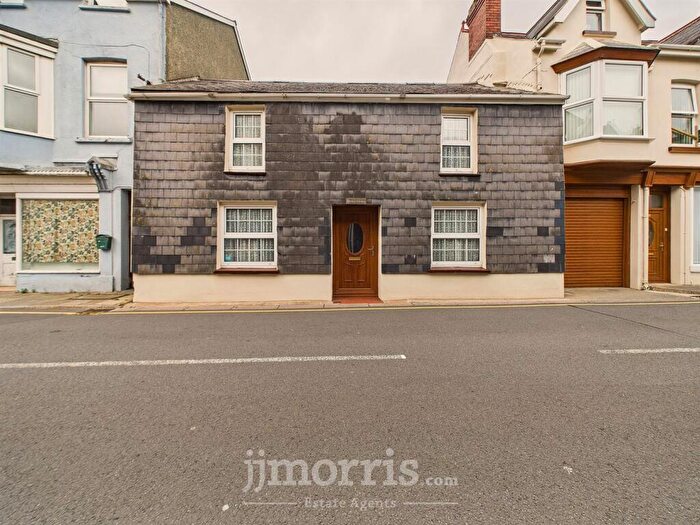
Houses for sale & to rent in Fishguard North East, Fishguard
House Prices in Fishguard North East
Properties in Fishguard North East have an average house price of £240,485.00 and had 125 Property Transactions within the last 3 years¹.
Fishguard North East is an area in Fishguard, Sir Benfro - Pembrokeshire with 885 households², where the most expensive property was sold for £850,000.00.
Properties for sale in Fishguard North East
Previously listed properties in Fishguard North East
Roads and Postcodes in Fishguard North East
Navigate through our locations to find the location of your next house in Fishguard North East, Fishguard for sale or to rent.
| Streets | Postcodes |
|---|---|
| Back Lane | SA65 9LD |
| Bank Terrace | SA65 9PG |
| Bridge Street | SA65 9LX |
| Brodog Court | SA65 9NF |
| Brodog Lane | SA65 9NR SA65 9NT |
| Brodog Terrace | SA65 9NP SA65 9NS SA65 9NW SA65 9ED |
| Bryn Elfed | SA65 9EA |
| Bryn Gomer | SA65 9EP |
| Bryn Llewellyn | SA65 9AX |
| Bryn Road | SA65 9AA |
| Feidr Dylan | SA65 9EG SA65 9EQ |
| Glyn Y Mel Road | SA65 9LY |
| Gwaun View | SA65 9LF |
| Hamilton Street | SA65 9HL |
| Heol Caradog | SA65 9AY |
| Heol Crwys | SA65 9EJ |
| Heol Cynan | SA65 9EF |
| Heol Dewi | SA65 9DX SA65 9DY |
| Heol Emrys | SA65 9EB SA65 9EE |
| Heol Glyndwr | SA65 9LN |
| Heol Trefin | SA65 9EN |
| Hill Terrace | SA65 9LU |
| Hottipass Street | SA65 9LJ |
| Jubilee Terrace | SA65 9HX |
| Kensington Street | SA65 9LB SA65 9LH |
| Maes Waldo | SA65 9ER |
| Main Street | SA65 9HG SA65 9HJ |
| Marchgate Paddock | SA65 9NU |
| Newport Road | SA65 9ND |
| Old Newport Road | SA65 9NA |
| Pantycelyn | SA65 9EH SA65 9EL |
| Penslade | SA65 9PA SA65 9PB |
| Penslade Terrace | SA65 9AB |
| Penwallis | SA65 9HR |
| Plasyfron | SA65 9LP SA65 9LR |
| Quay Street | SA65 9NB |
| Slade Cottages | SA65 9PE |
| Sladeway | SA65 9NX SA65 9NY |
| Smyth Street | SA65 9LG |
| The Slade | SA65 9PD |
| Tower Hill | SA65 9LA SA65 9LS SA65 9LT |
| Vergam Terrace | SA65 9DF |
| Victoria Avenue | SA65 9DJ |
| West Street | SA65 9AE SA65 9NL SA65 9NQ |
| Windy Hall | SA65 9DP SA65 9PN |
| SA65 9DN SA65 9DU SA65 0AA SA65 0AL SA65 0AN SA65 9LE SA65 9LQ SA65 9LW SA65 9LZ SA65 9PL SA65 9SS SA65 9YF SA65 9NZ |
Transport near Fishguard North East
-
Fishguard and Goodwick Station
-
Fishguard Harbour Station
-
Clarbeston Road Station
-
Haverfordwest Station
-
Clunderwen Station
- FAQ
- Price Paid By Year
- Property Type Price
Frequently asked questions about Fishguard North East
What is the average price for a property for sale in Fishguard North East?
The average price for a property for sale in Fishguard North East is £240,485. This amount is 3% higher than the average price in Fishguard. There are 421 property listings for sale in Fishguard North East.
What streets have the most expensive properties for sale in Fishguard North East?
The streets with the most expensive properties for sale in Fishguard North East are Tower Hill at an average of £392,200, Heol Caradog at an average of £381,250 and Windy Hall at an average of £360,000.
What streets have the most affordable properties for sale in Fishguard North East?
The streets with the most affordable properties for sale in Fishguard North East are Heol Glyndwr at an average of £111,666, Jubilee Terrace at an average of £115,250 and Hamilton Street at an average of £125,000.
Which train stations are available in or near Fishguard North East?
Some of the train stations available in or near Fishguard North East are Fishguard and Goodwick, Fishguard Harbour and Clarbeston Road.
Property Price Paid in Fishguard North East by Year
The average sold property price by year was:
| Year | Average Sold Price | Price Change |
Sold Properties
|
|---|---|---|---|
| 2025 | £265,291 | 22% |
23 Properties |
| 2024 | £205,843 | -27% |
28 Properties |
| 2023 | £261,853 | 10% |
31 Properties |
| 2022 | £234,370 | 2% |
43 Properties |
| 2021 | £229,397 | 21% |
44 Properties |
| 2020 | £181,260 | -14% |
25 Properties |
| 2019 | £206,297 | 16% |
42 Properties |
| 2018 | £172,406 | 6% |
32 Properties |
| 2017 | £162,250 | -12% |
38 Properties |
| 2016 | £181,584 | 3% |
29 Properties |
| 2015 | £176,855 | -3% |
28 Properties |
| 2014 | £182,437 | 4% |
16 Properties |
| 2013 | £175,780 | 0,2% |
23 Properties |
| 2012 | £175,416 | 10% |
25 Properties |
| 2011 | £158,031 | -11% |
22 Properties |
| 2010 | £176,117 | -6% |
17 Properties |
| 2009 | £186,074 | 4% |
37 Properties |
| 2008 | £178,100 | 2% |
30 Properties |
| 2007 | £174,781 | -7% |
37 Properties |
| 2006 | £187,813 | 9% |
33 Properties |
| 2005 | £171,630 | 11% |
36 Properties |
| 2004 | £153,372 | 22% |
31 Properties |
| 2003 | £119,426 | 19% |
39 Properties |
| 2002 | £97,077 | 11% |
49 Properties |
| 2001 | £86,119 | 23% |
34 Properties |
| 2000 | £66,571 | -3% |
38 Properties |
| 1999 | £68,851 | -10% |
29 Properties |
| 1998 | £75,394 | 23% |
34 Properties |
| 1997 | £58,382 | 26% |
31 Properties |
| 1996 | £43,291 | -19% |
24 Properties |
| 1995 | £51,487 | - |
31 Properties |
Property Price per Property Type in Fishguard North East
Here you can find historic sold price data in order to help with your property search.
The average Property Paid Price for specific property types in the last three years are:
| Property Type | Average Sold Price | Sold Properties |
|---|---|---|
| Semi Detached House | £228,810.00 | 29 Semi Detached Houses |
| Detached House | £313,827.00 | 47 Detached Houses |
| Terraced House | £181,995.00 | 44 Terraced Houses |
| Flat | £133,500.00 | 5 Flats |

