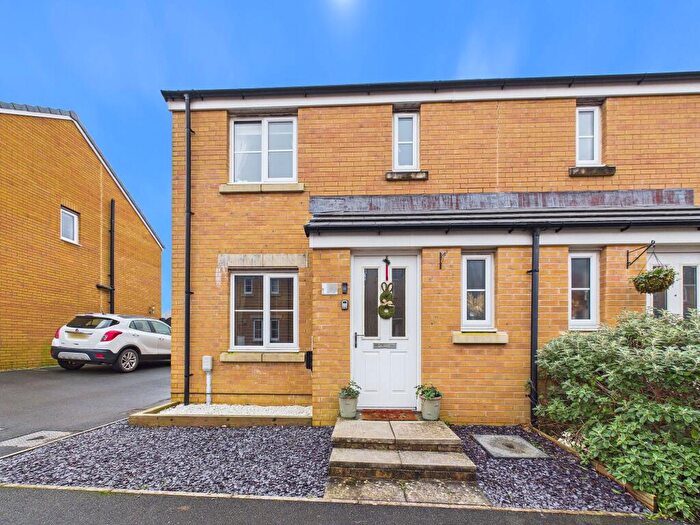
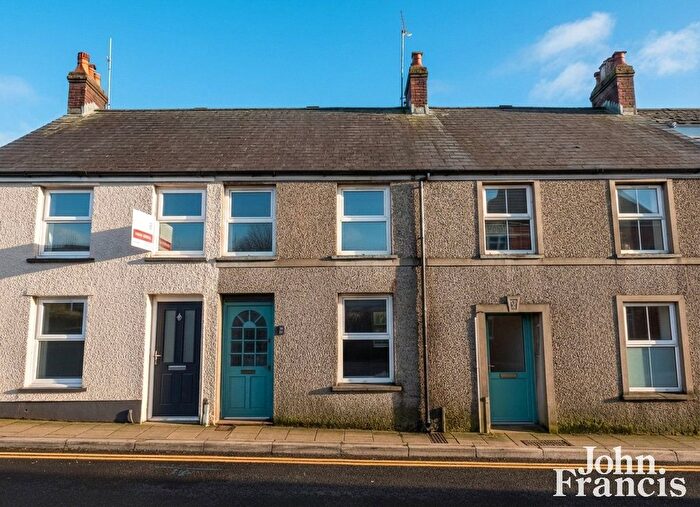
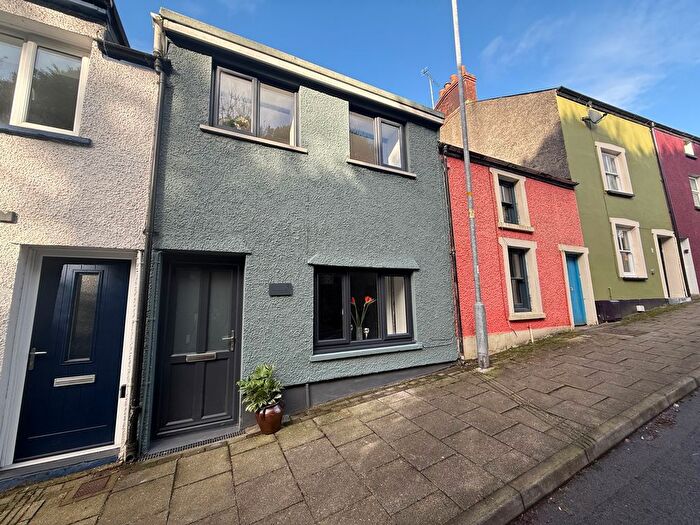
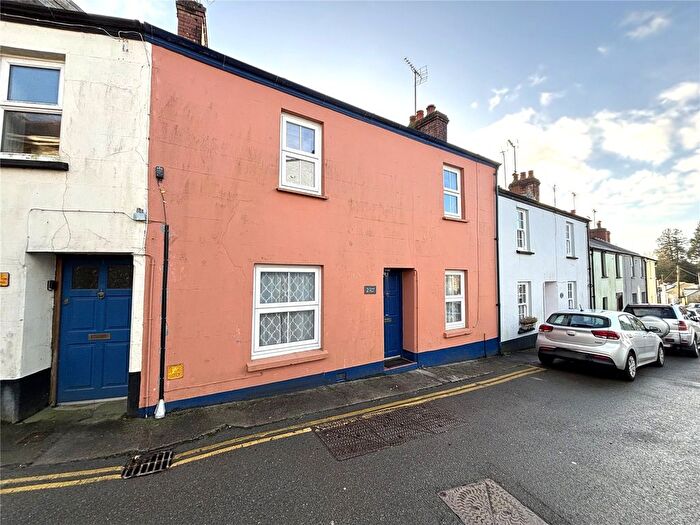
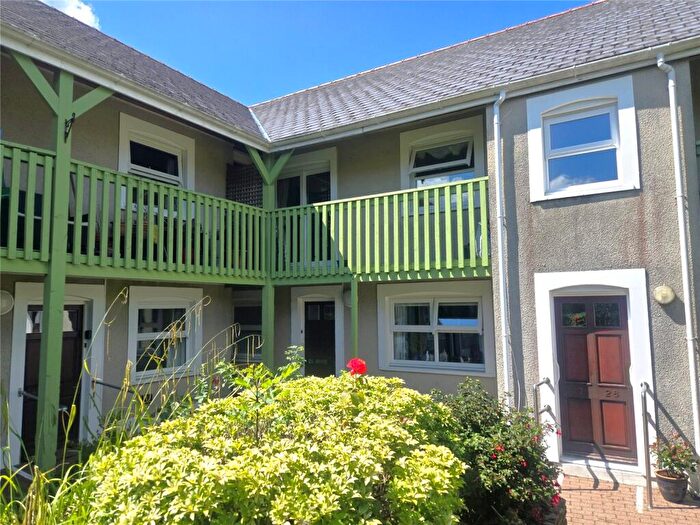
Houses for sale & to rent in Narberth, Narberth
House Prices in Narberth
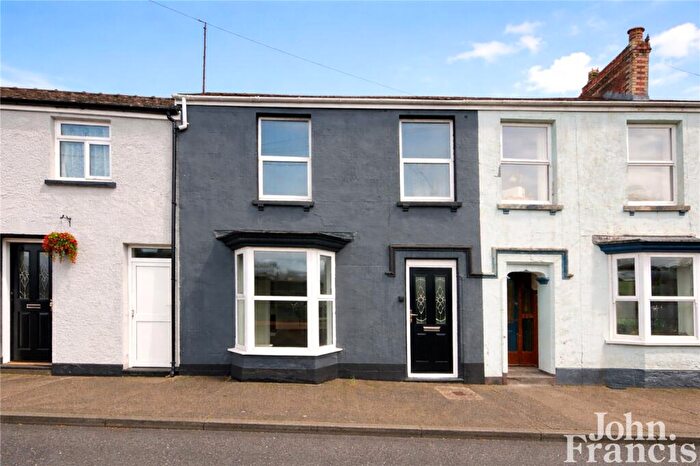
Properties in Narberth have an average house price of £212,699.00 and had 128 Property Transactions within the last 3 years¹.
Narberth is an area in Narberth, Sir Benfro - Pembrokeshire with 901 households², where the most expensive property was sold for £508,000.00.
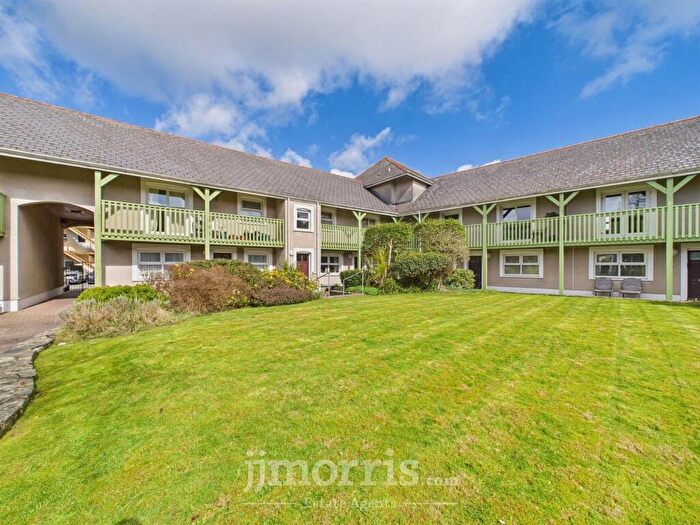
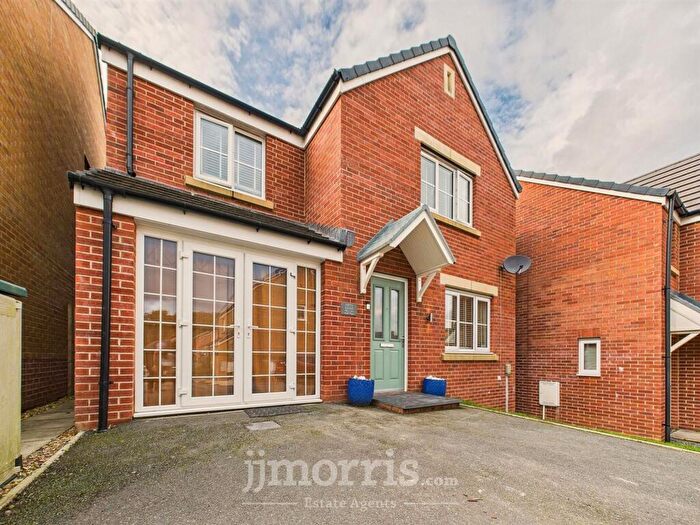
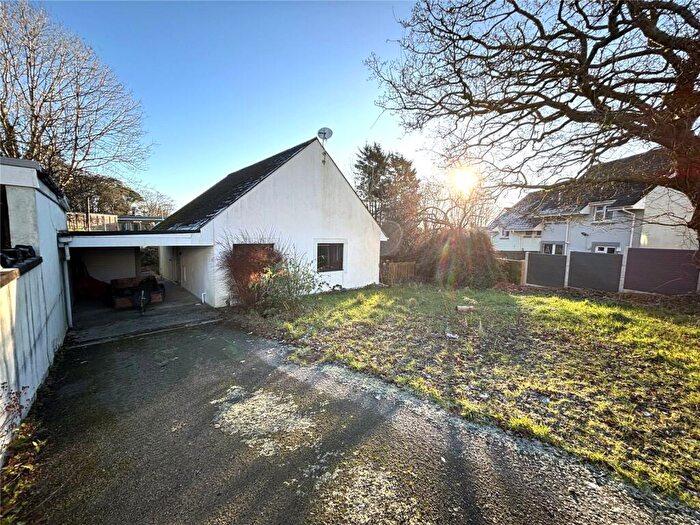
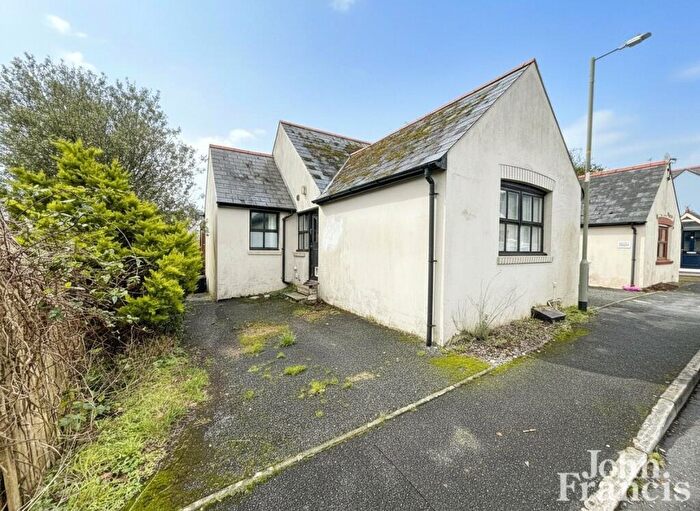
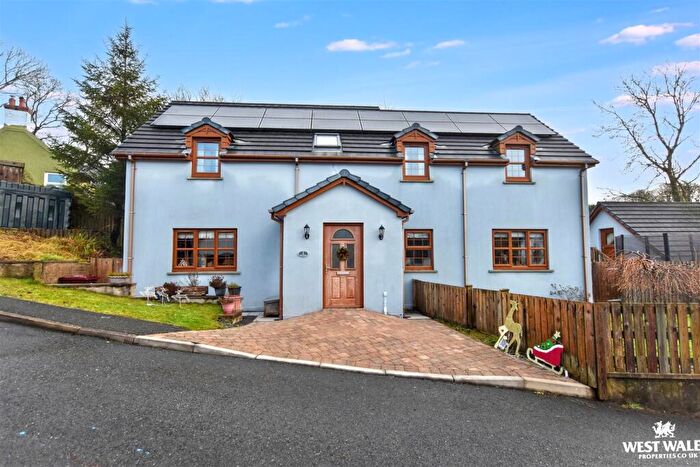
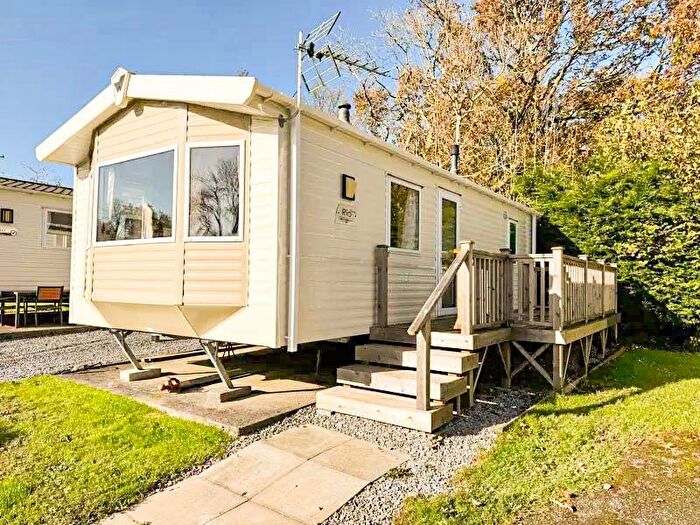
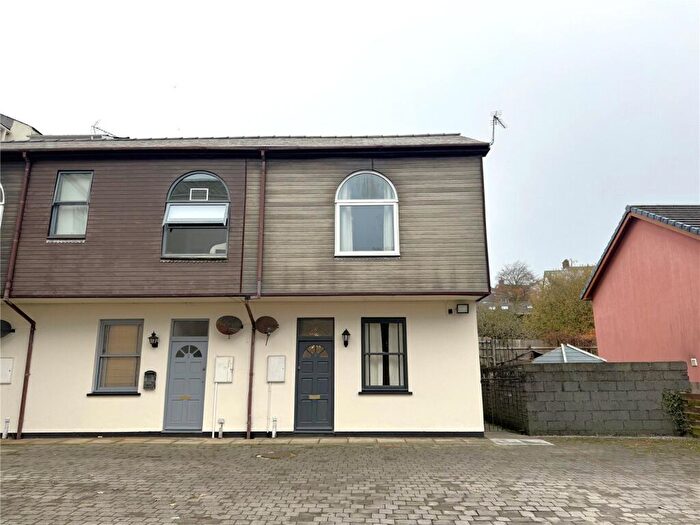
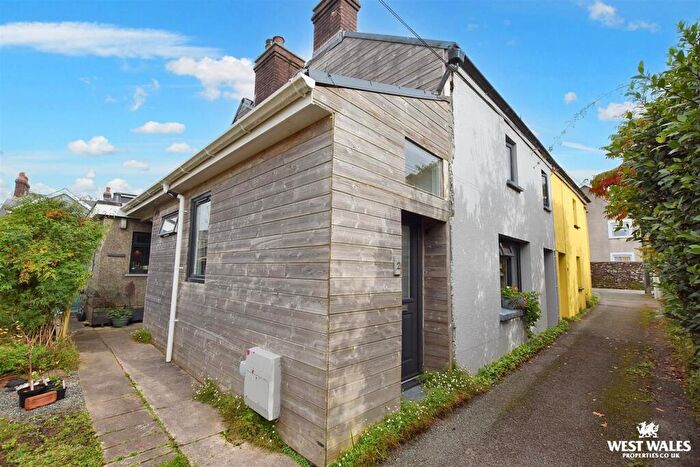
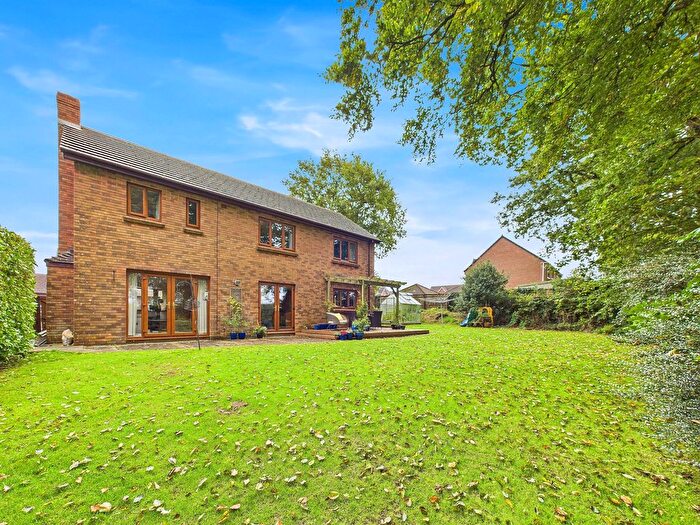
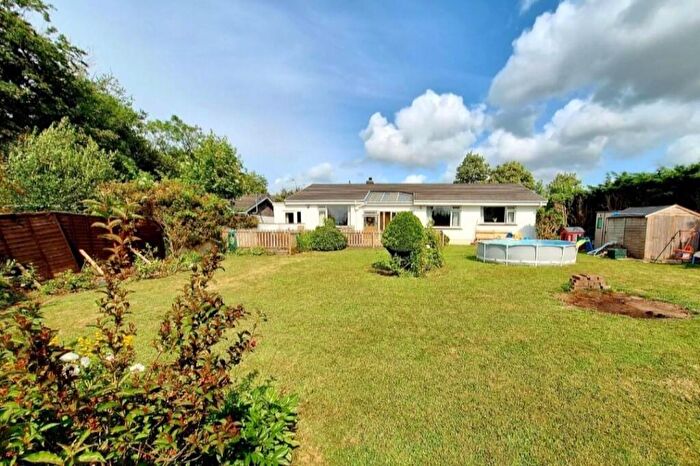
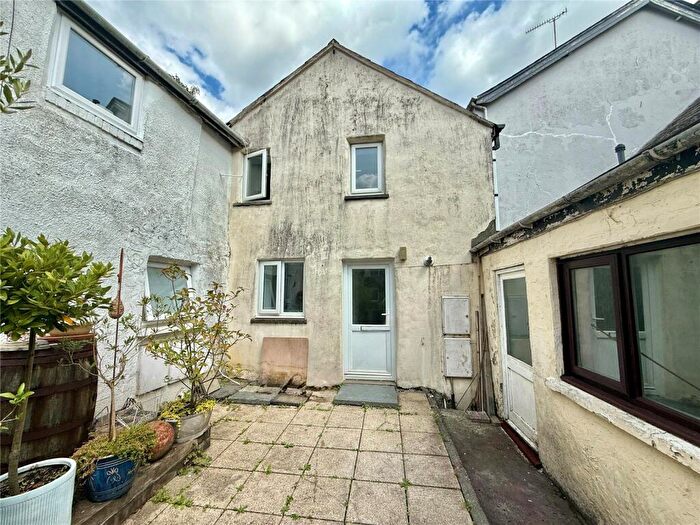
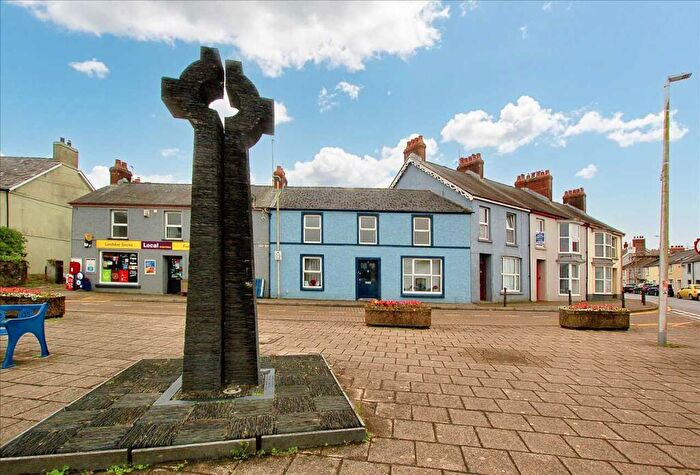
Properties for sale in Narberth
Roads and Postcodes in Narberth
Navigate through our locations to find the location of your next house in Narberth, Narberth for sale or to rent.
| Streets | Postcodes |
|---|---|
| Adams Drive | SA67 7AE |
| Back Lane | SA67 7BQ |
| Beechwood Place | SA67 7EE |
| Belmore Gardens | SA67 7AF |
| Bentley Villas | SA67 7EA |
| Bloomfield Gardens | SA67 7EZ |
| Bridge Hill | SA67 8QR SA67 8QX |
| Bridge Villas | SA67 8RB |
| Cae Tyddyn | SA67 7FG |
| Castle Street | SA67 7BD |
| Castle Terrace | SA67 7BB |
| Castlefield | SA67 8SW |
| Cawdor Court | SA67 7AZ |
| Chapelfield Gardens | SA67 7ED |
| Church Street | SA67 7BH |
| Coxhill | SA67 7UH |
| Coxhill Council Houses | SA67 7UJ |
| Croft Villas | SA67 7DY |
| Garfield Gardens | SA67 7UW |
| Green Gardens | SA67 7BE |
| Halkon Crescent | SA67 7EB |
| High Street | SA67 7AR SA67 7AS SA67 7AD |
| Highfield Park | SA67 7UN |
| Hill Park | SA67 7UL |
| Hillside Terrace | SA67 7AL |
| James John Close | SA67 7AY |
| James Street | SA67 7BZ |
| Jesse Road | SA67 7DH SA67 7DJ SA67 7DP |
| John Morgan Close | SA67 7FD |
| Kings Court | SA67 7AP |
| Landsker Lane | SA67 7EF |
| Maes Yr Odyn | SA67 7FH |
| Market Square | SA67 7AU |
| Market Street | SA67 7AX |
| Mill Farm Cottages | SA67 8QU |
| Mill Lane | SA67 8QS |
| Mill Lane Cottages | SA67 8QT |
| Moorfield Road | SA67 7AB SA67 7AQ SA67 7AG |
| Narberth Bridge Business Park | SA67 8RA |
| Nestor Square | SA67 7DG |
| Northfield Road | SA67 7AA SA67 7EP |
| Northmead | SA67 7DN |
| Old Keg Yard | SA67 7BA |
| Old Mart Ground | SA67 7BR |
| Parc Roberts | SA67 7AH |
| Picton Place | SA67 7BG |
| Picton Terrace | SA67 7AW |
| Queens Court | SA67 7AN |
| Redstone Court | SA67 7EU |
| Rhydfelin | SA67 8QW |
| Southmead | SA67 7DX |
| Spring Gardens | SA67 7BN SA67 7BT |
| Springfield Park | SA67 7DQ |
| St James Street | SA67 7BU SA67 7DA SA67 7DB SA67 7BY |
| Station Road | SA67 7DR SA67 7DT SA67 7FL |
| Sunnybank Gardens | SA67 7FF |
| Tabernacle Lane | SA67 7DE |
| Tabernacle Row | SA67 7DD |
| The Bridge | SA67 8QY SA67 8QZ |
| The Crescent | SA67 7DL |
| The Hawthorns | SA67 7UP |
| The Old School Estate | SA67 7DU |
| The Town Moor | SA67 7DF |
| Victoria Close | SA67 7DZ |
| Water Street | SA67 7AT |
| Wells Road Terrace | SA67 7AJ |
| Wesley Villas | SA67 7DS |
| Williams Court | SA67 7DW |
| SA67 7EN SA67 9AE SA67 9AN SA67 9AP SA67 9AQ SA67 9AR SA67 9AT SA67 9AU SA67 9AW SA67 9AX SA67 9AY |
Transport near Narberth
- FAQ
- Price Paid By Year
- Property Type Price
Frequently asked questions about Narberth
What is the average price for a property for sale in Narberth?
The average price for a property for sale in Narberth is £212,699. This amount is 23% lower than the average price in Narberth. There are 443 property listings for sale in Narberth.
What streets have the most expensive properties for sale in Narberth?
The streets with the most expensive properties for sale in Narberth are Castlefield at an average of £504,500, Beechwood Place at an average of £475,000 and Bloomfield Gardens at an average of £391,497.
What streets have the most affordable properties for sale in Narberth?
The streets with the most affordable properties for sale in Narberth are Wells Road Terrace at an average of £54,000, Mill Farm Cottages at an average of £70,000 and Picton Terrace at an average of £86,375.
Which train stations are available in or near Narberth?
Some of the train stations available in or near Narberth are Narberth, Clunderwen and Kilgetty.
Property Price Paid in Narberth by Year
The average sold property price by year was:
| Year | Average Sold Price | Price Change |
Sold Properties
|
|---|---|---|---|
| 2025 | £205,426 | -13% |
41 Properties |
| 2024 | £231,294 | 12% |
39 Properties |
| 2023 | £203,803 | -5% |
48 Properties |
| 2022 | £214,343 | 8% |
44 Properties |
| 2021 | £197,640 | 8% |
60 Properties |
| 2020 | £181,530 | -1% |
69 Properties |
| 2019 | £183,181 | 2% |
77 Properties |
| 2018 | £179,049 | 7% |
78 Properties |
| 2017 | £166,083 | 0,2% |
47 Properties |
| 2016 | £165,708 | -1% |
39 Properties |
| 2015 | £167,541 | 13% |
36 Properties |
| 2014 | £146,290 | -26% |
41 Properties |
| 2013 | £184,609 | 9% |
50 Properties |
| 2012 | £167,204 | 3% |
42 Properties |
| 2011 | £162,309 | 16% |
25 Properties |
| 2010 | £135,796 | -15% |
15 Properties |
| 2009 | £155,862 | -15% |
29 Properties |
| 2008 | £178,542 | 3% |
30 Properties |
| 2007 | £173,330 | -23% |
36 Properties |
| 2006 | £213,429 | 30% |
47 Properties |
| 2005 | £150,252 | 11% |
39 Properties |
| 2004 | £133,819 | 26% |
51 Properties |
| 2003 | £98,531 | 13% |
48 Properties |
| 2002 | £85,703 | 23% |
62 Properties |
| 2001 | £66,174 | 9% |
64 Properties |
| 2000 | £59,910 | 27% |
53 Properties |
| 1999 | £43,443 | -14% |
41 Properties |
| 1998 | £49,320 | 12% |
47 Properties |
| 1997 | £43,617 | 3% |
44 Properties |
| 1996 | £42,380 | 8% |
35 Properties |
| 1995 | £39,118 | - |
25 Properties |
Property Price per Property Type in Narberth
Here you can find historic sold price data in order to help with your property search.
The average Property Paid Price for specific property types in the last three years are:
| Property Type | Average Sold Price | Sold Properties |
|---|---|---|
| Semi Detached House | £209,117.00 | 34 Semi Detached Houses |
| Detached House | £318,679.00 | 34 Detached Houses |
| Terraced House | £165,343.00 | 48 Terraced Houses |
| Flat | £111,995.00 | 12 Flats |

