
Houses for sale & to rent in Lledrod, Aberystwyth
House Prices in Lledrod
Properties in Lledrod have an average house price of £288k and had 15 Property Transactions within the last 3 years¹.
Lledrod is an area in Aberystwyth, Sir Ceredigion - Ceredigion with 307 households², where the most expensive property was sold for £924k.
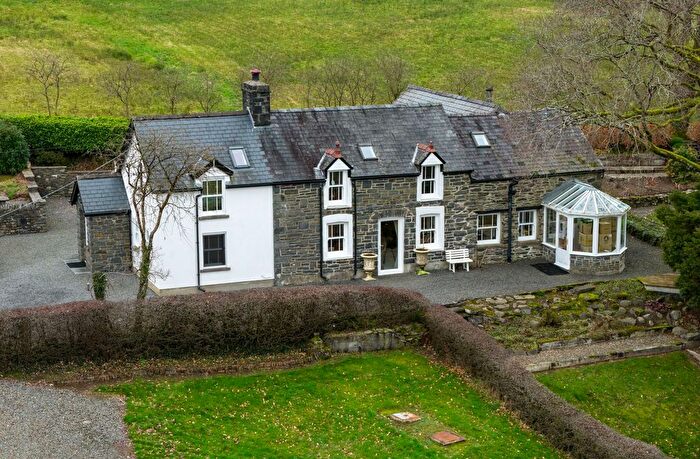
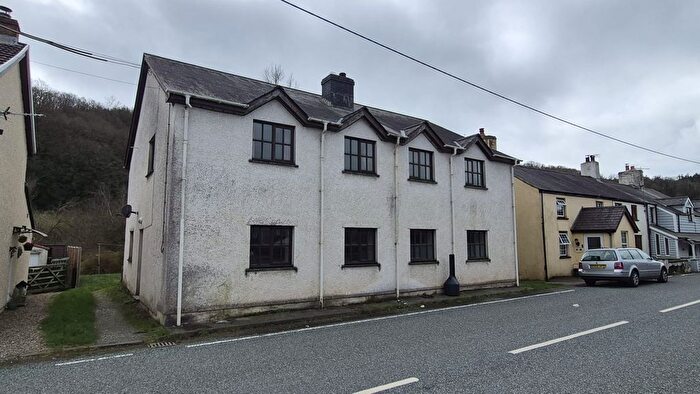
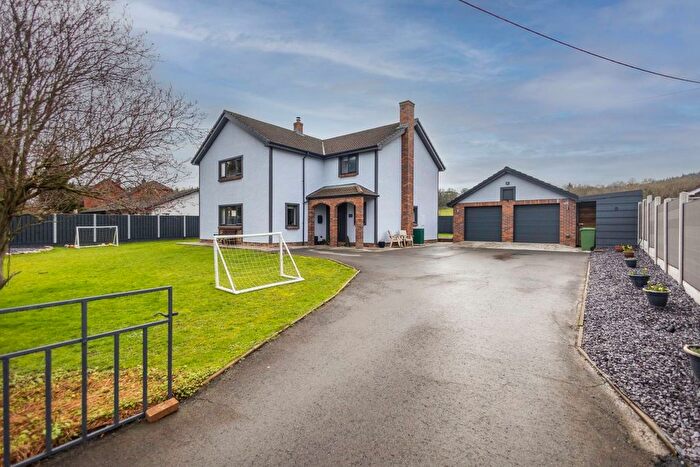
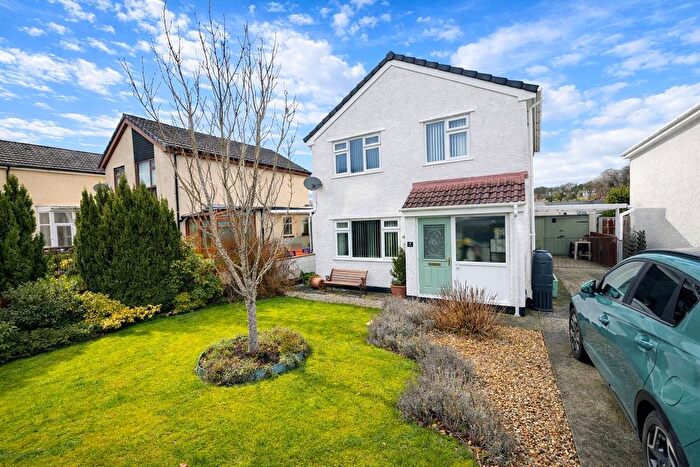
Properties for sale in Lledrod
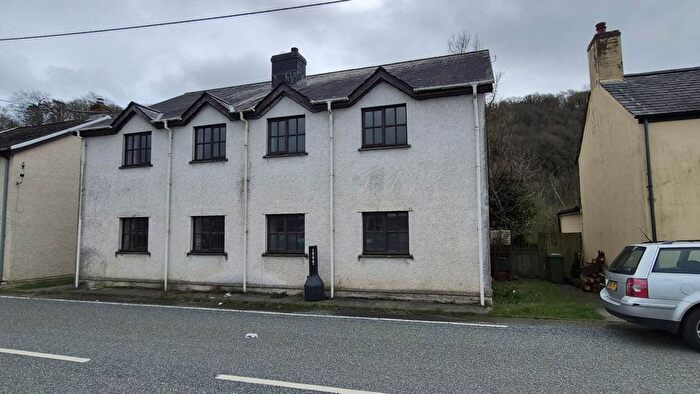
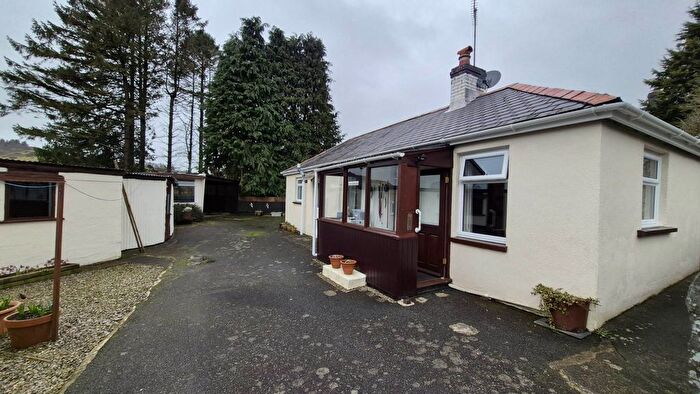
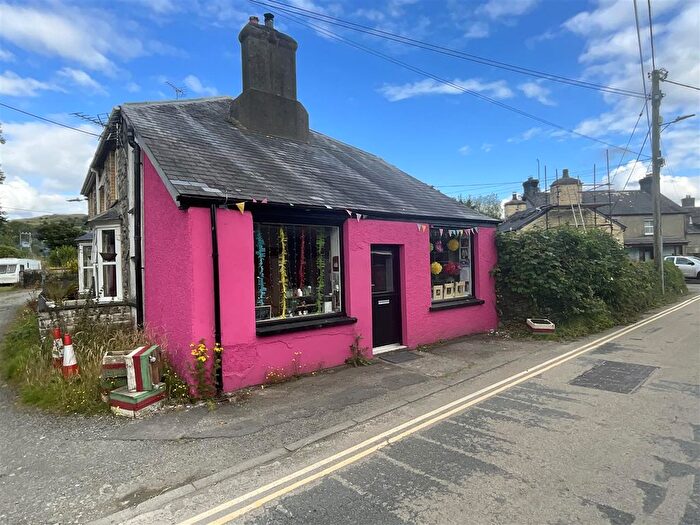
![]()
If you are looking to sell your house, let it out, or receive a property valuation, an expert can help you.
Click the button below to get started.
Previously listed properties in Lledrod
Roads and Postcodes in Lledrod
Navigate through our locations to find the location of your next house in Lledrod, Aberystwyth for sale or to rent.
| Streets | Postcodes |
|---|---|
| Bryn Wyre | SY23 4JW |
| Bwlch Y Graig | SY25 6BU |
| Caer Ysgol | SY23 4AJ |
| Clos Y Llan | SY23 4HL |
| Cwrt Fryers | SY25 6AU |
| Ger Y Llan | SY25 6AR |
| Min Y Rhos | SY23 4TH |
| Pencreigiau | SY25 6EN |
| Wesley Terrace | SY25 6DJ |
| SY23 4HZ SY23 4JB SY23 4JD SY23 4JE SY23 4JF SY23 4JG SY23 4JH SY23 4JQ SY23 4SH SY23 4TA SY23 4TB SY23 4TD SY23 4TF SY23 4TG SY23 4TJ SY23 4TL SY23 4TP SY23 4TQ SY23 4TR SY23 4TS SY23 4TT SY23 4TW SY23 4HX SY23 4HY SY23 4JA SY23 4TE SY25 6AF SY25 6AJ SY25 6AQ SY25 6BA SY25 6BJ SY25 6BT SY25 6ES SY25 6LS |
Transport near Lledrod
-
 Aberystwyth Station
 -
Borth Station
-
Penhelig Station
-
Aberdovey Station
-
Sugar Loaf Station
-
Cynghordy Station
-
Llanwrtyd Station
-
Dovey Junction Station
- FAQ
- Price Paid By Year
- Property Type Price
Frequently asked questions about Lledrod
What is the average price for a property for sale in Lledrod?
The average price for a property for sale in Lledrod is £287,939. This amount is 18% higher than the average price in Aberystwyth. There are 258 property listings for sale in Lledrod.
What streets have the most expensive properties for sale in Lledrod?
The streets with the most expensive properties for sale in Lledrod are Clos Y Llan at an average of £279,750 and Pencreigiau at an average of £165,000.
What streets have the most affordable properties for sale in Lledrod?
The street with the most affordable properties for sale in Lledrod is Wesley Terrace at an average of £128,000.
Which train stations are available in or near Lledrod?
Some of the train stations available in or near Lledrod are Aberystwyth, Borth and Penhelig.
Property Price Paid in Lledrod by Year
The average sold property price by year was:
| Year | Average Sold Price | Price Change |
Sold Properties
|
|---|---|---|---|
| 2025 | £245,000 | -85% |
5 Properties |
| 2024 | £452,865 | 45% |
3 Properties |
| 2023 | £247,928 | -13% |
7 Properties |
| 2022 | £280,300 | 5% |
5 Properties |
| 2021 | £265,041 | 4% |
12 Properties |
| 2020 | £253,562 | 0,5% |
8 Properties |
| 2019 | £252,416 | 29% |
6 Properties |
| 2018 | £178,500 | -10% |
8 Properties |
| 2017 | £195,750 | 10% |
10 Properties |
| 2016 | £175,363 | 1% |
11 Properties |
| 2015 | £173,000 | -12% |
5 Properties |
| 2014 | £193,833 | -7% |
9 Properties |
| 2013 | £208,333 | -25% |
3 Properties |
| 2012 | £259,400 | 20% |
5 Properties |
| 2011 | £208,612 | -1% |
4 Properties |
| 2010 | £211,062 | -20% |
8 Properties |
| 2009 | £253,222 | 5% |
9 Properties |
| 2008 | £241,166 | 19% |
3 Properties |
| 2007 | £195,414 | 5% |
7 Properties |
| 2006 | £185,540 | 2% |
11 Properties |
| 2005 | £181,000 | -5% |
5 Properties |
| 2004 | £189,862 | 49% |
4 Properties |
| 2003 | £97,120 | 14% |
13 Properties |
| 2002 | £83,124 | -29% |
12 Properties |
| 2001 | £107,421 | 39% |
12 Properties |
| 2000 | £65,993 | -1% |
8 Properties |
| 1999 | £66,490 | -33% |
5 Properties |
| 1998 | £88,600 | 6% |
5 Properties |
| 1997 | £83,375 | 51% |
4 Properties |
| 1996 | £41,000 | - |
3 Properties |
| 1995 | £41,000 | - |
1 Property |
Property Price per Property Type in Lledrod
Here you can find historic sold price data in order to help with your property search.
The average Property Paid Price for specific property types in the last three years are:
| Property Type | Average Sold Price | Sold Properties |
|---|---|---|
| Semi Detached House | £189,000.00 | 3 Semi Detached Houses |
| Detached House | £345,909.00 | 10 Detached Houses |
| Terraced House | £146,500.00 | 2 Terraced Houses |