
Houses for sale & to rent in Cardigan, Sir Ceredigion - Ceredigion
House Prices in Cardigan
Properties in Cardigan have an average house price of £282k and had 344 Property Transactions within the last 3 years.¹
Cardigan is an area in Sir Ceredigion - Ceredigion with 4,495 households², where the most expensive property was sold for £1.2M.
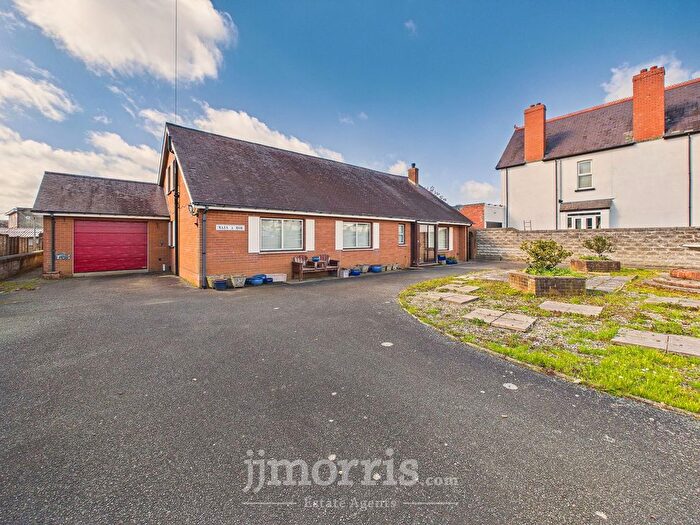
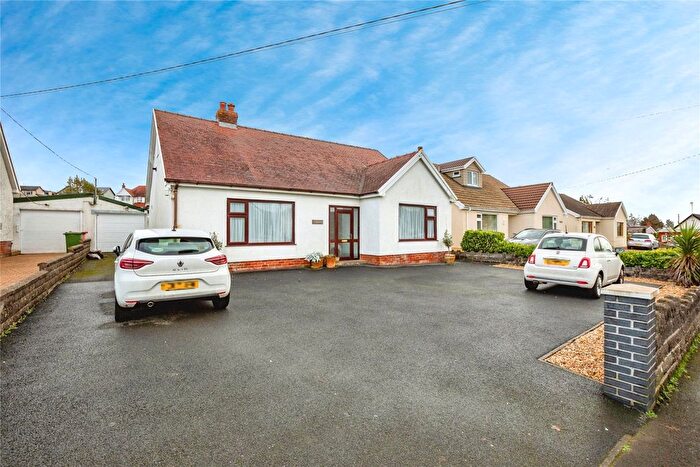
Properties for sale in Cardigan
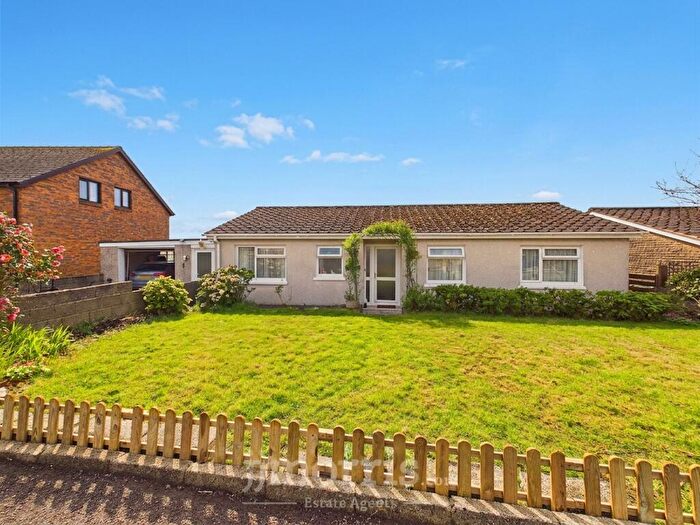

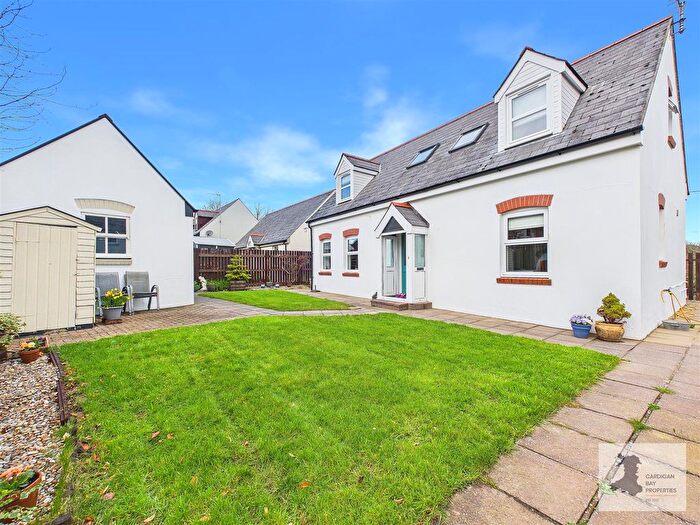
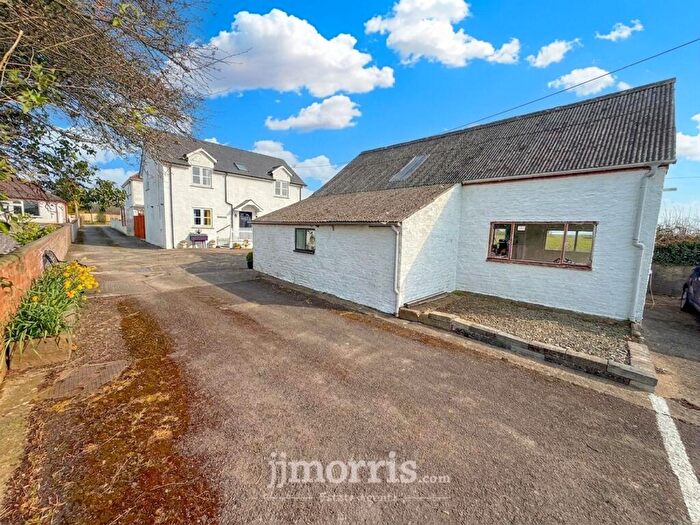


![]()
If you are looking to sell your house, let it out, or receive a property valuation, an expert can help you.
Click the button below to get started.


Neighbourhoods in Cardigan
Navigate through our locations to find the location of your next house in Cardigan, Sir Ceredigion - Ceredigion for sale or to rent.
Transport in Cardigan
Please see below transportation links in this area:

- FAQ
- Price Paid By Year
- Property Type Price
Frequently asked questions about Cardigan
What is the average price for a property for sale in Cardigan?
The average price for a property for sale in Cardigan is £281,827. This amount is 10% higher than the average price in Sir Ceredigion - Ceredigion. There are 1,968 property listings for sale in Cardigan.
What locations have the most expensive properties for sale in Cardigan?
The locations with the most expensive properties for sale in Cardigan are Penbryn at an average of £506,308, Beulah at an average of £329,661 and Pen-parc at an average of £305,002.
What locations have the most affordable properties for sale in Cardigan?
The locations with the most affordable properties for sale in Cardigan are Aberteifi/cardigan-teifi at an average of £180,671, Aberteifi/cardigan-rhyd-y-fuwch at an average of £211,502 and Aberteifi/cardigan-mwldan at an average of £284,540.
Which train stations are available in or near Cardigan?
Some of the train stations available in or near Cardigan are Fishguard Harbour, Fishguard and Goodwick and Clunderwen.
Property Price Paid in Cardigan by Year
The average sold property price by year was:
| Year | Average Sold Price | Price Change |
Sold Properties
|
|---|---|---|---|
| 2026 | £244,500 | -11% |
4 Properties |
| 2025 | £270,638 | -2% |
101 Properties |
| 2024 | £276,928 | -7% |
121 Properties |
| 2023 | £297,694 | 4% |
118 Properties |
| 2022 | £287,018 | 5% |
144 Properties |
| 2021 | £272,178 | 19% |
165 Properties |
| 2020 | £220,847 | 9% |
131 Properties |
| 2019 | £200,608 | 3% |
149 Properties |
| 2018 | £193,815 | 0,4% |
173 Properties |
| 2017 | £193,042 | -2% |
159 Properties |
| 2016 | £196,136 | 12% |
123 Properties |
| 2015 | £172,248 | -0,3% |
159 Properties |
| 2014 | £172,711 | 4% |
158 Properties |
| 2013 | £165,334 | -4% |
147 Properties |
| 2012 | £171,729 | -4% |
134 Properties |
| 2011 | £177,749 | -1% |
104 Properties |
| 2010 | £180,141 | 10% |
105 Properties |
| 2009 | £161,450 | -3% |
78 Properties |
| 2008 | £165,796 | -15% |
95 Properties |
| 2007 | £190,629 | 5% |
161 Properties |
| 2006 | £181,602 | 15% |
168 Properties |
| 2005 | £154,967 | 6% |
145 Properties |
| 2004 | £145,307 | 17% |
165 Properties |
| 2003 | £120,377 | 22% |
196 Properties |
| 2002 | £93,730 | 23% |
195 Properties |
| 2001 | £72,199 | 6% |
199 Properties |
| 2000 | £67,867 | 11% |
152 Properties |
| 1999 | £60,301 | 1% |
181 Properties |
| 1998 | £59,540 | 15% |
132 Properties |
| 1997 | £50,578 | -1% |
135 Properties |
| 1996 | £50,885 | 6% |
114 Properties |
| 1995 | £47,704 | - |
76 Properties |
Property Price per Property Type in Cardigan
Here you can find historic sold price data in order to help with your property search.
The average Property Paid Price for specific property types in the last three years are:
| Property Type | Average Sold Price | Sold Properties |
|---|---|---|
| Semi Detached House | £229,055.00 | 87 Semi Detached Houses |
| Detached House | £355,401.00 | 176 Detached Houses |
| Terraced House | £181,779.00 | 74 Terraced Houses |
| Flat | £145,500.00 | 7 Flats |