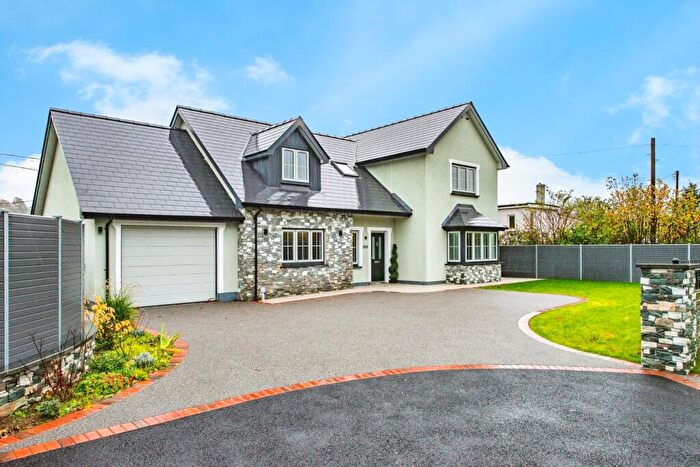
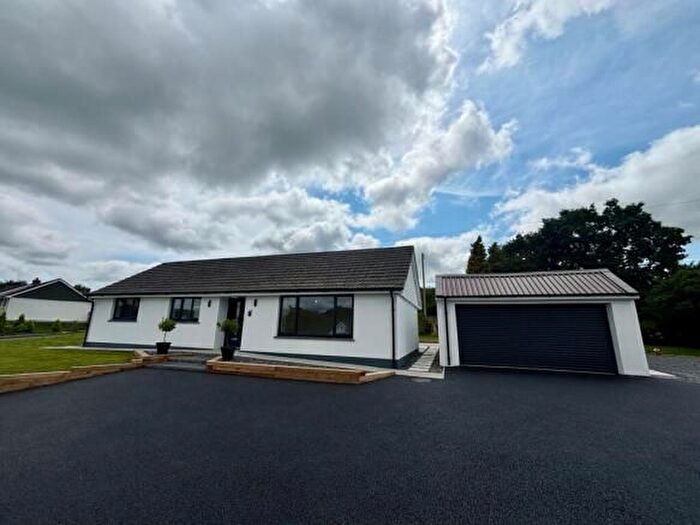
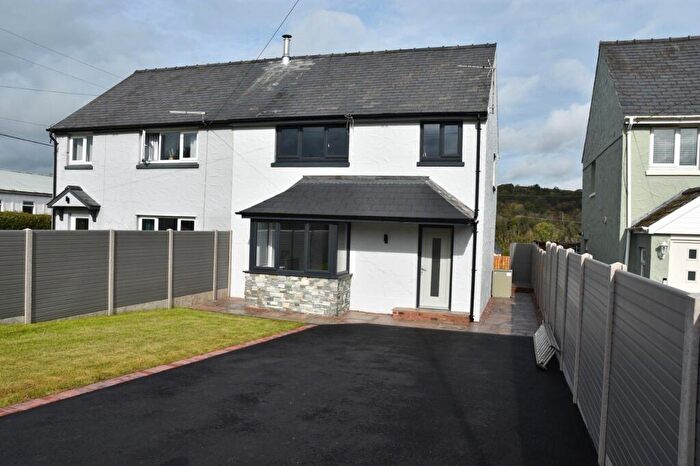
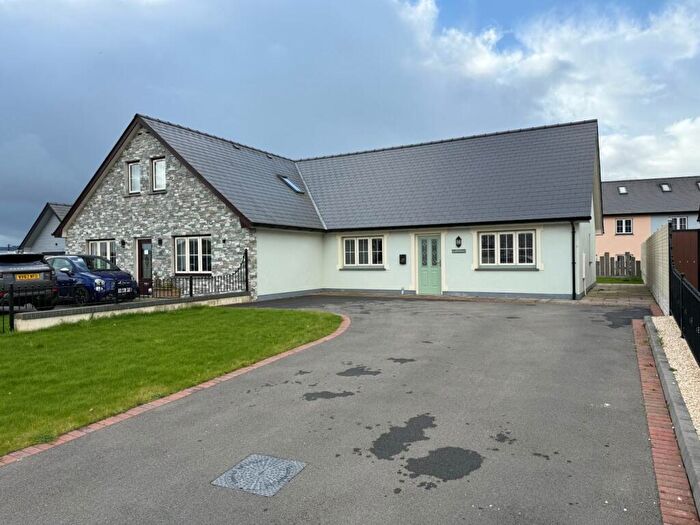
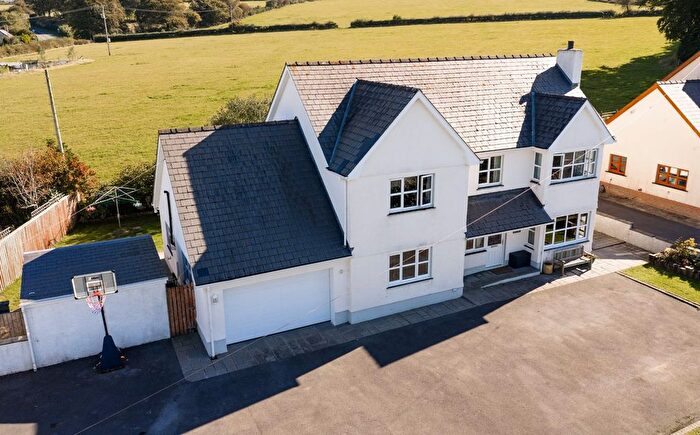
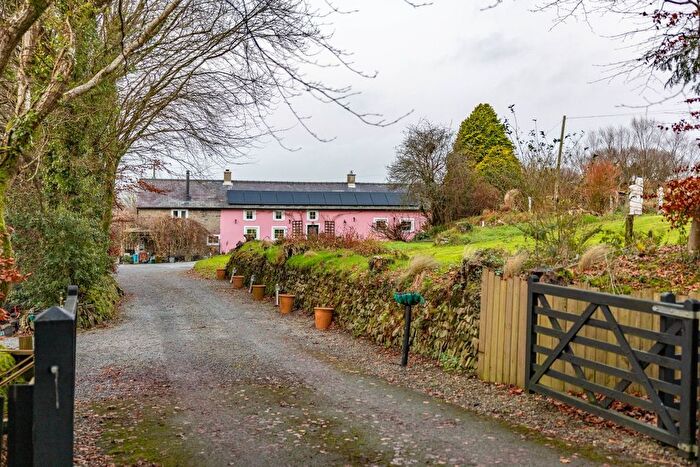
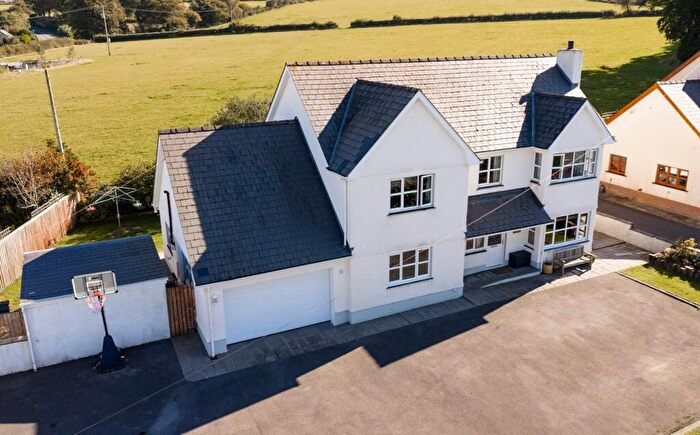
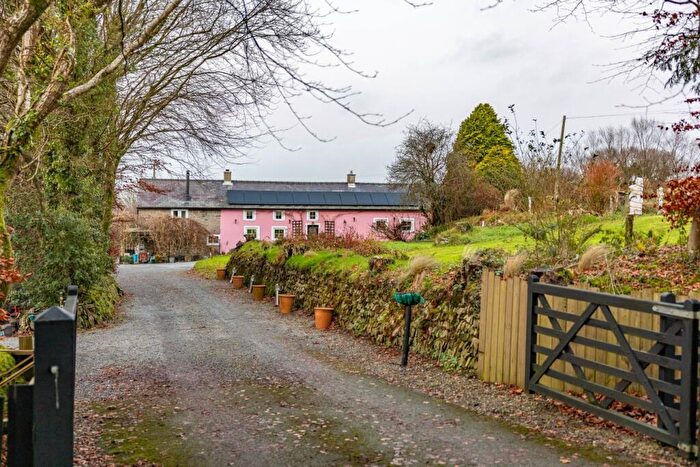
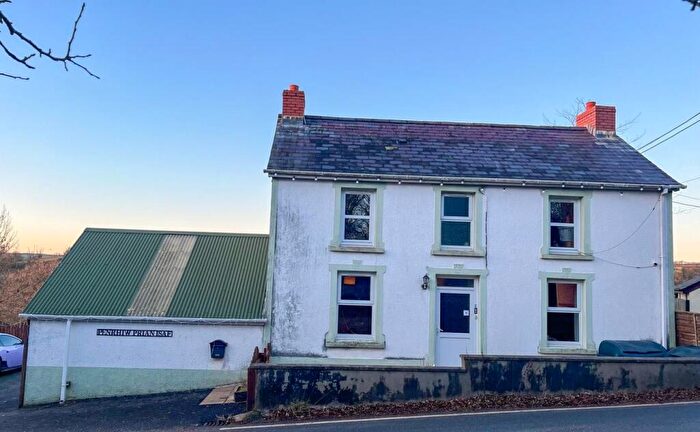
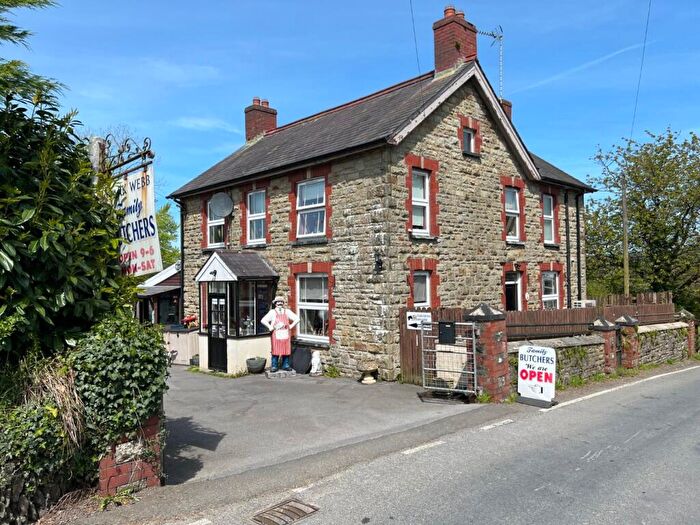
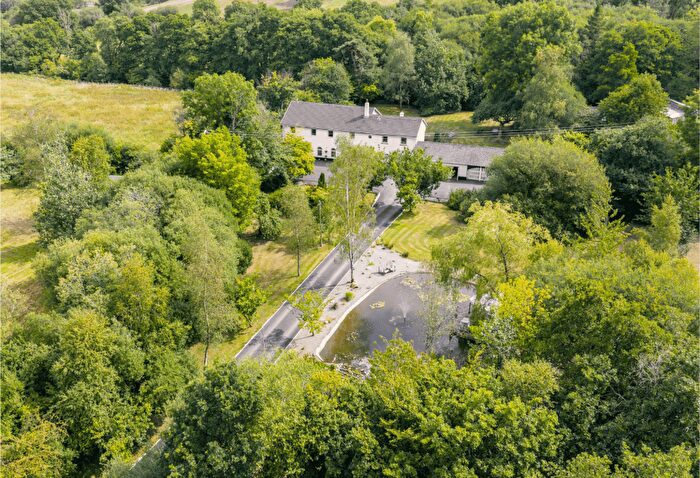
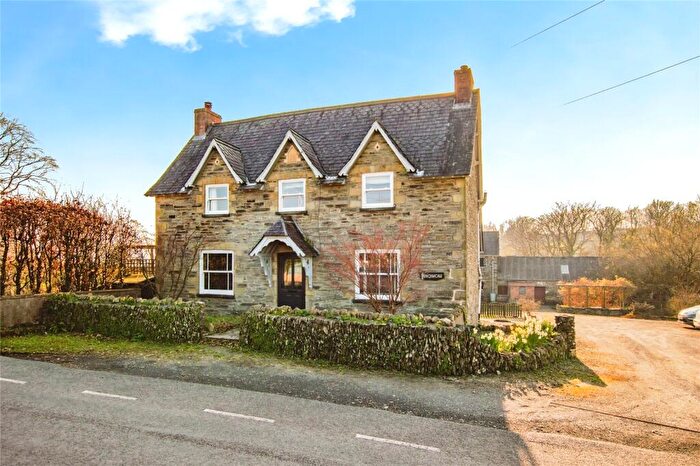
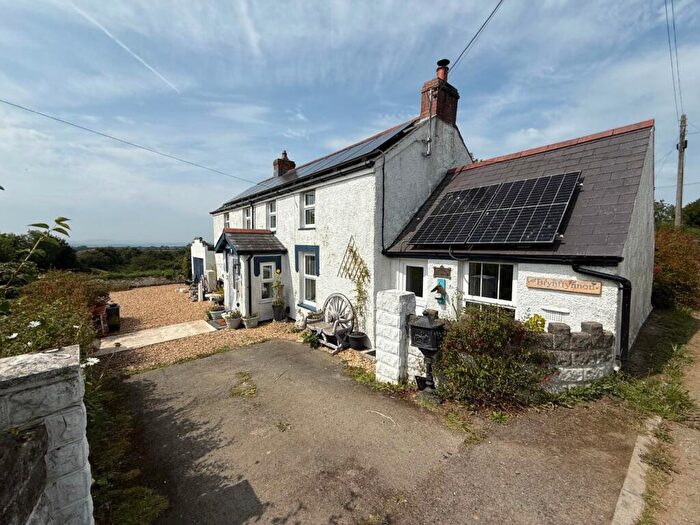
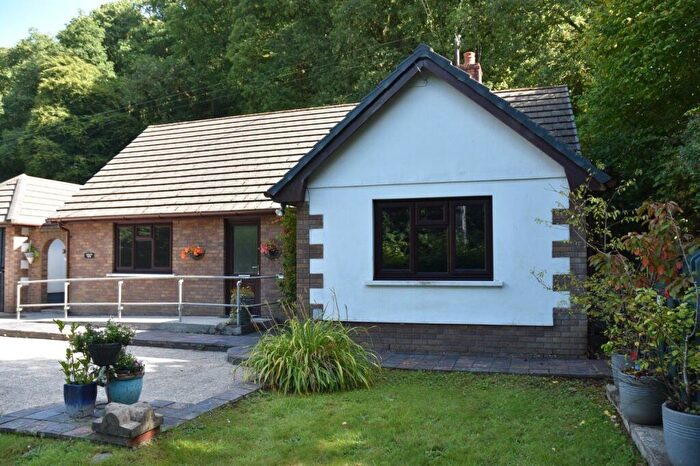
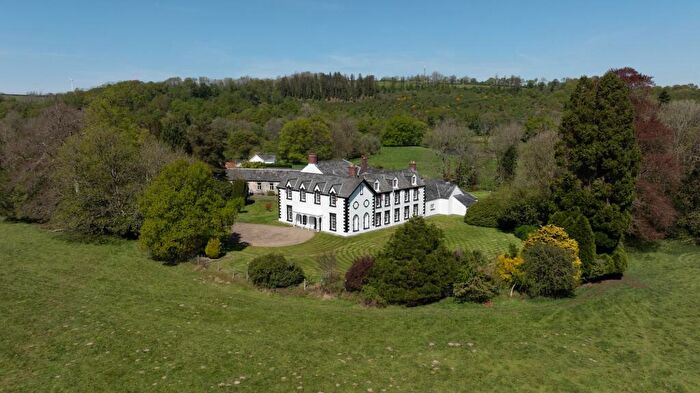
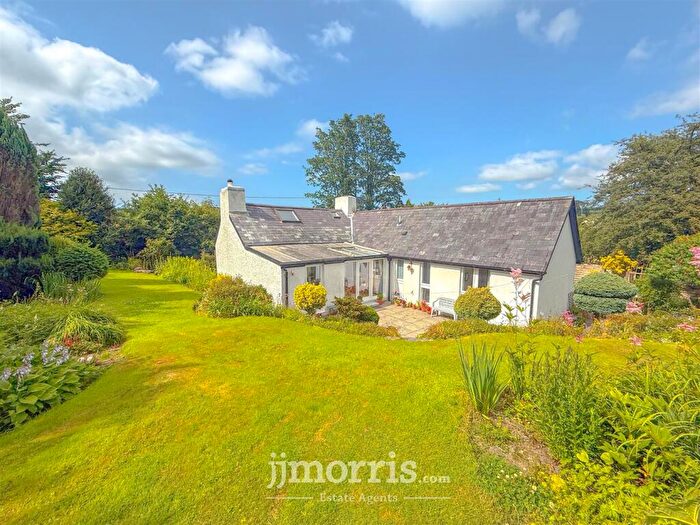
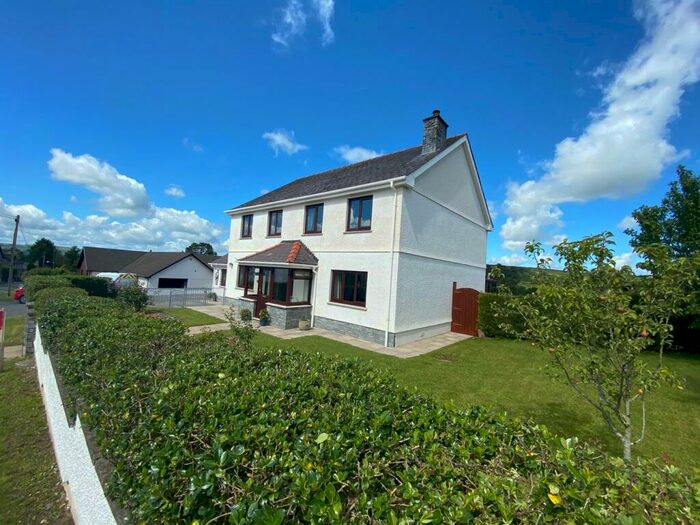
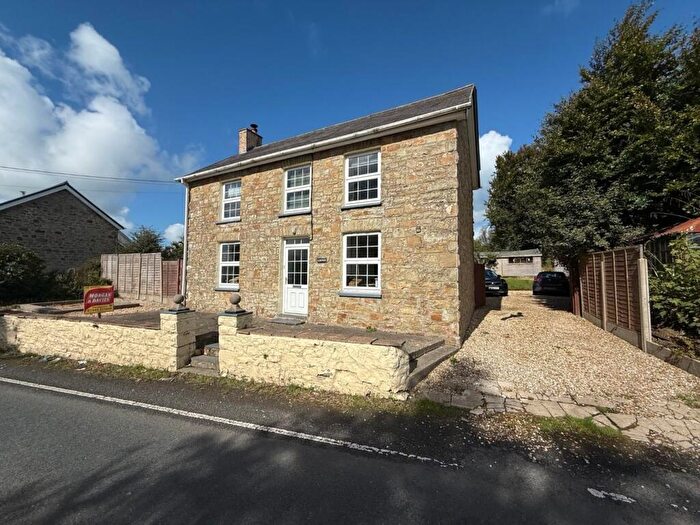
Houses for sale & to rent in Llandyfriog, Llandysul
House Prices in Llandyfriog
Properties in Llandyfriog have an average house price of £283,043.00 and had 50 Property Transactions within the last 3 years¹.
Llandyfriog is an area in Llandysul, Sir Ceredigion - Ceredigion with 393 households², where the most expensive property was sold for £575,126.00.
Properties for sale in Llandyfriog
Roads and Postcodes in Llandyfriog
Navigate through our locations to find the location of your next house in Llandyfriog, Llandysul for sale or to rent.
| Streets | Postcodes |
|---|---|
| Aberbanc | SA44 5NP |
| Bro Dewi | SA44 5TL |
| Cae Rwgan | SA44 5NQ |
| Fron | SA44 5BP |
| Heoly Bedw | SA44 5TJ |
| Industrial Estate | SA44 5TE |
| Lan Cottages | SA44 5TN |
| Panteg Cross | SA44 4SP SA44 4SR |
| Railway Terrace | SA44 5TH |
| Tremyfoel | SA44 5NN |
| SA44 4HX SA44 4HY SA44 4JB SA44 5BE SA44 5BH SA44 5BJ SA44 5BN SA44 5BQ SA44 5BS SA44 5LL SA44 5NG SA44 5NH SA44 5NJ SA44 5NL SA44 5NR SA44 5NS SA44 5NT SA44 5NU SA44 5NW SA44 5NX SA44 5NY SA44 5NZ SA44 5TD SA44 5TP SA44 5TS SA44 5TT SA44 5TY SA44 5UB SA44 4HZ SA44 4JA SA44 5BL SA44 5BW SA44 5LJ SA44 5TR SA44 5TU SA44 5TX SA44 5AN |
Transport near Llandyfriog
- FAQ
- Price Paid By Year
- Property Type Price
Frequently asked questions about Llandyfriog
What is the average price for a property for sale in Llandyfriog?
The average price for a property for sale in Llandyfriog is £283,043. This amount is 0.82% lower than the average price in Llandysul. There are 457 property listings for sale in Llandyfriog.
What streets have the most expensive properties for sale in Llandyfriog?
The streets with the most expensive properties for sale in Llandyfriog are Tremyfoel at an average of £216,125, Railway Terrace at an average of £213,750 and Lan Cottages at an average of £209,333.
What streets have the most affordable properties for sale in Llandyfriog?
The streets with the most affordable properties for sale in Llandyfriog are Bro Dewi at an average of £100,000 and Aberbanc at an average of £206,250.
Which train stations are available in or near Llandyfriog?
Some of the train stations available in or near Llandyfriog are Carmarthen, Whitland and Ferryside.
Property Price Paid in Llandyfriog by Year
The average sold property price by year was:
| Year | Average Sold Price | Price Change |
Sold Properties
|
|---|---|---|---|
| 2025 | £204,416 | -20% |
6 Properties |
| 2024 | £245,750 | -8% |
16 Properties |
| 2023 | £264,357 | -43% |
14 Properties |
| 2022 | £378,049 | 46% |
14 Properties |
| 2021 | £203,618 | -14% |
17 Properties |
| 2020 | £232,458 | 11% |
12 Properties |
| 2019 | £207,733 | 6% |
15 Properties |
| 2018 | £195,965 | 3% |
13 Properties |
| 2017 | £189,800 | -0,5% |
15 Properties |
| 2016 | £190,678 | -2% |
14 Properties |
| 2015 | £195,191 | -0,4% |
17 Properties |
| 2014 | £195,888 | 27% |
9 Properties |
| 2013 | £142,035 | 16% |
7 Properties |
| 2012 | £120,000 | -46% |
2 Properties |
| 2011 | £175,250 | 7% |
8 Properties |
| 2010 | £163,068 | 29% |
11 Properties |
| 2009 | £115,564 | -69% |
7 Properties |
| 2008 | £195,075 | -3% |
10 Properties |
| 2007 | £201,137 | 22% |
12 Properties |
| 2006 | £156,884 | -8% |
11 Properties |
| 2005 | £169,147 | 27% |
9 Properties |
| 2004 | £123,750 | -12% |
8 Properties |
| 2003 | £138,158 | 49% |
21 Properties |
| 2002 | £70,117 | -44% |
21 Properties |
| 2001 | £101,142 | 37% |
14 Properties |
| 2000 | £63,232 | -12% |
17 Properties |
| 1999 | £70,669 | 21% |
13 Properties |
| 1998 | £55,603 | -16% |
14 Properties |
| 1997 | £64,750 | 34% |
6 Properties |
| 1996 | £42,613 | 0,3% |
8 Properties |
| 1995 | £42,493 | - |
8 Properties |
Property Price per Property Type in Llandyfriog
Here you can find historic sold price data in order to help with your property search.
The average Property Paid Price for specific property types in the last three years are:
| Property Type | Average Sold Price | Sold Properties |
|---|---|---|
| Semi Detached House | £234,134.00 | 17 Semi Detached Houses |
| Detached House | £358,183.00 | 24 Detached Houses |
| Terraced House | £175,055.00 | 9 Terraced Houses |

