
Houses for sale & to rent in SA44 4DD, Marble Terrace, Llandysul Town, Llandysul
House Prices in SA44 4DD, Marble Terrace, Llandysul Town
Properties in SA44 4DD have no sales history available within the last 3 years. SA44 4DD is a postcode in Marble Terrace located in Llandysul Town, an area in Llandysul, Sir Ceredigion - Ceredigion, with 2 households².
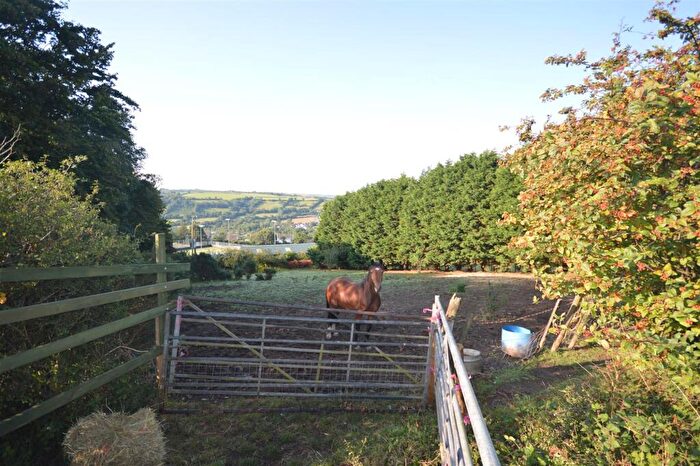
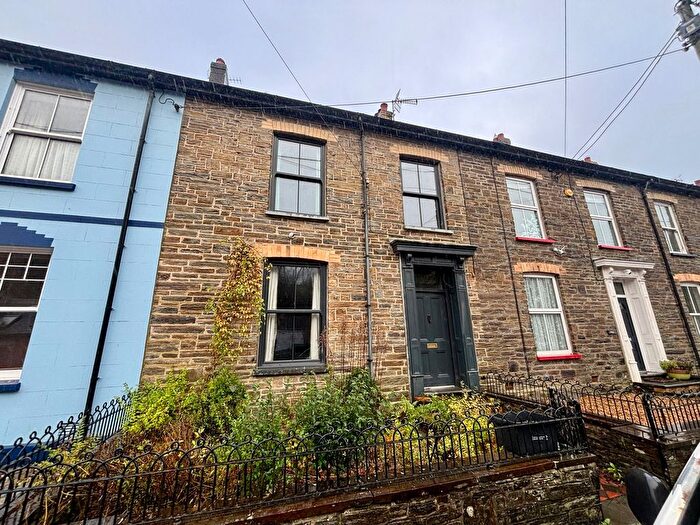
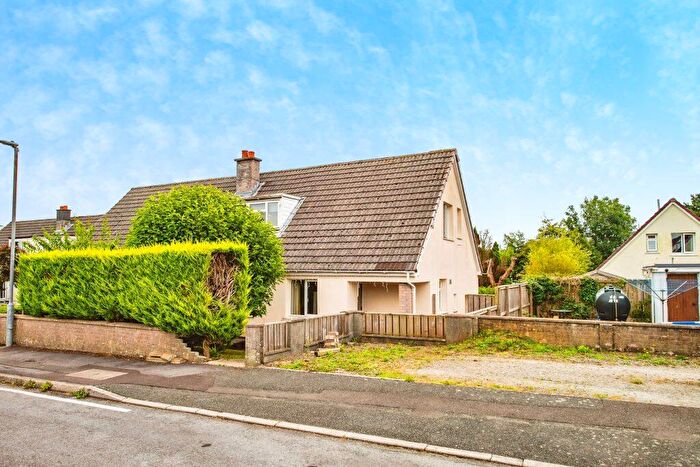
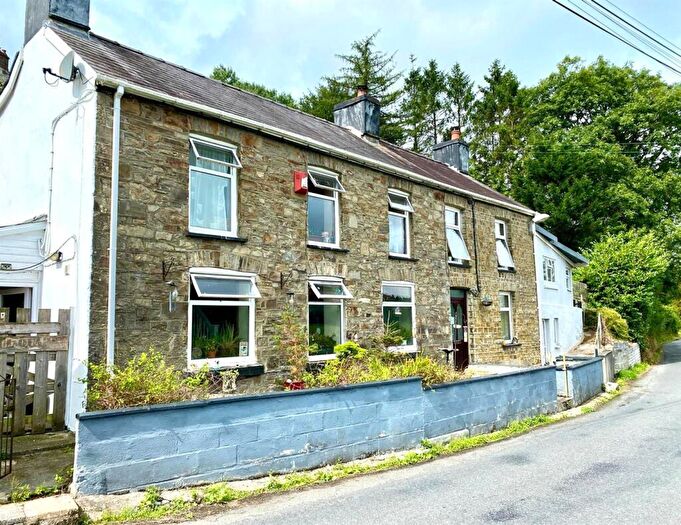
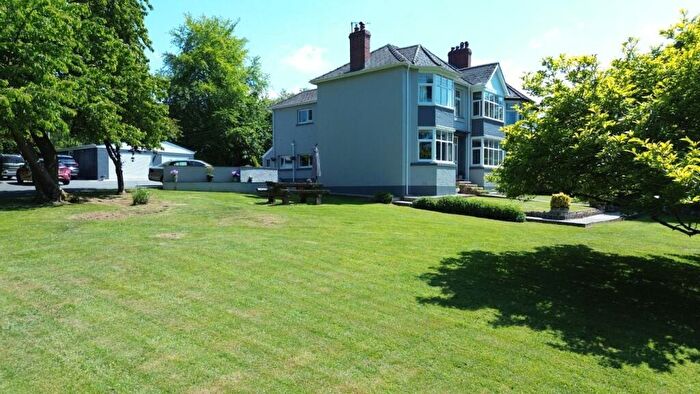
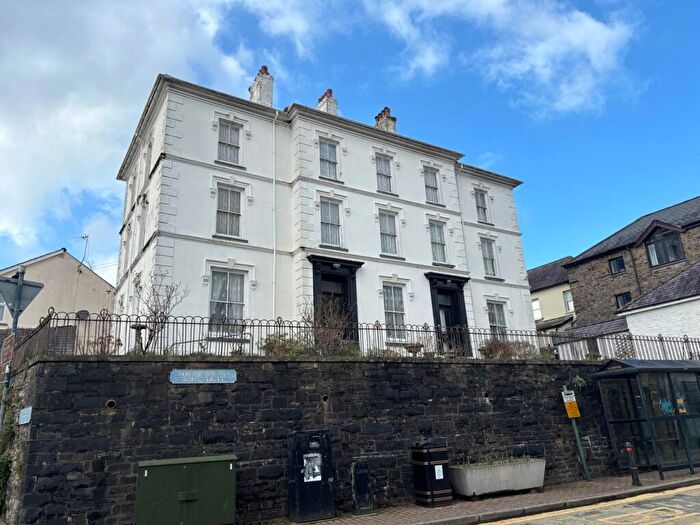
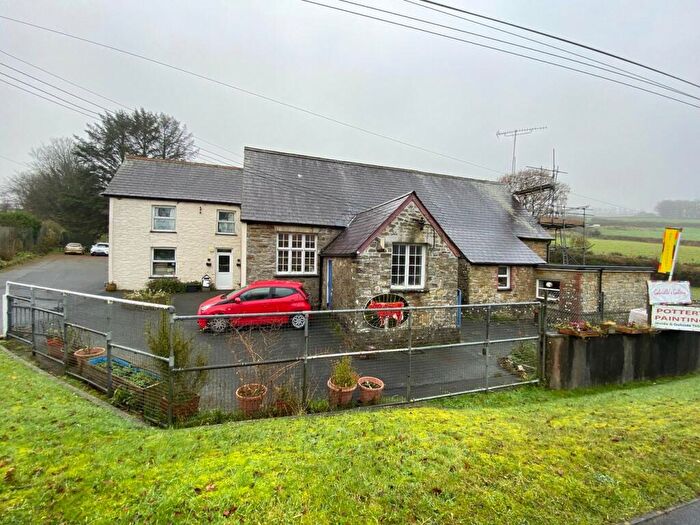
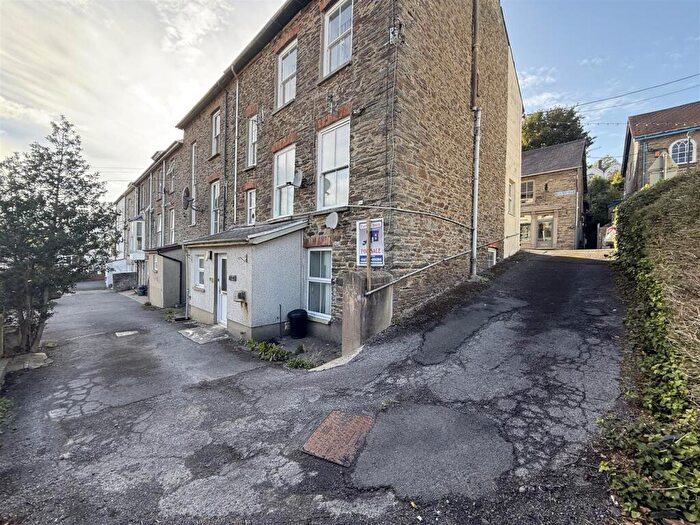
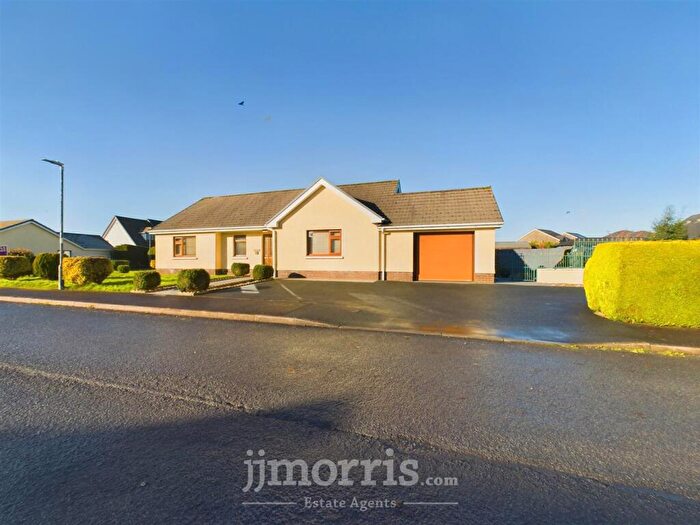
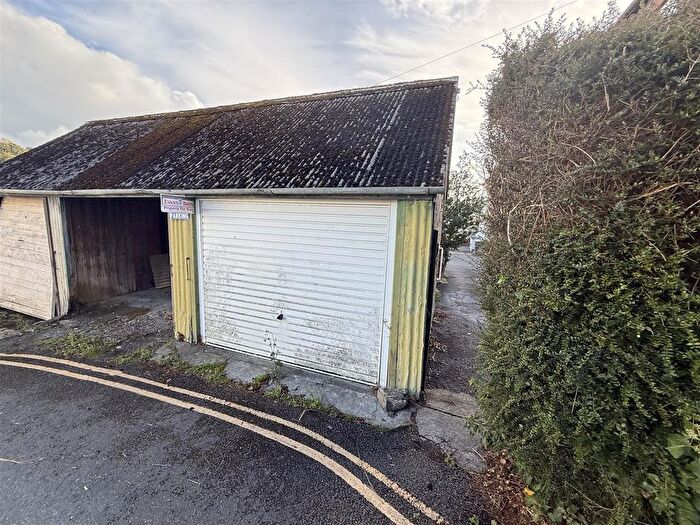
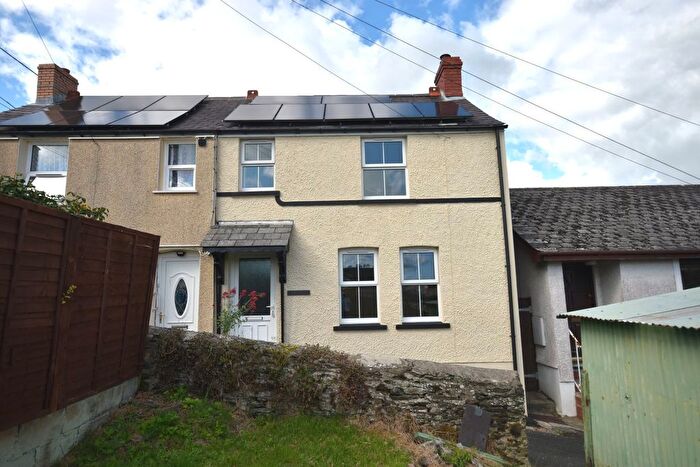
Properties for sale near SA44 4DD, Marble Terrace
![]()
If you are looking to sell your house, let it out, or receive a property valuation, an expert can help you.
Click the button below to get started.
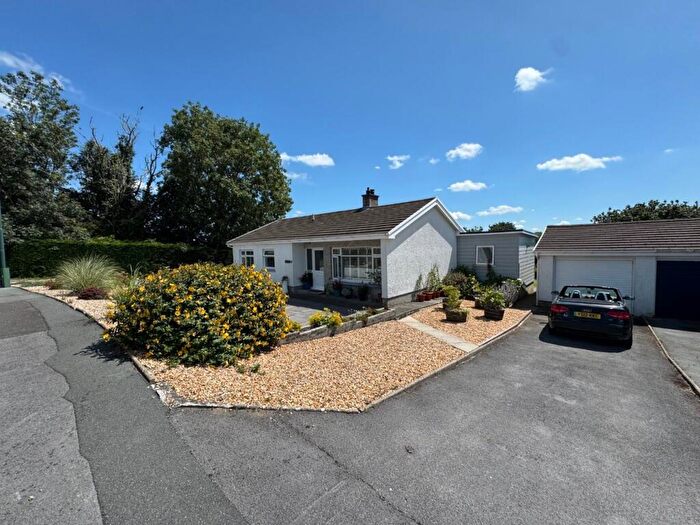
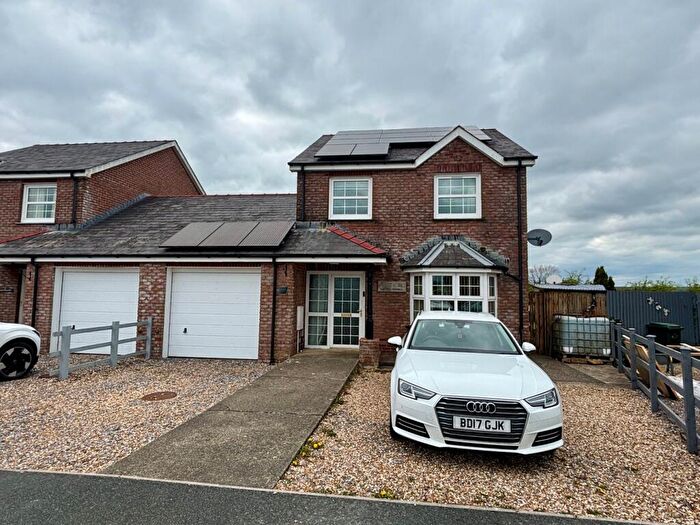
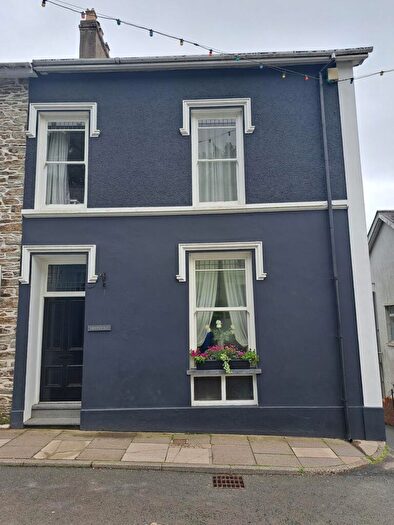
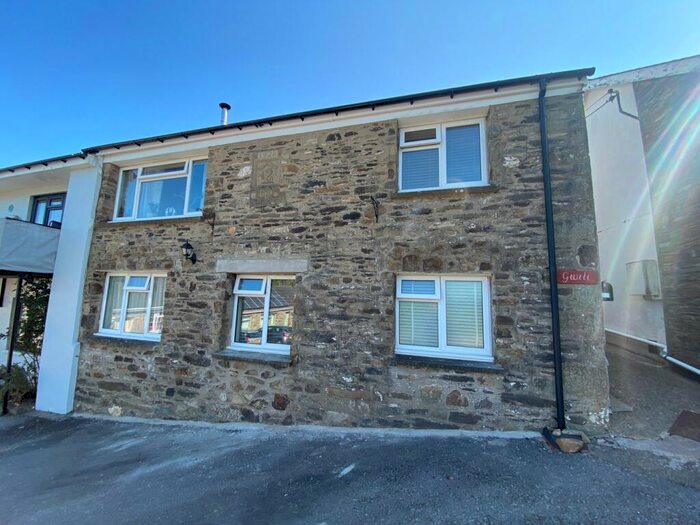
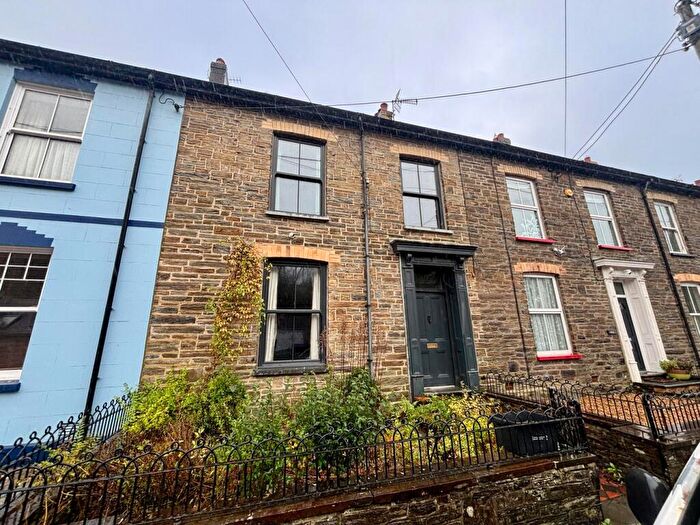
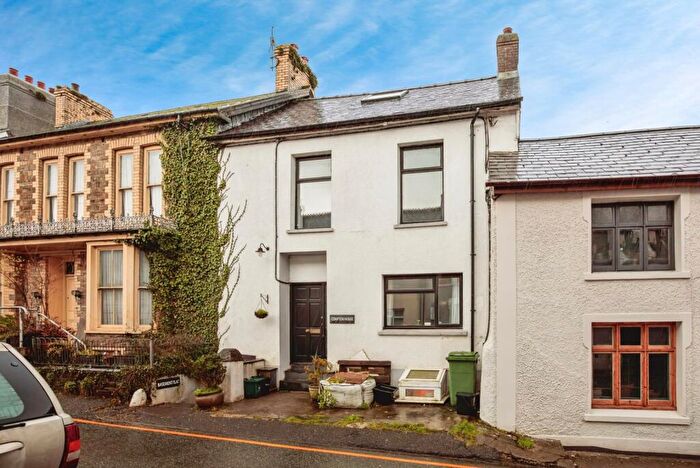
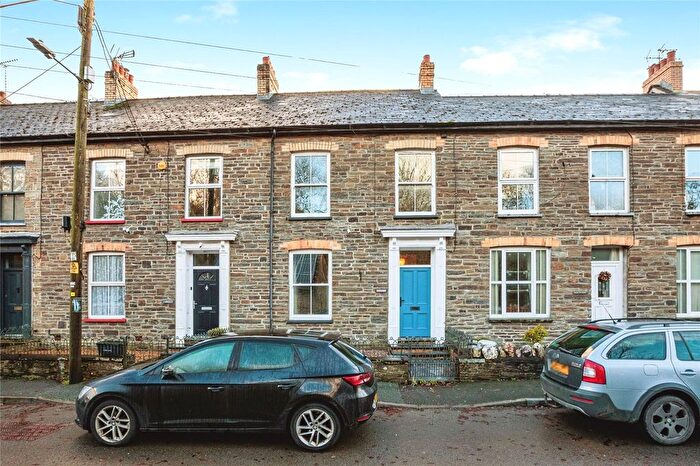
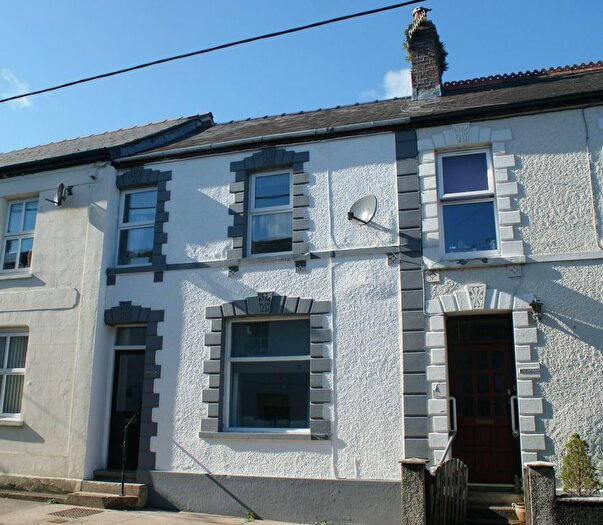
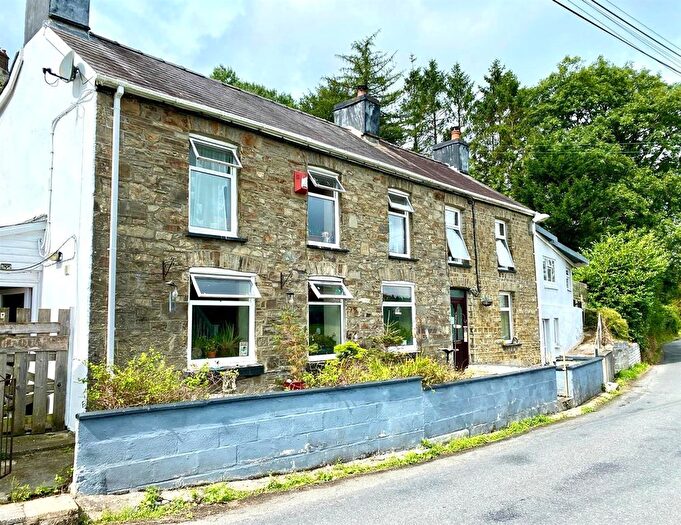
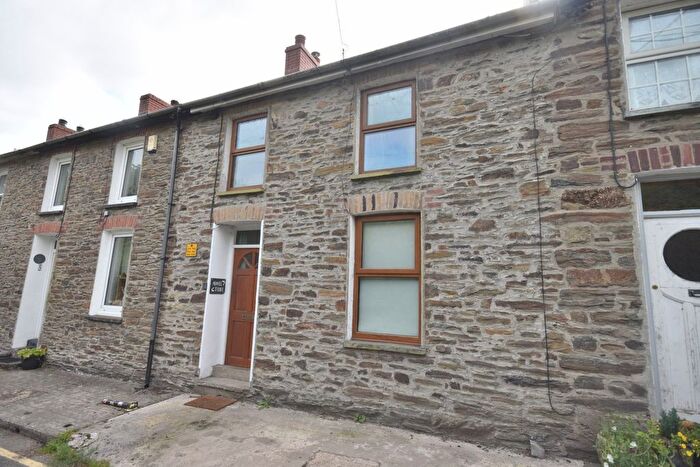
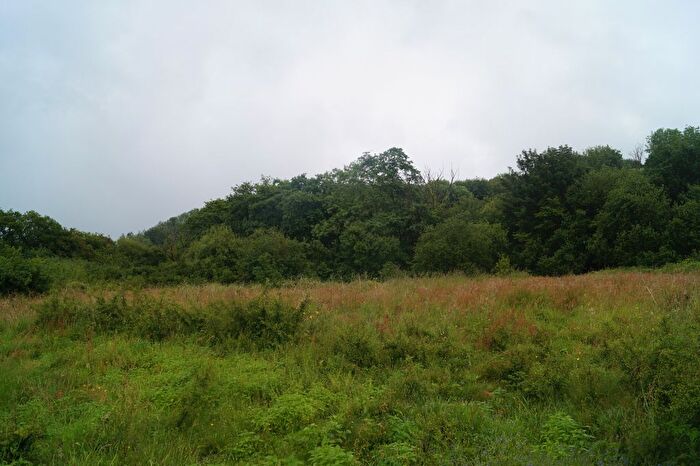
Previously listed properties near SA44 4DD, Marble Terrace

![]()
If you are looking to sell your house, let it out, or receive a property valuation, an expert can help you.
Click the button below to get started.

Price Paid in Marble Terrace, SA44 4DD, Llandysul Town
PANTGLAS Marble Terrace, SA44 4DD, Llandysul Town Llandysul
Property PANTGLAS has been sold 7 times. The last time it was sold was in 29/01/2021 and the sold price was £135,500.00.
This terraced house, sold as a freehold on 29/01/2021, is a 69 sqm end-terrace house with an EPC rating of G.
| Date | Price | Property Type | Tenure | Classification |
|---|---|---|---|---|
| 29/01/2021 | £135,500.00 | Terraced House | freehold | Established Building |
| 12/08/2016 | £76,000.00 | Terraced House | freehold | Established Building |
| 19/05/2006 | £105,000.00 | Terraced House | freehold | Established Building |
| 05/03/2004 | £80,000.00 | Terraced House | freehold | Established Building |
| 18/10/2002 | £52,500.00 | Terraced House | freehold | Established Building |
| 30/03/2001 | £35,500.00 | Terraced House | freehold | Established Building |
| 27/09/1996 | £29,500.00 | Terraced House | freehold | Established Building |
Postcodes in Marble Terrace, Llandysul Town
Navigate through other locations in Marble Terrace, Llandysul Town, Llandysul to see more property listings for sale or to rent.
Transport near SA44 4DD, Marble Terrace
-
 Carmarthen Station
 -
Llandeilo Station
-
Ffairfach Station
-
Ferryside Station
-
Llangadog Station
-
Llanwrda Station
House price paid reports for SA44 4DD, Marble Terrace
Click on the buttons below to see price paid reports by year or property price:
- Price Paid By Year
Property Price Paid in SA44 4DD, Marble Terrace by Year
The average sold property price by year was:
| Year | Average Sold Price | Price Change |
Sold Properties
|
|---|---|---|---|
| 2021 | £135,500 | 44% |
1 Property |
| 2016 | £76,000 | -38% |
1 Property |
| 2006 | £105,000 | 24% |
1 Property |
| 2004 | £80,000 | 34% |
1 Property |
| 2002 | £52,500 | 32% |
1 Property |
| 2001 | £35,500 | 17% |
1 Property |
| 1996 | £29,500 | - |
1 Property |