Houses for sale & to rent in New Quay, New Quay
House Prices in New Quay
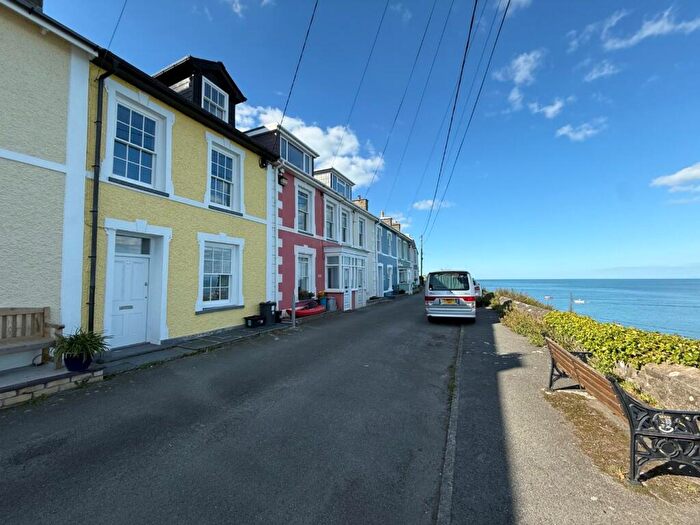
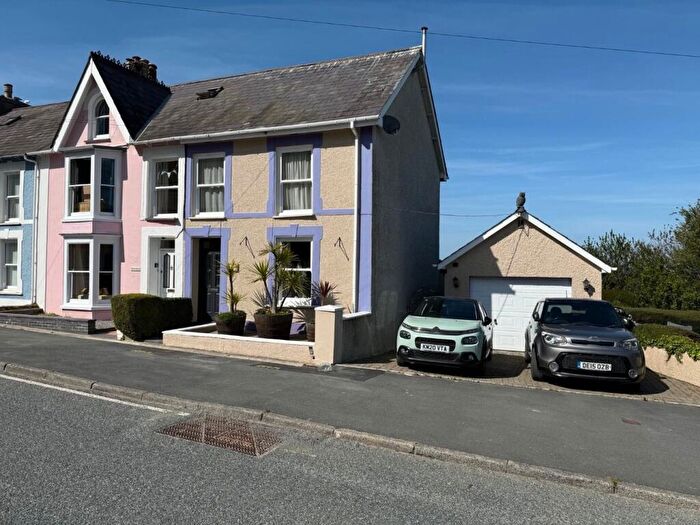
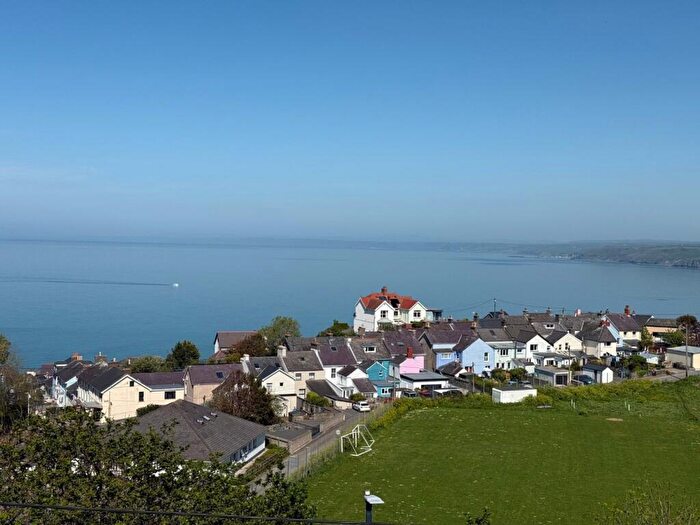
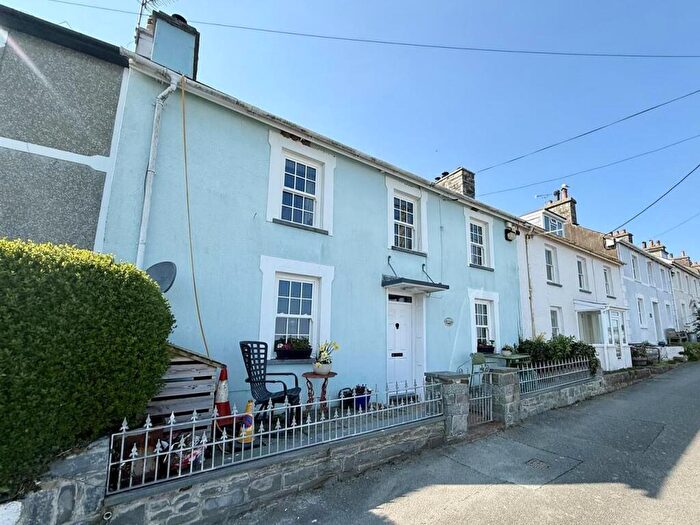
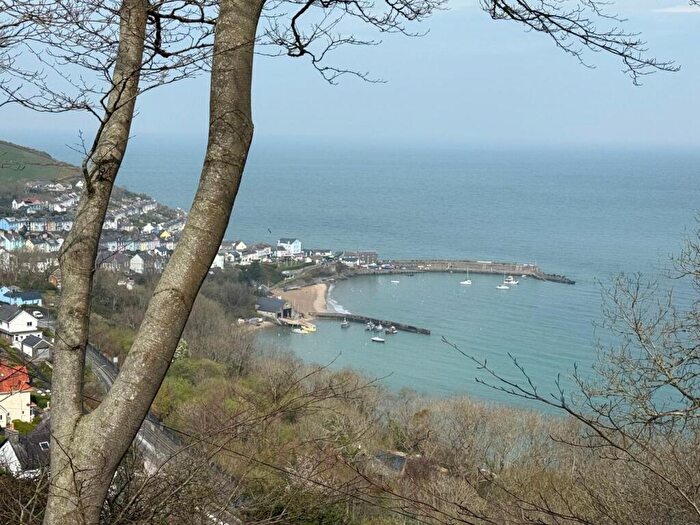
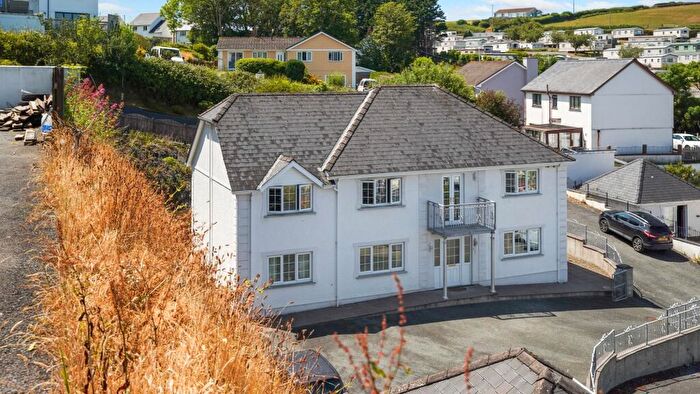
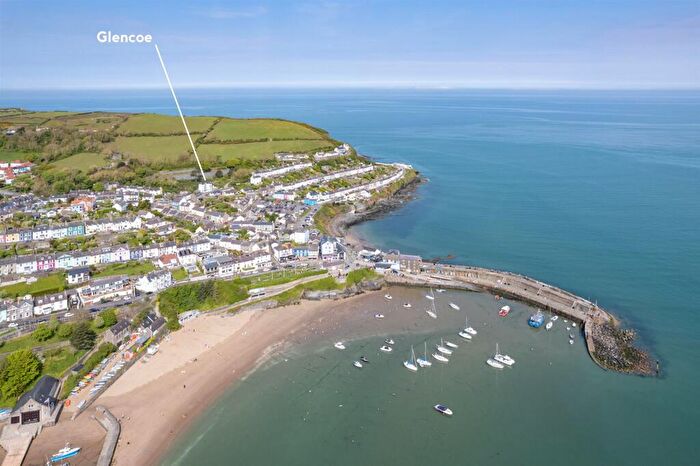
Properties in New Quay have an average house price of £308,254.00 and had 66 Property Transactions within the last 3 years¹.
New Quay is an area in New Quay, Sir Ceredigion - Ceredigion with 512 households², where the most expensive property was sold for £578,000.00.
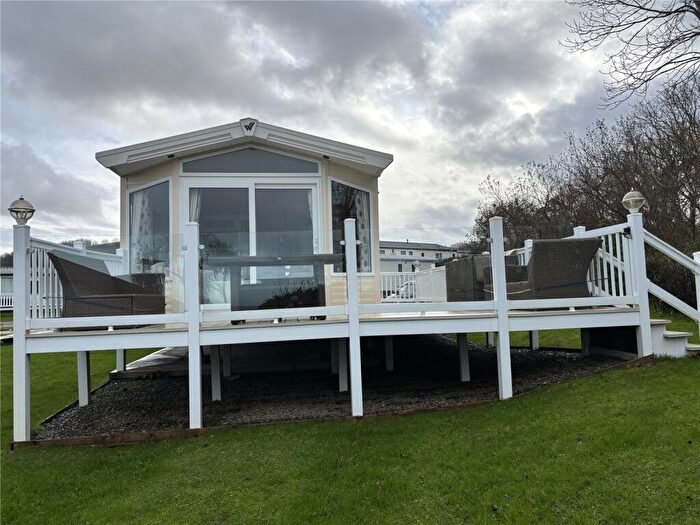
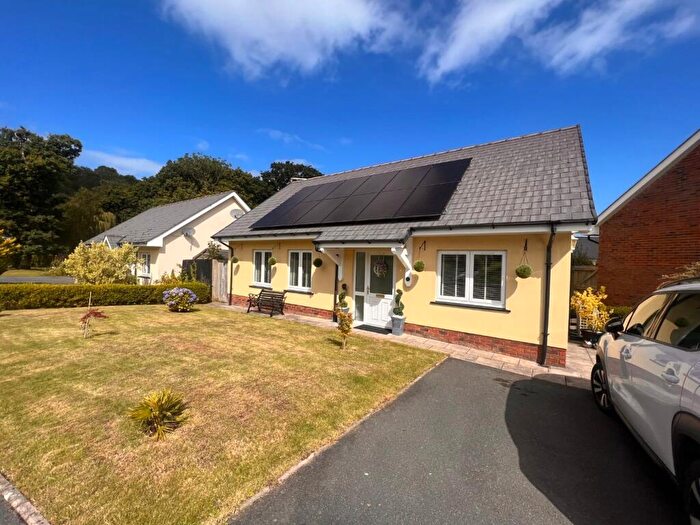
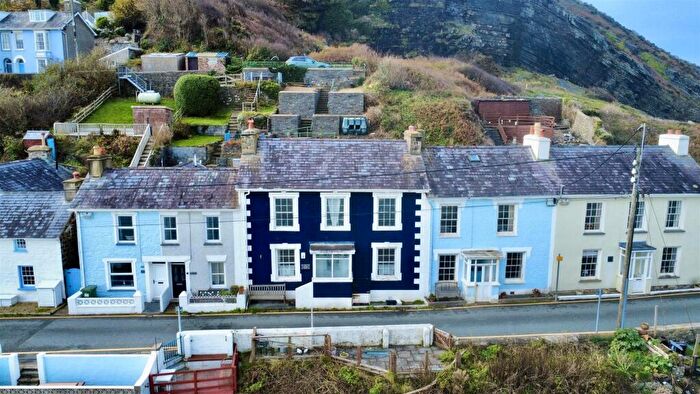
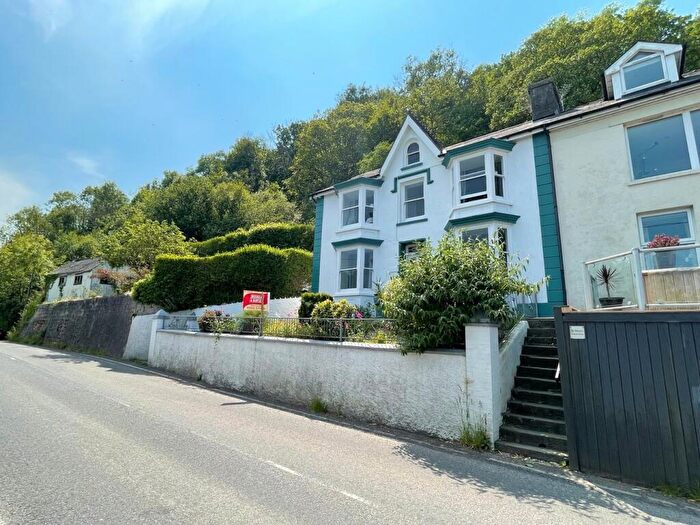
Properties for sale in New Quay
Roads and Postcodes in New Quay
Navigate through our locations to find the location of your next house in New Quay, New Quay for sale or to rent.
| Streets | Postcodes |
|---|---|
| Albion Terrace | SA45 9PA |
| Brongwyn Lane | SA45 9QT |
| Bwlch Gwynt | SA45 9QS |
| Church Road | SA45 9PB |
| Church Street | SA45 9NT SA45 9NX SA45 9NZ |
| Cwmhalen | SA45 9SF |
| Cwmifor | SA45 9QW |
| Cylch Y Llan | SA45 9PE |
| Dolphin Court | SA45 9TA |
| Field Place | SA45 9QN |
| Francis Street | SA45 9QL SA45 9QP |
| George Street | SA45 9QR |
| Glanmor Terrace | SA45 9PS SA45 9PT SA45 9PX |
| Gomer Crescent | SA45 9NL SA45 9PU |
| Hengell Uchaf | SA45 9SE |
| Hengell Uchaf Estate | SA45 9SZ |
| High Street | SA45 9NY |
| High Terrace | SA45 9NJ |
| Hill Street | SA45 9QD |
| Lewis Terrace | SA45 9PG |
| Llandysul Road | SA45 9RF |
| Llys Y Dderwen | SA45 9SY |
| Margaret Street | SA45 9QJ SA45 9TD |
| Marine Terrace | SA45 9PJ |
| Park Street | SA45 9QG |
| Penrhiw Pistyll Lane | SA45 9TQ |
| Pentre Garth | SA45 9TF |
| Penwig Fields | SA45 9QQ |
| Picton Crescent | SA45 9QB |
| Picton Terrace | SA45 9QA |
| Prospect Place | SA45 9PH |
| Queen Street | SA45 9PY |
| Rectory Square | SA45 9RE |
| Rock Street | SA45 9PL |
| School Lane | SA45 9TE |
| South John Street | SA45 9NG SA45 9NN SA45 9NP |
| The Pier | SA45 9NW |
| Tower Hill | SA45 9PQ |
| Towyn Road | SA45 9RD SA45 9PZ |
| Uplands Square | SA45 9QH |
| Water Street | SA45 9PF |
| Wellington Place | SA45 9NR |
| White Street | SA45 9NH |
| SA45 9RQ SA45 9SB SA45 9SQ SA45 9TH SA45 9NQ SA45 9SA SA45 9TG SA45 9TJ SA45 9TL |
Transport near New Quay
-
Aberystwyth Station
-
Borth Station
-
Carmarthen Station
-
Aberdovey Station
-
Penhelig Station
-
Llanwrda Station
-
Llangadog Station
-
Llandeilo Station
-
Llandovery Station
-
Ffairfach Station
- FAQ
- Price Paid By Year
- Property Type Price
Frequently asked questions about New Quay
What is the average price for a property for sale in New Quay?
The average price for a property for sale in New Quay is £308,254. This amount is 3% higher than the average price in New Quay. There are 95 property listings for sale in New Quay.
What streets have the most expensive properties for sale in New Quay?
The streets with the most expensive properties for sale in New Quay are Lewis Terrace at an average of £430,000, Dolphin Court at an average of £403,166 and Gomer Crescent at an average of £400,000.
What streets have the most affordable properties for sale in New Quay?
The streets with the most affordable properties for sale in New Quay are Cylch Y Llan at an average of £177,475, Towyn Road at an average of £195,000 and Cwmhalen at an average of £240,888.
Which train stations are available in or near New Quay?
Some of the train stations available in or near New Quay are Aberystwyth, Borth and Carmarthen.
Property Price Paid in New Quay by Year
The average sold property price by year was:
| Year | Average Sold Price | Price Change |
Sold Properties
|
|---|---|---|---|
| 2025 | £281,812 | -14% |
8 Properties |
| 2024 | £321,973 | -0,2% |
19 Properties |
| 2023 | £322,562 | 8% |
16 Properties |
| 2022 | £296,165 | 8% |
23 Properties |
| 2021 | £272,103 | 5% |
39 Properties |
| 2020 | £258,312 | -8% |
16 Properties |
| 2019 | £278,964 | 10% |
14 Properties |
| 2018 | £252,460 | 11% |
25 Properties |
| 2017 | £224,349 | -11% |
32 Properties |
| 2016 | £248,321 | 10% |
28 Properties |
| 2015 | £222,389 | 20% |
23 Properties |
| 2014 | £177,233 | -6% |
21 Properties |
| 2013 | £187,628 | -10% |
16 Properties |
| 2012 | £206,269 | -11% |
18 Properties |
| 2011 | £228,030 | 13% |
21 Properties |
| 2010 | £199,039 | 3% |
23 Properties |
| 2009 | £193,725 | -24% |
16 Properties |
| 2008 | £239,506 | 5% |
15 Properties |
| 2007 | £227,713 | 21% |
34 Properties |
| 2006 | £180,738 | 0,3% |
30 Properties |
| 2005 | £180,191 | 11% |
18 Properties |
| 2004 | £159,960 | 25% |
23 Properties |
| 2003 | £119,789 | 9% |
34 Properties |
| 2002 | £109,572 | 35% |
37 Properties |
| 2001 | £71,184 | 2% |
32 Properties |
| 2000 | £69,592 | -6% |
29 Properties |
| 1999 | £73,832 | 20% |
32 Properties |
| 1998 | £59,373 | 10% |
23 Properties |
| 1997 | £53,514 | 6% |
31 Properties |
| 1996 | £50,250 | 1% |
16 Properties |
| 1995 | £49,922 | - |
20 Properties |
Property Price per Property Type in New Quay
Here you can find historic sold price data in order to help with your property search.
The average Property Paid Price for specific property types in the last three years are:
| Property Type | Average Sold Price | Sold Properties |
|---|---|---|
| Semi Detached House | £234,868.00 | 8 Semi Detached Houses |
| Detached House | £346,442.00 | 26 Detached Houses |
| Terraced House | £319,748.00 | 26 Terraced Houses |
| Flat | £190,816.00 | 6 Flats |

