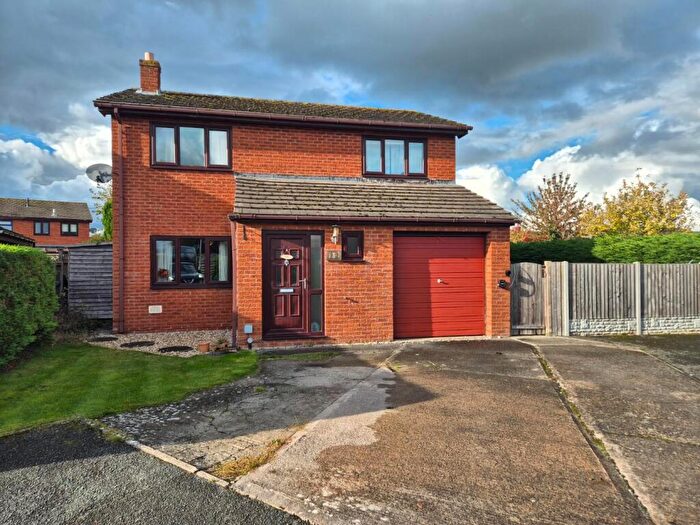
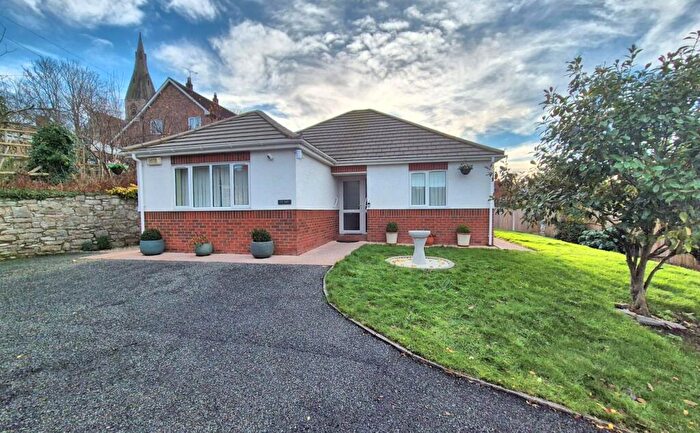
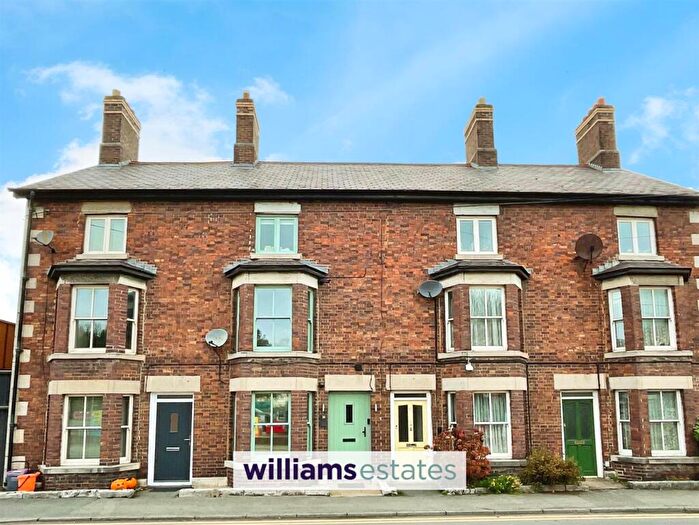
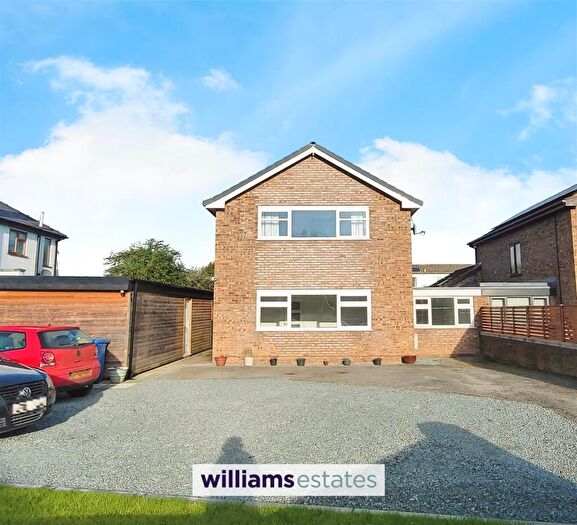
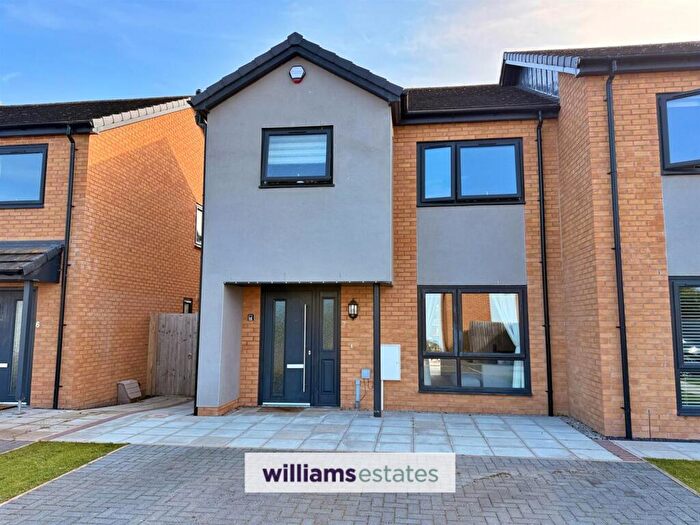
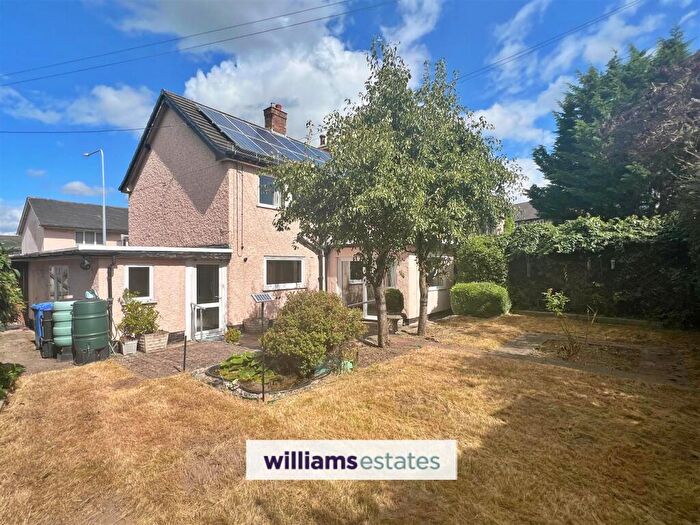
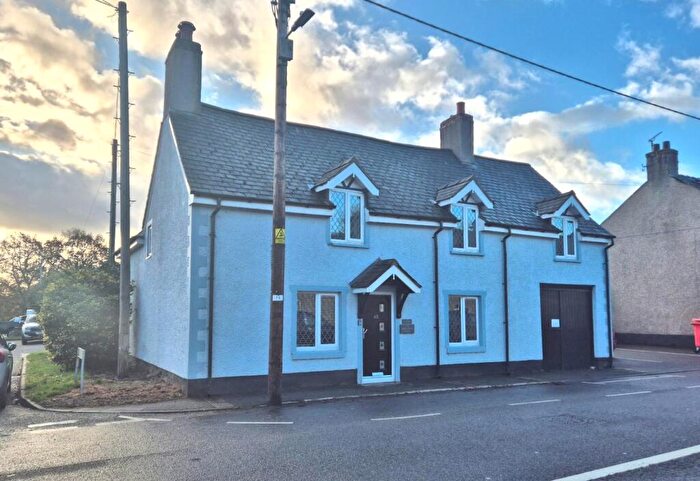
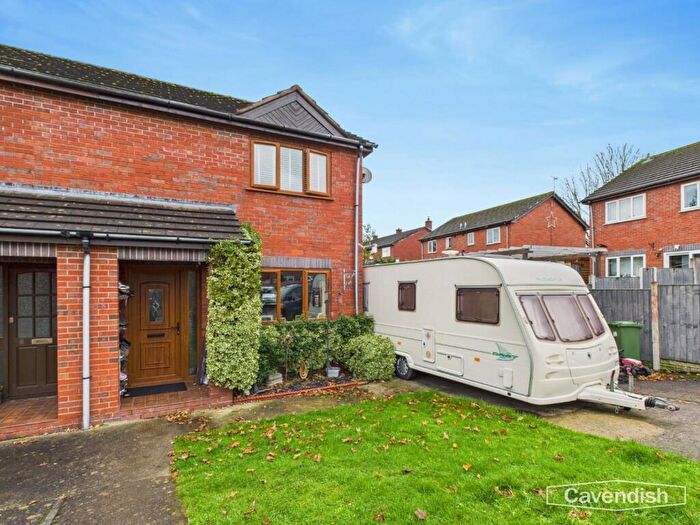
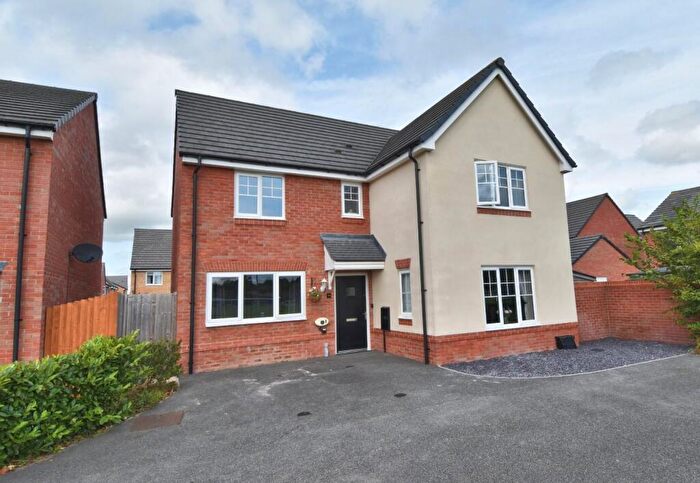
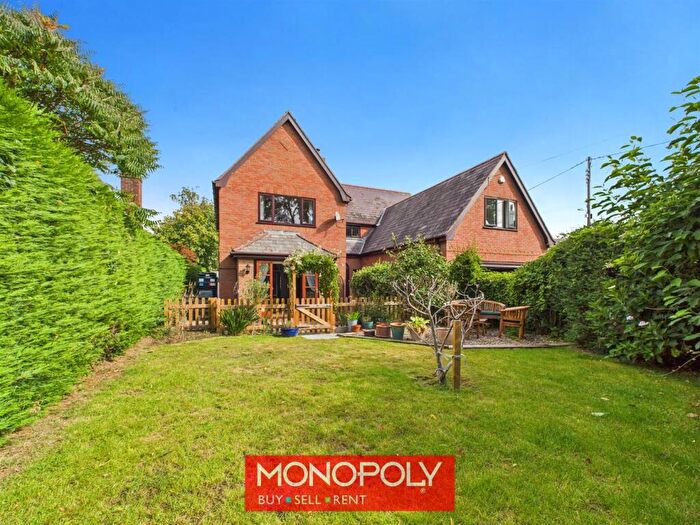
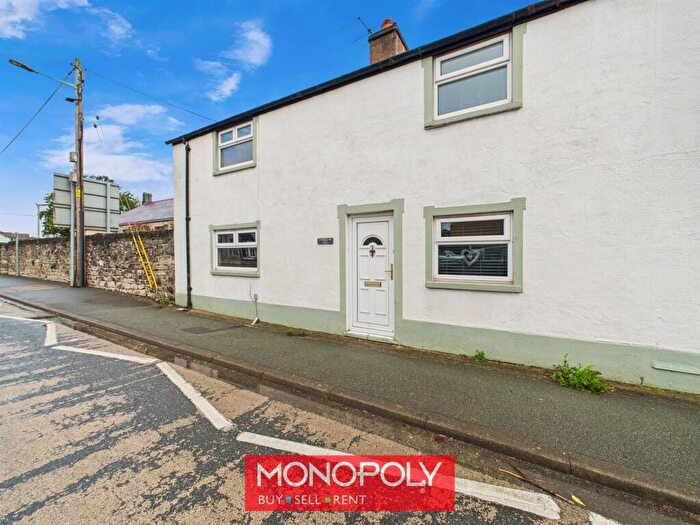
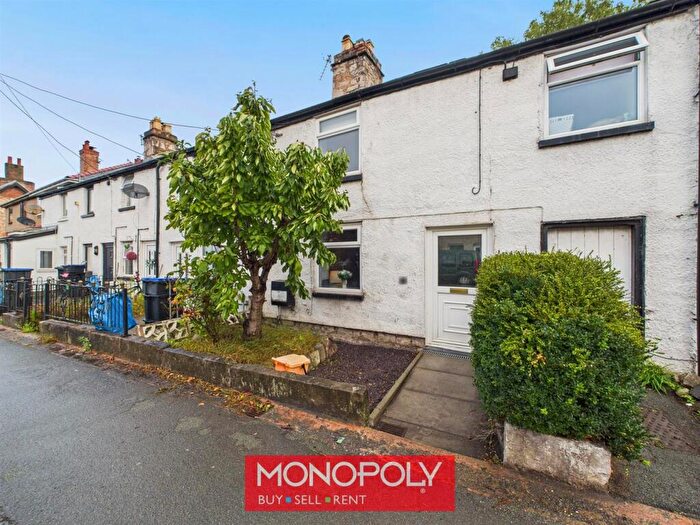
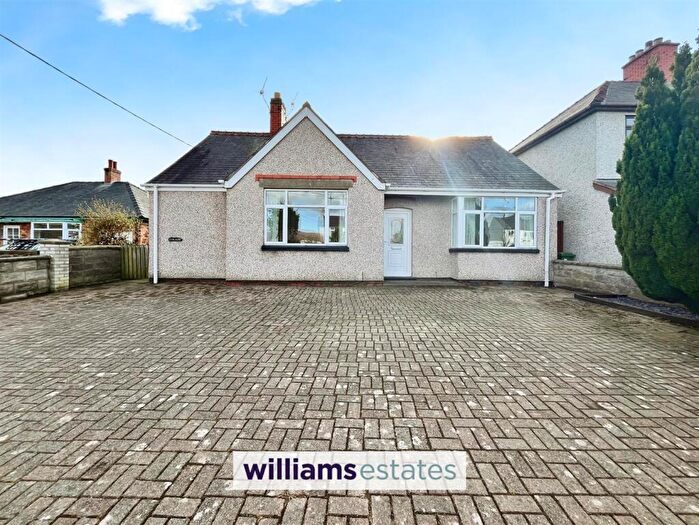
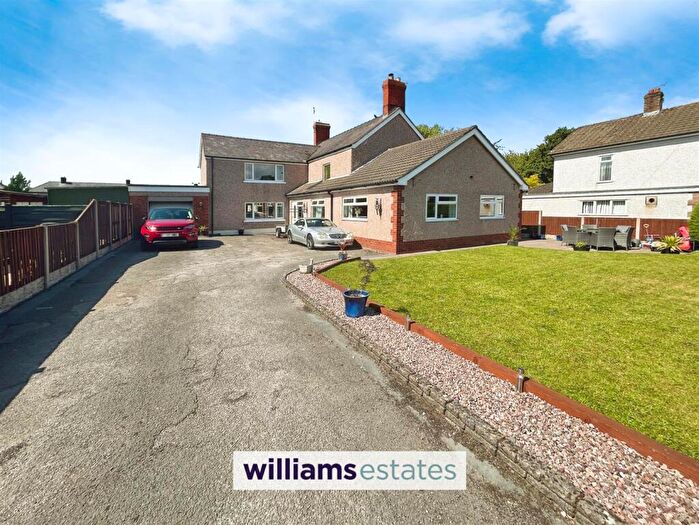
Houses for sale & to rent in Llandyrnog, Ruthin
House Prices in Llandyrnog
Properties in Llandyrnog have an average house price of £317,031.00 and had 16 Property Transactions within the last 3 years¹.
Llandyrnog is an area in Ruthin, Sir Ddinbych - Denbighshire with 223 households², where the most expensive property was sold for £675,000.00.
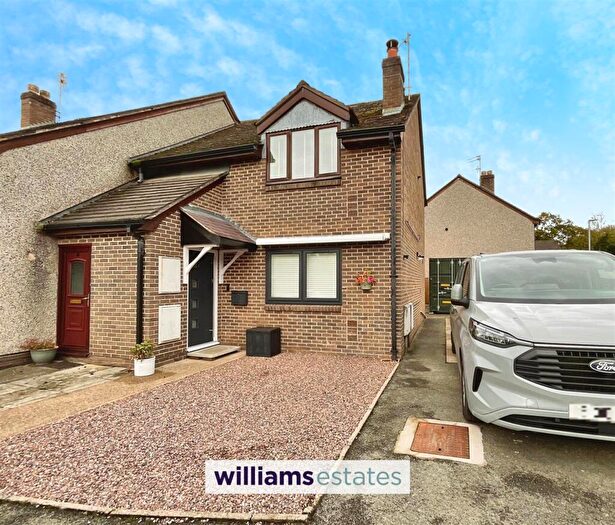
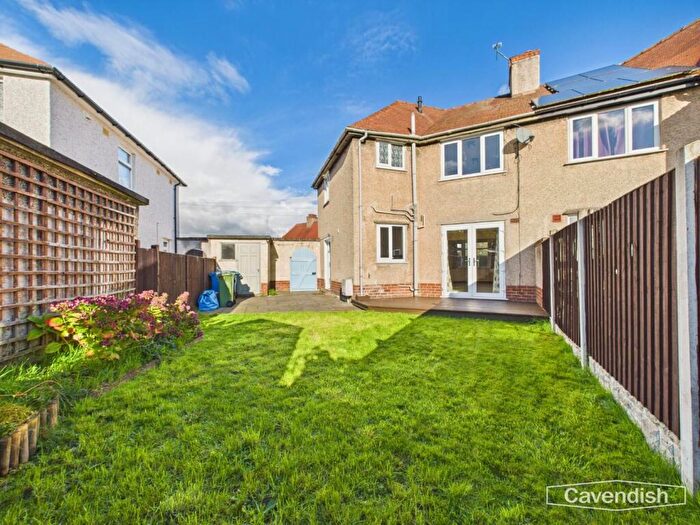
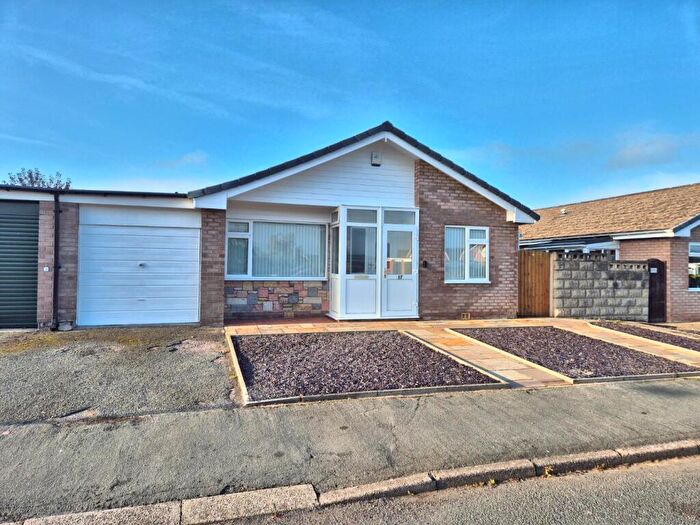
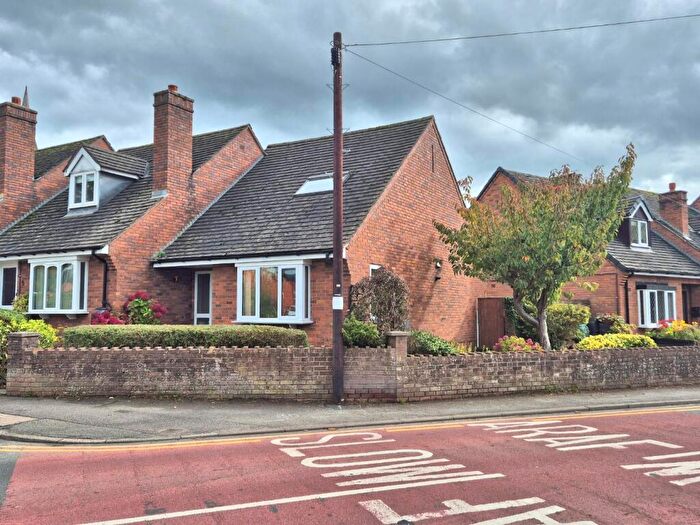
Properties for sale in Llandyrnog
Roads and Postcodes in Llandyrnog
Navigate through our locations to find the location of your next house in Llandyrnog, Ruthin for sale or to rent.
| Streets | Postcodes |
|---|---|
| Bro Clwyd | LL15 1TG |
| Bro Clywedog | LL15 1BA |
| Cilgwyn | LL15 2TT |
| Cwrt Arthur | LL15 2UJ |
| Denbigh Road | LL15 2UF |
| Dolydd | LL15 1TL |
| Ffordd Yr Orsaf | LL15 1TZ |
| Lon Yr Eglwys | LL15 1TJ |
| Maes Derw | LL15 1TX |
| Rhyd Y Byll | LL15 2TZ |
| LL15 1TF LL15 1TH LL15 1TN LL15 1TP LL15 1UH LL15 1UL LL15 2BS LL15 2DA LL15 2TP LL15 2TR LL15 2TS LL15 2TY LL15 2UA LL15 2UD LL15 1TE LL15 1TW LL15 1UG LL15 2BY LL15 2TU LL15 2TW LL15 2UB LL15 2UE |
Transport near Llandyrnog
-
Penyffordd Station
-
Flint Station
-
Buckley Station
-
Hope (Clwyd) Station
-
Caergwrle Station
-
Cefn-Y-Bedd Station
-
Hawarden Station
-
Shotton Station
-
Gwersyllt Station
-
Hawarden Bridge Station
- FAQ
- Price Paid By Year
- Property Type Price
Frequently asked questions about Llandyrnog
What is the average price for a property for sale in Llandyrnog?
The average price for a property for sale in Llandyrnog is £317,031. This amount is 20% higher than the average price in Ruthin. There are 61 property listings for sale in Llandyrnog.
What streets have the most expensive properties for sale in Llandyrnog?
The streets with the most expensive properties for sale in Llandyrnog are Cwrt Arthur at an average of £480,000 and Bro Clywedog at an average of £376,500.
What streets have the most affordable properties for sale in Llandyrnog?
The street with the most affordable properties for sale in Llandyrnog is Rhyd Y Byll at an average of £234,750.
Which train stations are available in or near Llandyrnog?
Some of the train stations available in or near Llandyrnog are Penyffordd, Flint and Buckley.
Property Price Paid in Llandyrnog by Year
The average sold property price by year was:
| Year | Average Sold Price | Price Change |
Sold Properties
|
|---|---|---|---|
| 2024 | £324,000 | 9% |
4 Properties |
| 2023 | £293,937 | -21% |
8 Properties |
| 2022 | £356,250 | 28% |
4 Properties |
| 2021 | £257,291 | 19% |
13 Properties |
| 2020 | £208,182 | -18% |
12 Properties |
| 2019 | £244,928 | -27% |
7 Properties |
| 2018 | £310,531 | 33% |
8 Properties |
| 2017 | £208,468 | -4% |
23 Properties |
| 2016 | £217,500 | 20% |
8 Properties |
| 2015 | £172,937 | -50% |
8 Properties |
| 2014 | £259,871 | 29% |
7 Properties |
| 2013 | £185,100 | -1% |
5 Properties |
| 2012 | £186,250 | -40% |
2 Properties |
| 2011 | £260,500 | -0,3% |
3 Properties |
| 2009 | £261,225 | 31% |
2 Properties |
| 2008 | £179,416 | 18% |
3 Properties |
| 2007 | £147,500 | -127% |
5 Properties |
| 2006 | £335,500 | 28% |
5 Properties |
| 2005 | £242,875 | 20% |
4 Properties |
| 2004 | £194,333 | 24% |
9 Properties |
| 2003 | £147,416 | 30% |
6 Properties |
| 2002 | £103,000 | 14% |
8 Properties |
| 2001 | £88,443 | 6% |
7 Properties |
| 2000 | £82,857 | 15% |
7 Properties |
| 1999 | £70,118 | -0,3% |
8 Properties |
| 1998 | £70,333 | -25% |
3 Properties |
| 1997 | £87,593 | 40% |
8 Properties |
| 1996 | £52,500 | -9% |
1 Property |
| 1995 | £57,421 | - |
7 Properties |
Property Price per Property Type in Llandyrnog
Here you can find historic sold price data in order to help with your property search.
The average Property Paid Price for specific property types in the last three years are:
| Property Type | Average Sold Price | Sold Properties |
|---|---|---|
| Semi Detached House | £236,666.00 | 3 Semi Detached Houses |
| Terraced House | £221,083.00 | 6 Terraced Houses |
| Detached House | £433,714.00 | 7 Detached Houses |

