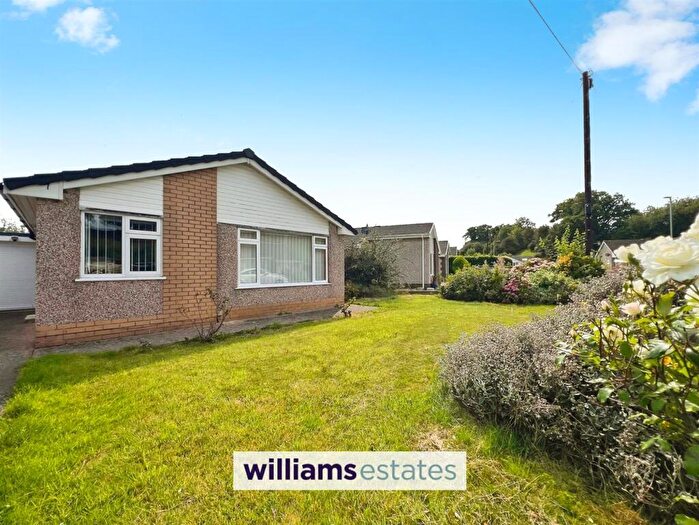
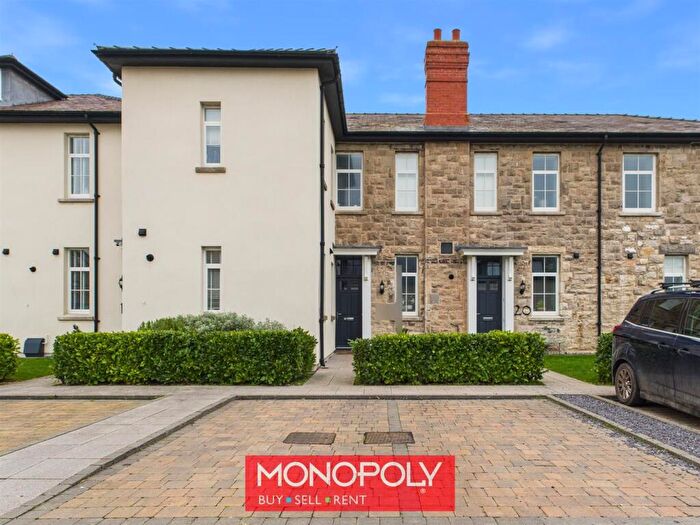
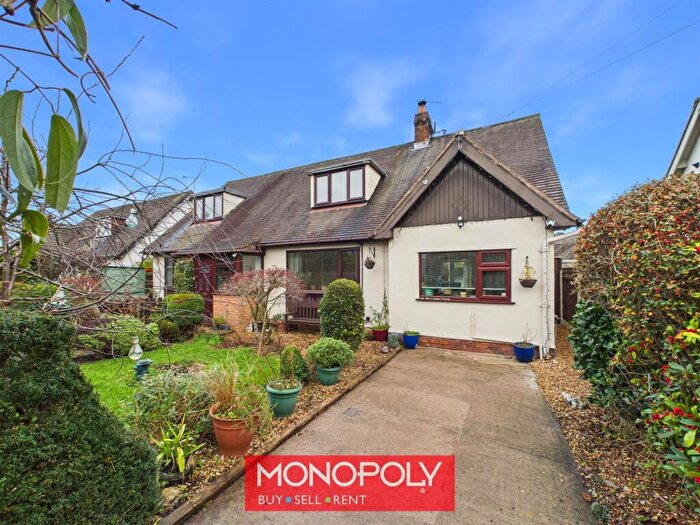
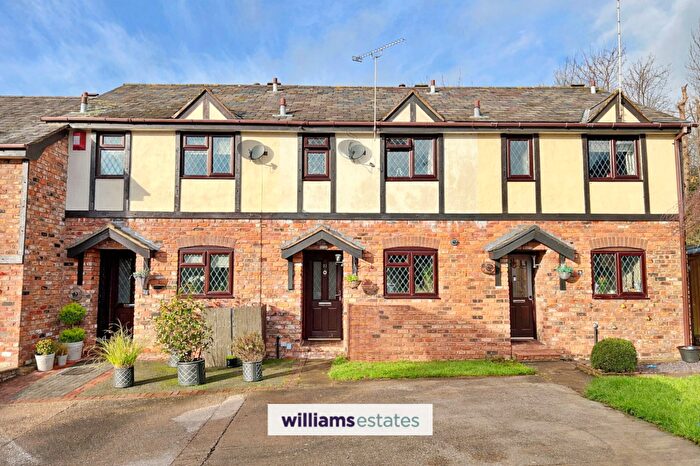
Houses for sale & to rent in St. Asaph East, St Asaph
House Prices in St. Asaph East
Properties in St. Asaph East have an average house price of £277,859.00 and had 73 Property Transactions within the last 3 years¹.
St. Asaph East is an area in St Asaph, Sir Ddinbych - Denbighshire with 736 households², where the most expensive property was sold for £950,000.00.
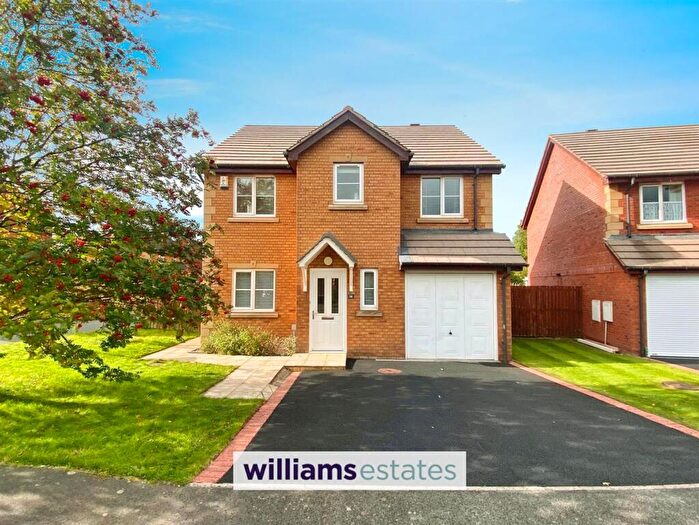
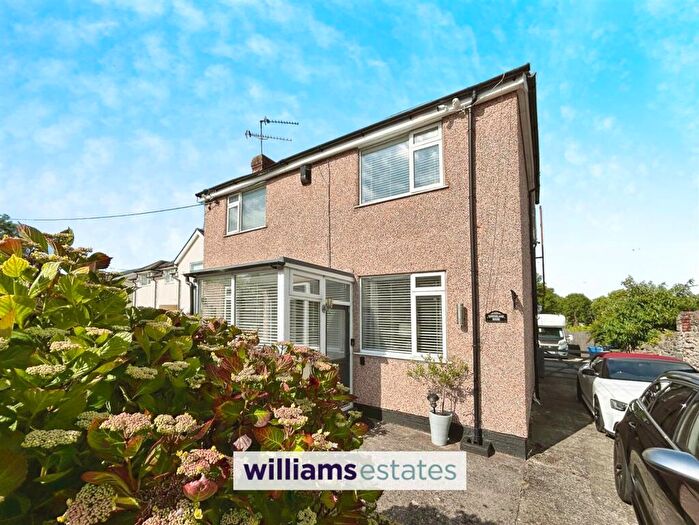
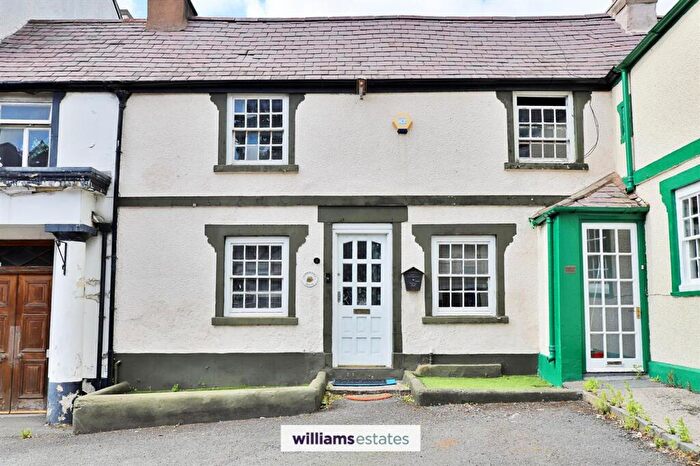
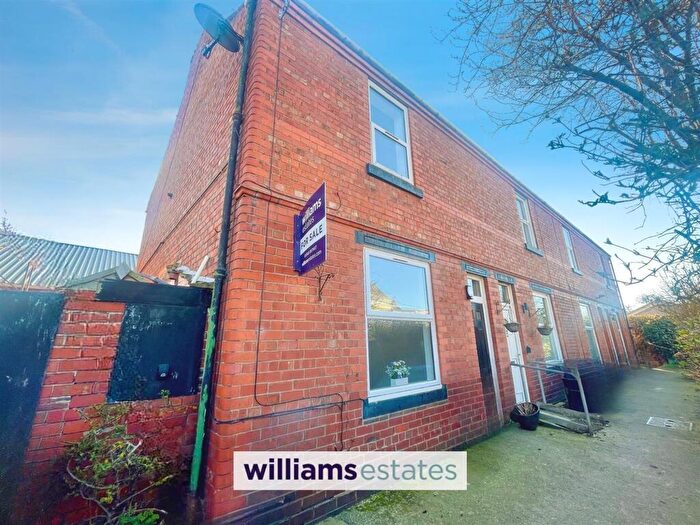
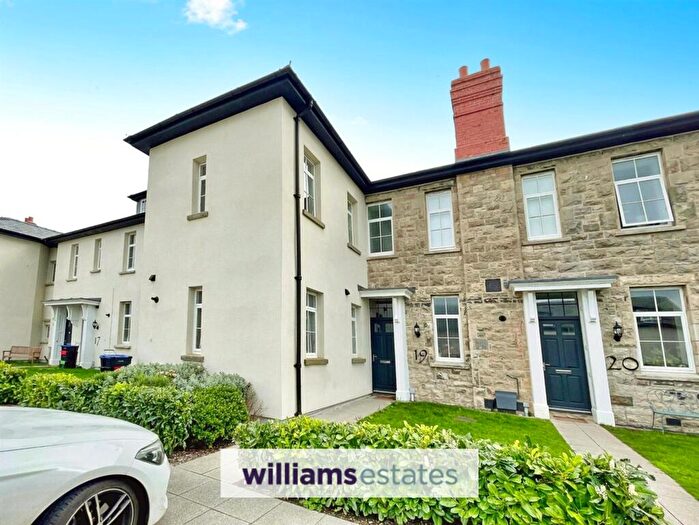
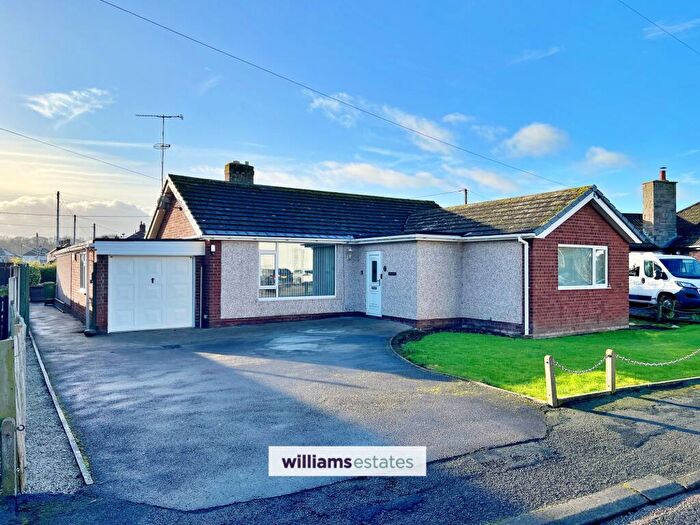
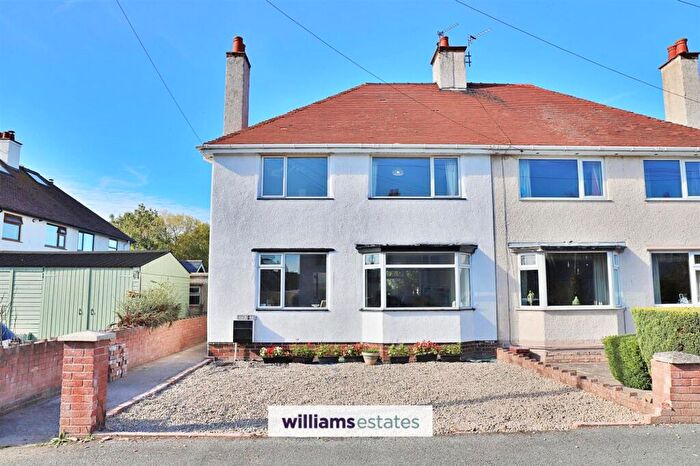
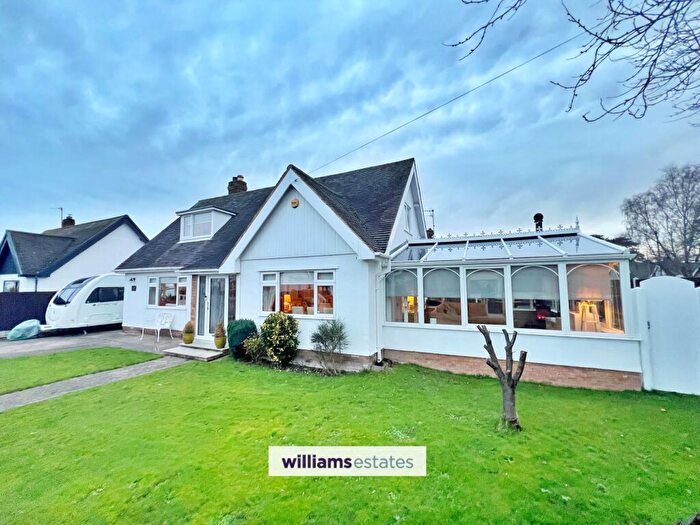
Properties for sale in St. Asaph East
Roads and Postcodes in St. Asaph East
Navigate through our locations to find the location of your next house in St. Asaph East, St Asaph for sale or to rent.
| Streets | Postcodes |
|---|---|
| Bishops Walk | LL17 0SU LL17 0SZ |
| Bronwylfa Square | LL17 0BU |
| Bryn Arthur | LL17 0DP |
| Bryn Coed | LL17 0DQ |
| Bryn Elwy | LL17 0RU |
| Bryn Gobaith | LL17 0DN |
| Cae Bryn | LL17 0RH |
| Cathedral Walk | LL17 0DL |
| Chester Street | LL17 0RE |
| Elwy Place | LL17 0SD |
| Elwy Terrace | LL17 0SL |
| Elwy View | LL17 0SN |
| Ffordd Brenig | LL17 0EZ |
| Fron Haul | LL17 0RT |
| Gemig Street | LL17 0RY |
| Glanrafon Terrace | LL17 0SF |
| High Street | LL17 0RF LL17 0RD LL17 0RG |
| Hillside | LL17 0SB |
| Holly Court | LL17 0DR |
| Irish Square | LL17 0RN |
| Kentigern Court | LL17 0AX |
| Leslie Terrace | LL17 0SH |
| Llwyn Onn | LL17 0SQ |
| Llys Alun | LL17 0SJ |
| Llys Clwyd | LL17 0UA |
| Llys Dyffryn | LL17 0SX |
| Llys Idris | LL17 0AJ |
| Llys Llengoedd | LL17 0TB |
| Llys Trewithan | LL17 0DJ |
| Lon Hm Stanley | LL17 0EJ |
| Lothian Park | LL17 0BY |
| Lower Street | LL17 0SG |
| Luke Street | LL17 0SE |
| Luke Street Mews | LL17 0AF |
| Maes Derwen | LL17 0DA |
| May Terrace | LL17 0SA |
| Mill Street | LL17 0SW LL17 0SP |
| Mount Road | LL17 0DB LL17 0DF LL17 0DD LL17 0DE LL17 0DG LL17 0DH |
| Oak Close | LL17 0DX |
| Oak Lane | LL17 0DZ |
| Rhodfa Glenys | LL17 0DW |
| Rhodfa Tegid | LL17 0EQ |
| Silverdale Terrace | LL17 0SR |
| The Old Palace | LL17 0RQ |
| The Paddock | LL17 0AQ |
| Upper Denbigh Road | LL17 0BH LL17 0LW LL17 0RR LL17 0RW LL17 0RL LL17 0RP LL17 0RS LL17 0RX LL17 0TW |
| Yew Tree Close | LL17 0LB |
| LL17 0EX LL17 0SS LL17 0ST LL17 0FA LL17 0FB LL17 0FD LL17 0FE |
Transport near St. Asaph East
- FAQ
- Price Paid By Year
- Property Type Price
Frequently asked questions about St. Asaph East
What is the average price for a property for sale in St. Asaph East?
The average price for a property for sale in St. Asaph East is £277,859. This amount is 3% higher than the average price in St Asaph. There are 186 property listings for sale in St. Asaph East.
What streets have the most expensive properties for sale in St. Asaph East?
The streets with the most expensive properties for sale in St. Asaph East are Yew Tree Close at an average of £552,500, High Street at an average of £495,000 and Cathedral Walk at an average of £465,000.
What streets have the most affordable properties for sale in St. Asaph East?
The streets with the most affordable properties for sale in St. Asaph East are Glanrafon Terrace at an average of £118,666, Elwy Terrace at an average of £128,500 and Silverdale Terrace at an average of £136,250.
Which train stations are available in or near St. Asaph East?
Some of the train stations available in or near St. Asaph East are Rhyl, Prestatyn and Abergele and Pensarn.
Property Price Paid in St. Asaph East by Year
The average sold property price by year was:
| Year | Average Sold Price | Price Change |
Sold Properties
|
|---|---|---|---|
| 2025 | £262,661 | 6% |
17 Properties |
| 2024 | £248,034 | -29% |
29 Properties |
| 2023 | £319,462 | 12% |
27 Properties |
| 2022 | £280,660 | -5% |
43 Properties |
| 2021 | £295,069 | 34% |
48 Properties |
| 2020 | £195,842 | -12% |
34 Properties |
| 2019 | £219,626 | -12% |
25 Properties |
| 2018 | £245,560 | 18% |
45 Properties |
| 2017 | £202,214 | -6% |
47 Properties |
| 2016 | £214,617 | 1% |
37 Properties |
| 2015 | £213,089 | 9% |
33 Properties |
| 2014 | £194,106 | 7% |
32 Properties |
| 2013 | £179,560 | -12% |
28 Properties |
| 2012 | £201,688 | 11% |
25 Properties |
| 2011 | £179,179 | -13% |
27 Properties |
| 2010 | £201,763 | 3% |
29 Properties |
| 2009 | £196,073 | 20% |
17 Properties |
| 2008 | £156,442 | -24% |
21 Properties |
| 2007 | £194,763 | 6% |
19 Properties |
| 2006 | £182,668 | 12% |
34 Properties |
| 2005 | £159,863 | -7% |
22 Properties |
| 2004 | £171,603 | 38% |
30 Properties |
| 2003 | £106,769 | -6% |
34 Properties |
| 2002 | £112,787 | 27% |
36 Properties |
| 2001 | £81,857 | 5% |
34 Properties |
| 2000 | £77,999 | -2% |
45 Properties |
| 1999 | £79,790 | 14% |
31 Properties |
| 1998 | £68,625 | 3% |
29 Properties |
| 1997 | £66,793 | 7% |
29 Properties |
| 1996 | £62,337 | 8% |
20 Properties |
| 1995 | £57,153 | - |
13 Properties |
Property Price per Property Type in St. Asaph East
Here you can find historic sold price data in order to help with your property search.
The average Property Paid Price for specific property types in the last three years are:
| Property Type | Average Sold Price | Sold Properties |
|---|---|---|
| Semi Detached House | £239,821.00 | 14 Semi Detached Houses |
| Detached House | £385,937.00 | 32 Detached Houses |
| Terraced House | £164,680.00 | 18 Terraced Houses |
| Flat | £179,111.00 | 9 Flats |

