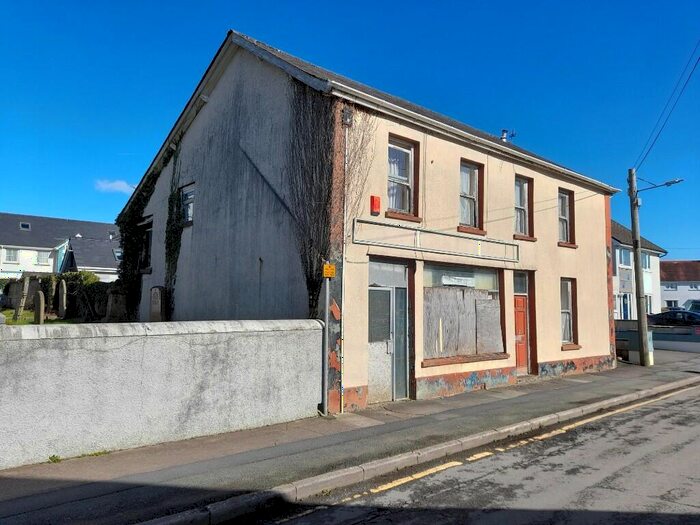
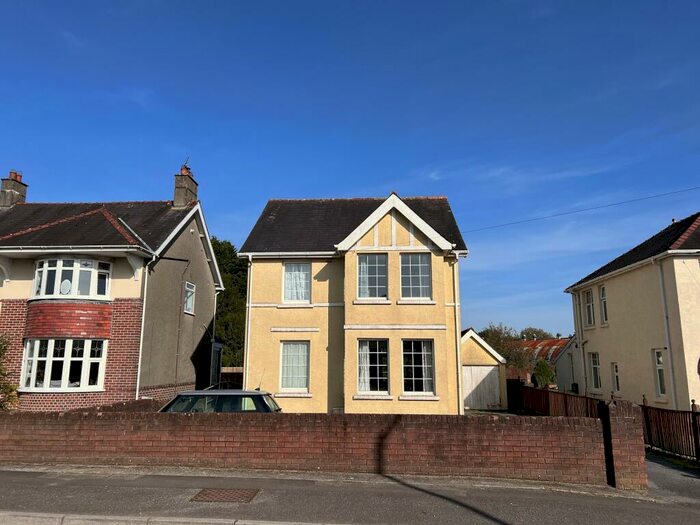
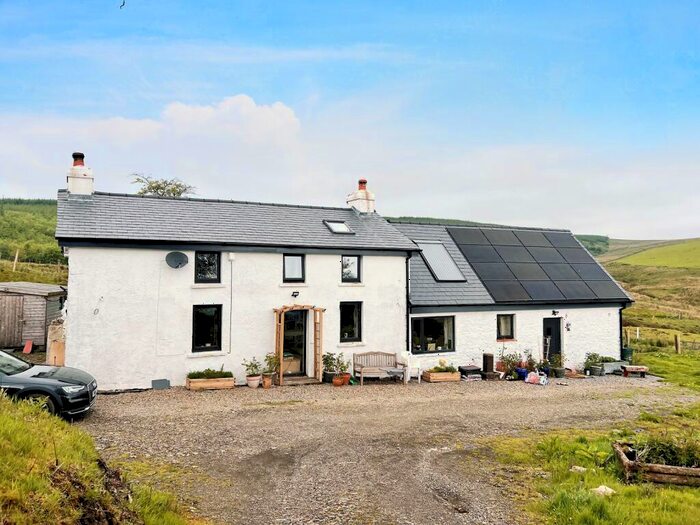
Houses for sale & to rent in Cilycwm, Llandovery
House Prices in Cilycwm
Properties in Cilycwm have an average house price of £425,591.00 and had 19 Property Transactions within the last 3 years¹.
Cilycwm is an area in Llandovery, Sir Gaerfyrddin - Carmarthenshire with 215 households², where the most expensive property was sold for £799,950.00.
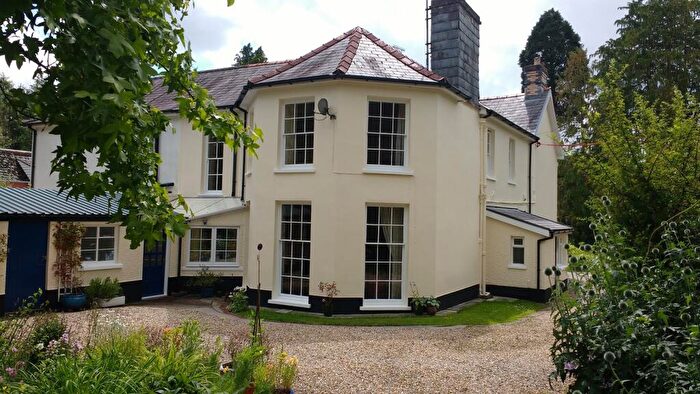
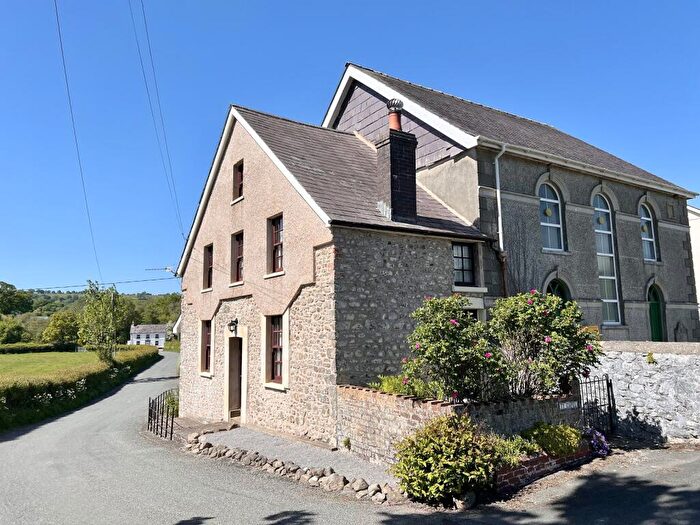
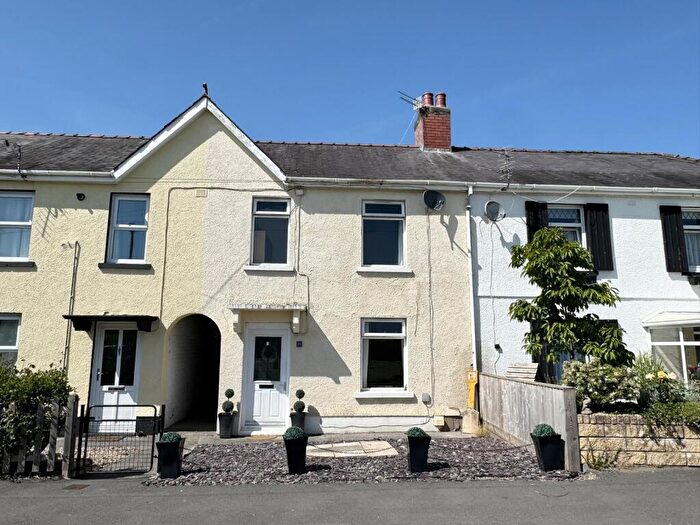
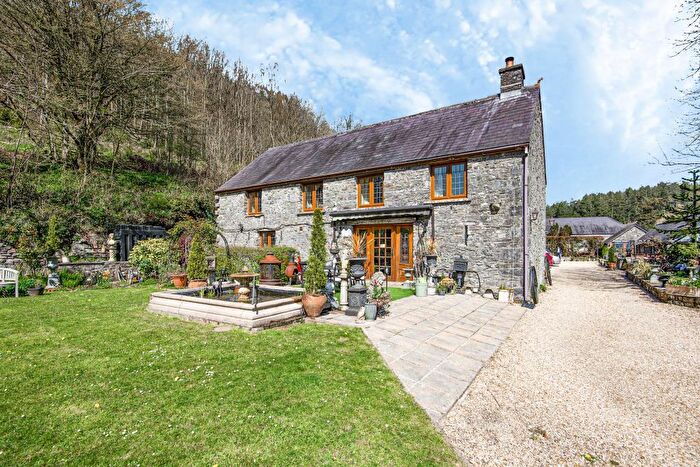
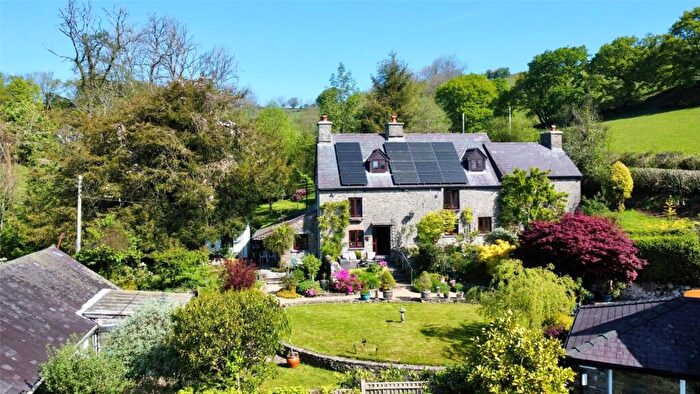
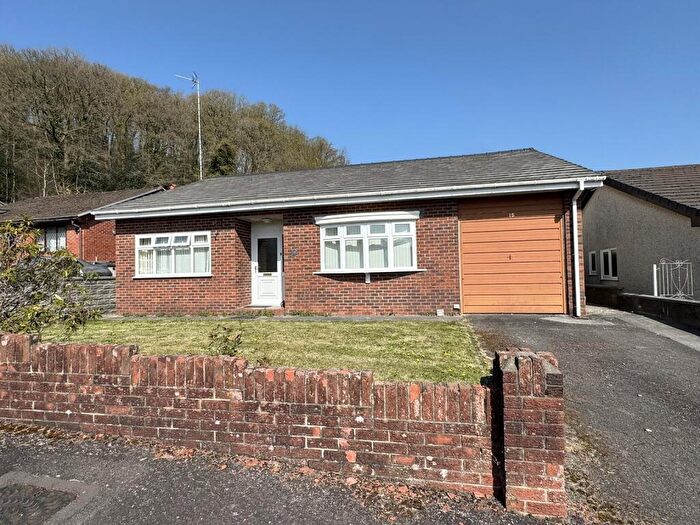
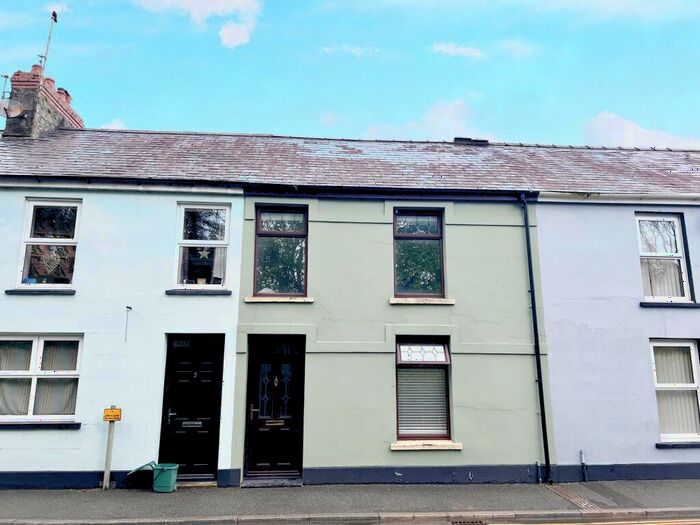
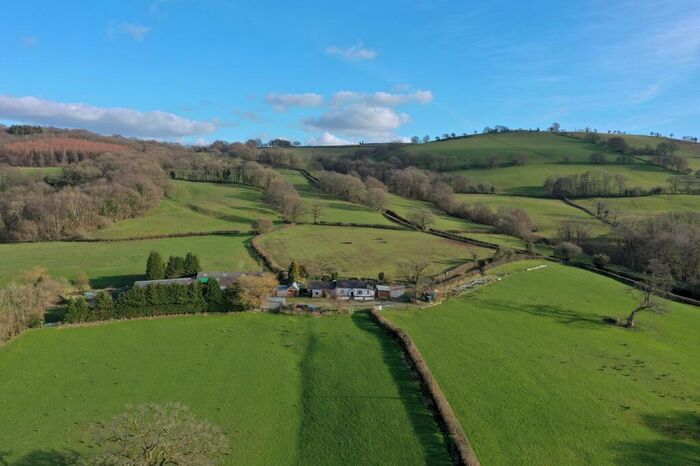
Properties for sale in Cilycwm
Roads and Postcodes in Cilycwm
Navigate through our locations to find the location of your next house in Cilycwm, Llandovery for sale or to rent.
| Streets | Postcodes |
|---|---|
| Rhydwenlais | SA20 0SU |
| Siloh | SA20 0HN |
| Tremcelynog | SA20 0NU |
| SA20 0ES SA20 0ET SA20 0EY SA20 0HR SA20 0HW SA20 0PE SA20 0PL SA20 0PN SA20 0SP SA20 0SR SA20 0SS SA20 0ST SA20 0SW SA20 0SY SA20 0TA SA20 0TF SA20 0TG SA20 0TH SA20 0TL SA20 0TN SA20 0UA SA20 0EU SA20 0EW SA20 0HA SA20 0HE SA20 0HF SA20 0HG SA20 0HH SA20 0HL SA20 0HP SA20 0NT SA20 0PH SA20 0PW SA20 0SN SA20 0TB SA20 0TD SA20 0TE SA20 0TU SA20 0TW SA20 0UD SA20 0UE SA20 0UF SA20 0FA |
Transport near Cilycwm
-
Llandovery Station
-
Cynghordy Station
-
Llanwrda Station
-
Sugar Loaf Station
-
Llangadog Station
-
Llanwrtyd Station
- FAQ
- Price Paid By Year
- Property Type Price
Frequently asked questions about Cilycwm
What is the average price for a property for sale in Cilycwm?
The average price for a property for sale in Cilycwm is £425,591. This amount is 60% higher than the average price in Llandovery. There are 95 property listings for sale in Cilycwm.
Which train stations are available in or near Cilycwm?
Some of the train stations available in or near Cilycwm are Llandovery, Cynghordy and Llanwrda.
Property Price Paid in Cilycwm by Year
The average sold property price by year was:
| Year | Average Sold Price | Price Change |
Sold Properties
|
|---|---|---|---|
| 2025 | £754,975 | 44% |
2 Properties |
| 2024 | £426,250 | 17% |
2 Properties |
| 2023 | £354,255 | -14% |
7 Properties |
| 2022 | £405,500 | 30% |
8 Properties |
| 2021 | £285,618 | 12% |
8 Properties |
| 2020 | £252,333 | 9% |
3 Properties |
| 2019 | £228,750 | -20% |
2 Properties |
| 2018 | £274,392 | 19% |
7 Properties |
| 2017 | £222,000 | 1% |
8 Properties |
| 2016 | £220,555 | 23% |
9 Properties |
| 2015 | £169,000 | -36% |
4 Properties |
| 2014 | £230,500 | 20% |
5 Properties |
| 2013 | £185,375 | 19% |
4 Properties |
| 2012 | £150,000 | -25% |
2 Properties |
| 2011 | £187,500 | -41% |
2 Properties |
| 2010 | £265,000 | -3% |
1 Property |
| 2009 | £273,758 | 25% |
6 Properties |
| 2008 | £204,500 | -10% |
2 Properties |
| 2007 | £225,666 | -14% |
6 Properties |
| 2006 | £257,416 | 65% |
6 Properties |
| 2005 | £90,000 | -3% |
1 Property |
| 2004 | £93,000 | -21% |
1 Property |
| 2003 | £112,666 | 10% |
6 Properties |
| 2002 | £101,214 | -15% |
7 Properties |
| 2001 | £116,375 | 74% |
4 Properties |
| 2000 | £30,166 | -45% |
3 Properties |
| 1999 | £43,666 | -21% |
3 Properties |
| 1998 | £52,875 | -29% |
4 Properties |
| 1997 | £68,306 | -66% |
8 Properties |
| 1996 | £113,500 | 16% |
2 Properties |
| 1995 | £95,000 | - |
1 Property |
Property Price per Property Type in Cilycwm
Here you can find historic sold price data in order to help with your property search.
The average Property Paid Price for specific property types in the last three years are:
| Property Type | Average Sold Price | Sold Properties |
|---|---|---|
| Detached House | £501,410.00 | 14 Detached Houses |
| Semi Detached House | £223,500.00 | 4 Semi Detached Houses |
| Terraced House | £172,500.00 | 1 Terraced House |

