
Houses for sale & to rent in NP4 9JQ, Francis Morris Estate, Blaenavon, Pontypool
House Prices in NP4 9JQ, Francis Morris Estate, Blaenavon
Properties in NP4 9JQ have no sales history available within the last 3 years. NP4 9JQ is a postcode in Francis Morris Estate located in Blaenavon, an area in Pontypool, Tor-faen - Torfaen, with 4 households².
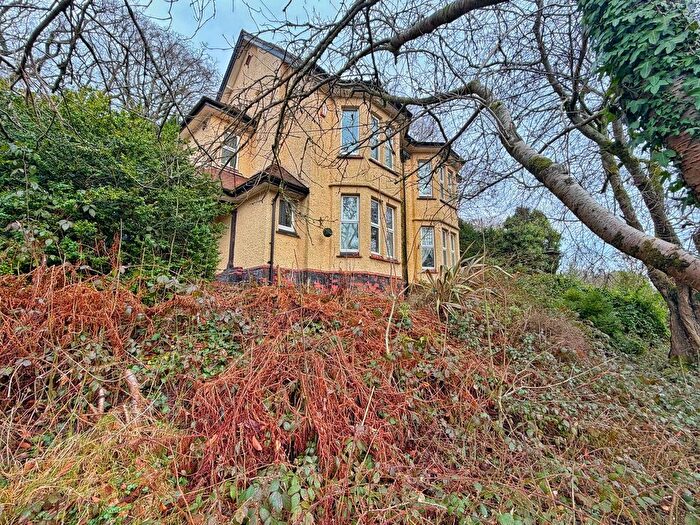
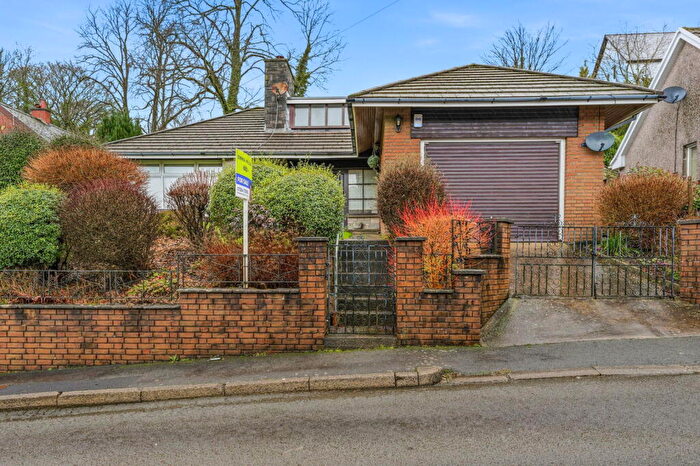
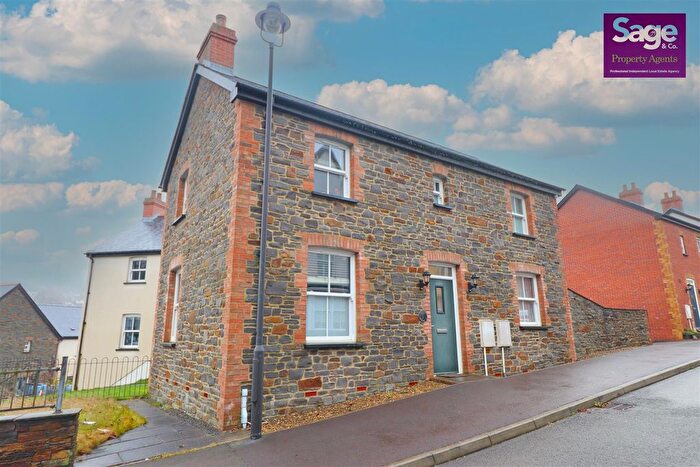
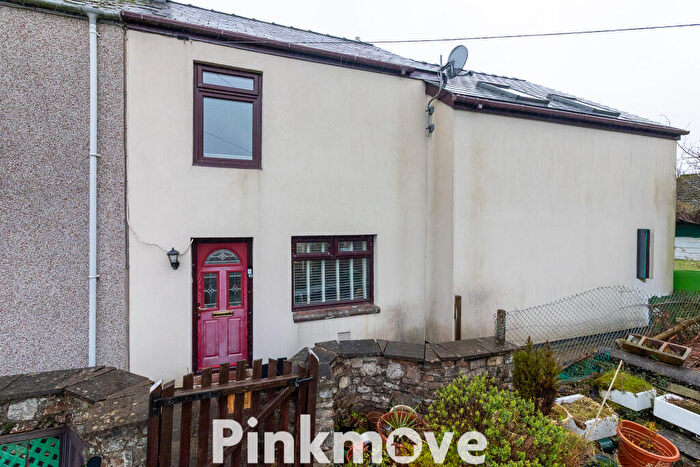
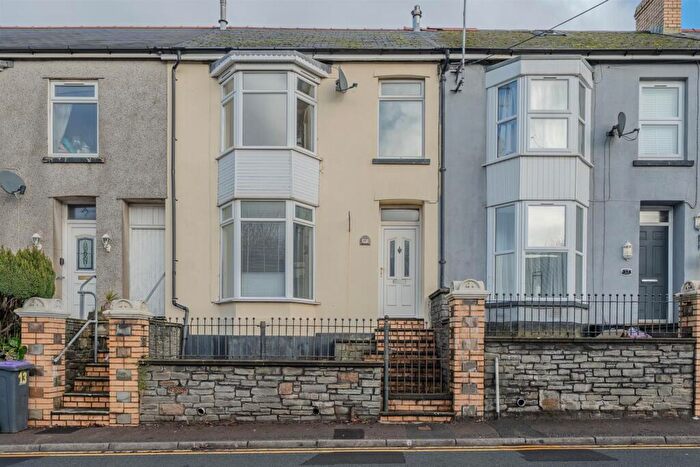
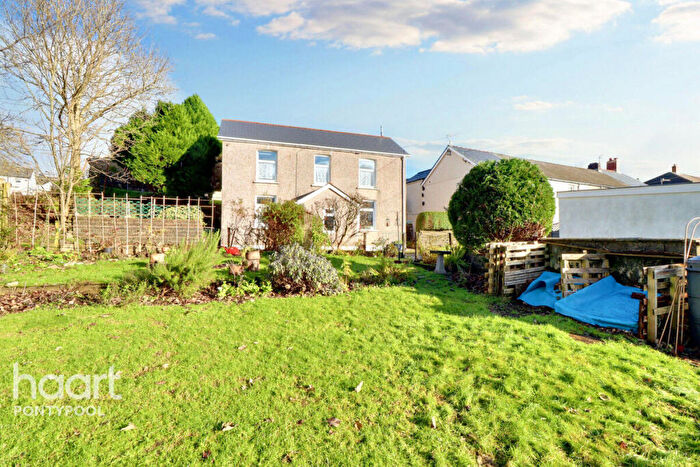
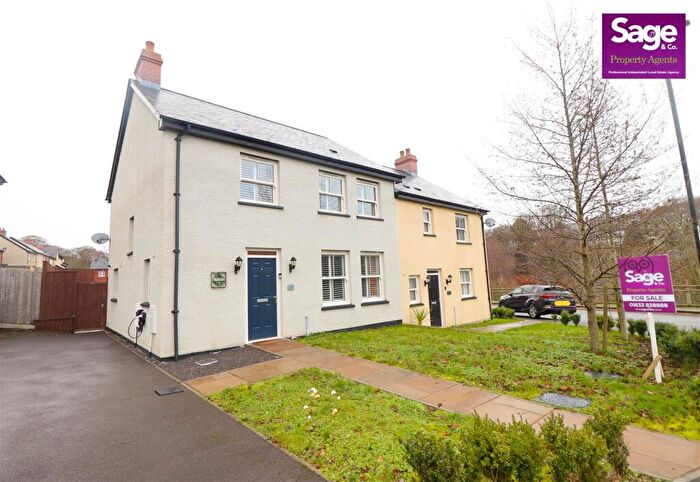
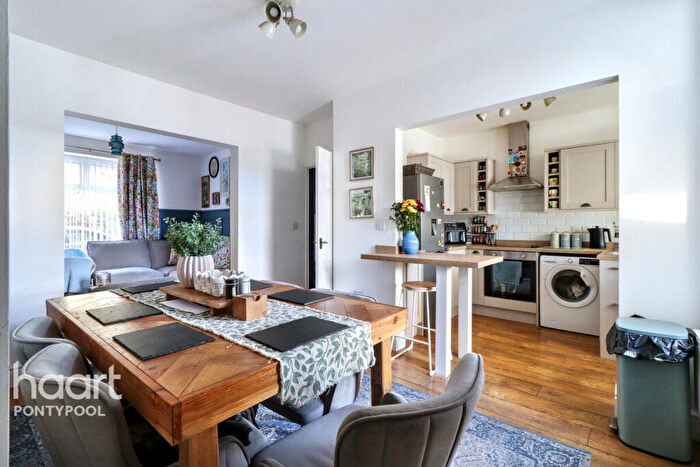
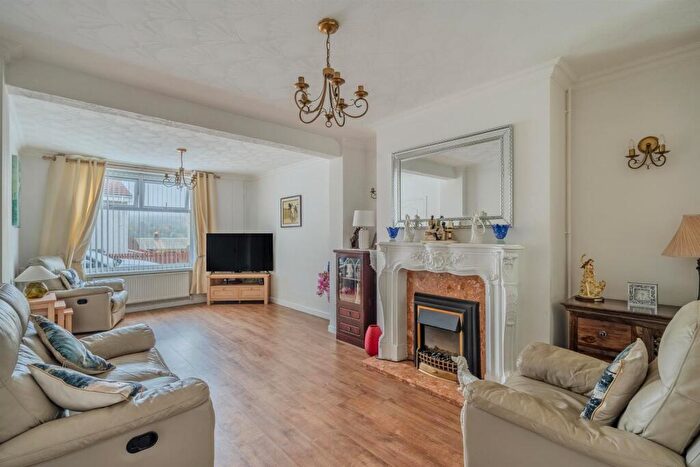
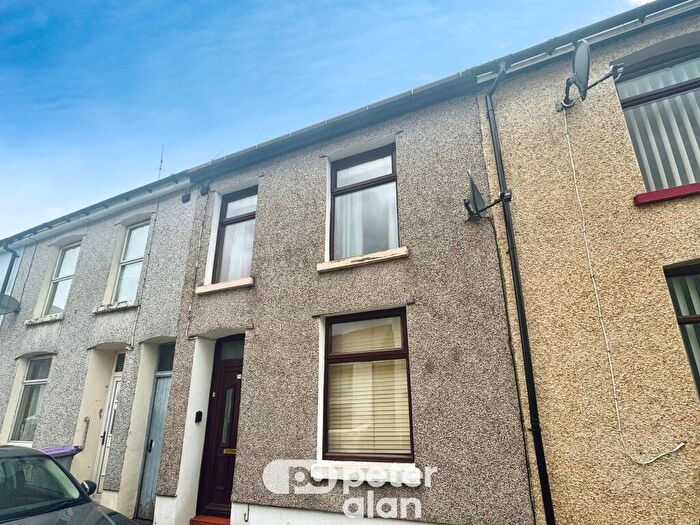
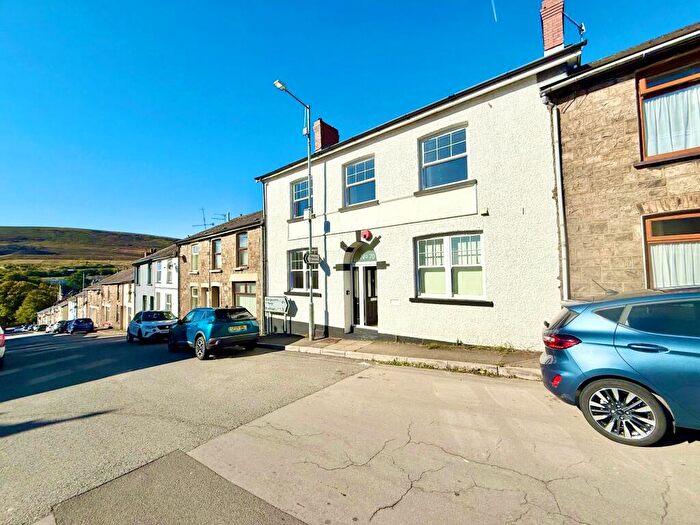
Properties for sale near NP4 9JQ, Francis Morris Estate
![]()
If you are looking to sell your house, let it out, or receive a property valuation, an expert can help you.
Click the button below to get started.
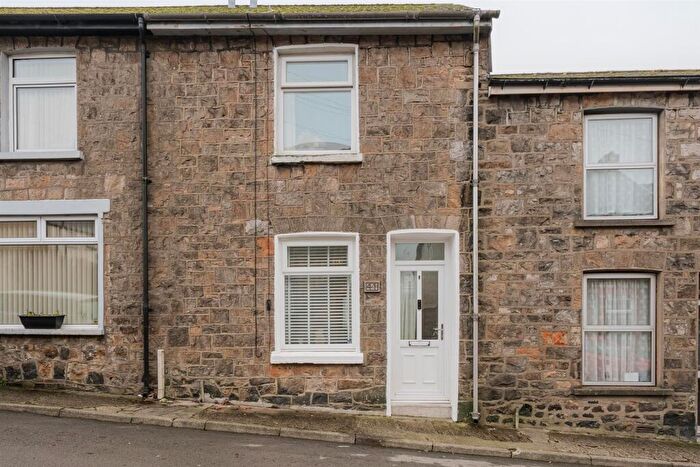
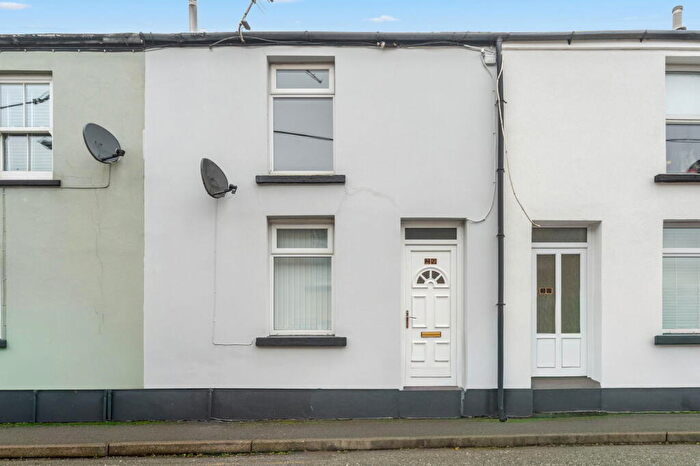
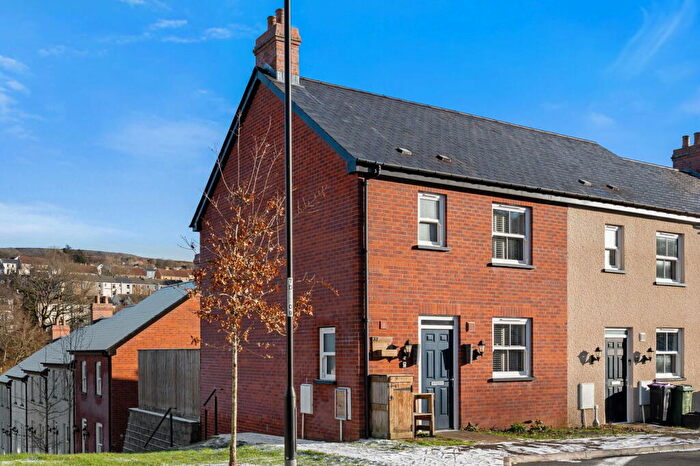
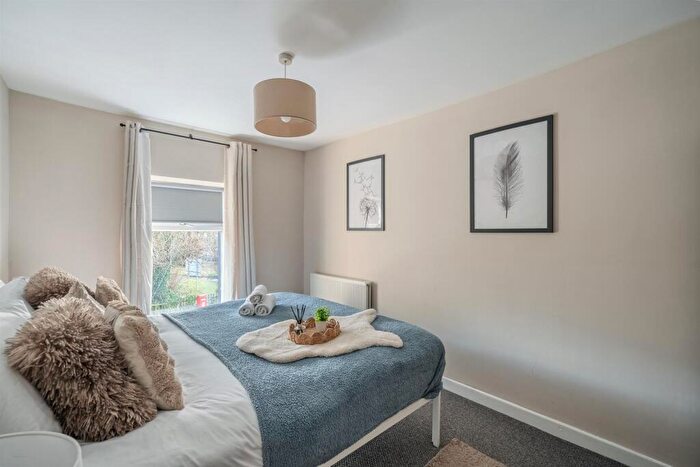
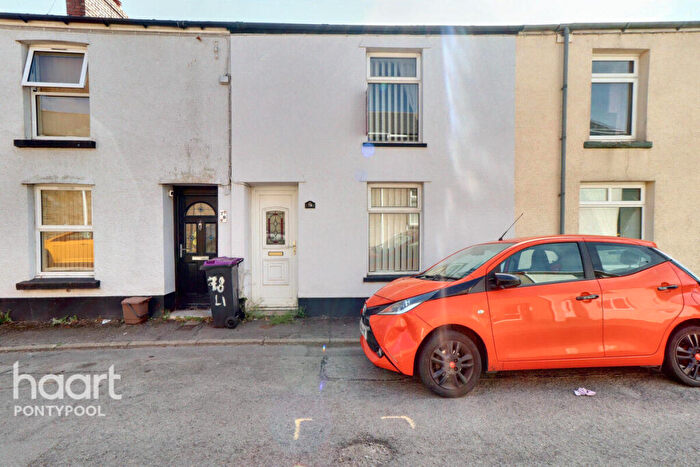
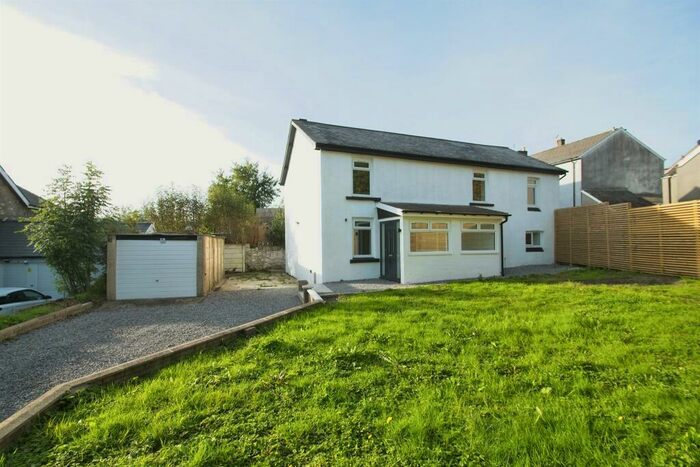
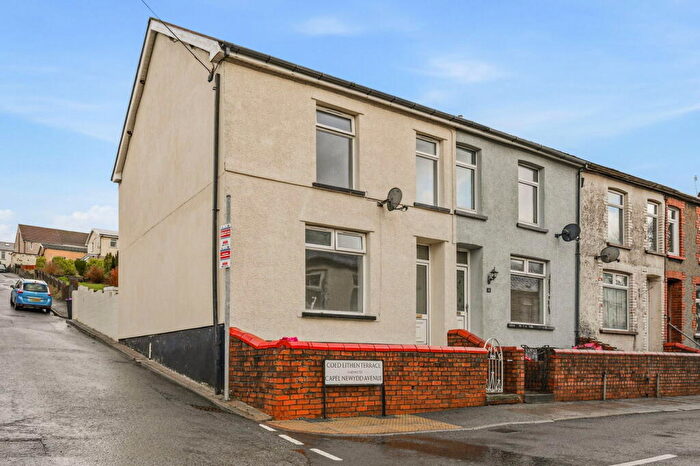
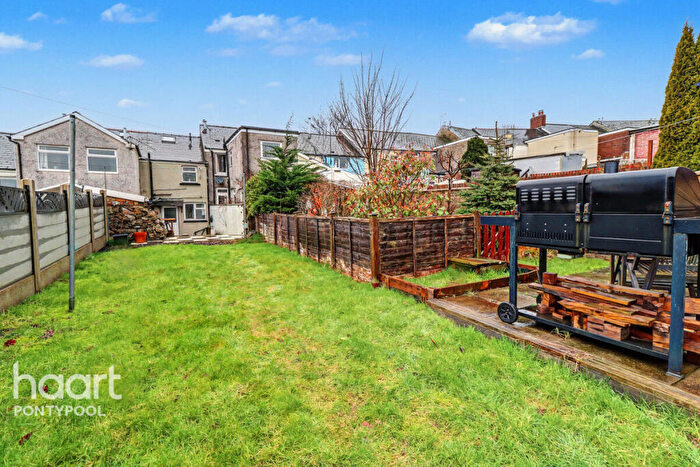
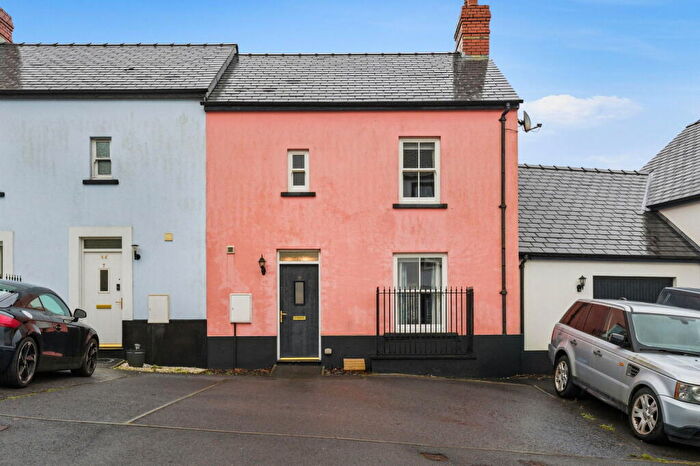
Previously listed properties near NP4 9JQ, Francis Morris Estate

Price Paid in Francis Morris Estate, NP4 9JQ, Blaenavon
1 Francis Morris Estate, NP4 9JQ, Blaenavon Pontypool
Property 1 has been sold 2 times. The last time it was sold was in 05/07/2011 and the sold price was £142,000.00.
This detached house, sold as a leasehold on 05/07/2011, is a 80 sqm detached bungalow with an EPC rating of D.
| Date | Price | Property Type | Tenure | Classification |
|---|---|---|---|---|
| 05/07/2011 | £142,000.00 | Detached House | leasehold | Established Building |
| 10/02/1995 | £40,000.00 | Detached House | leasehold | Established Building |
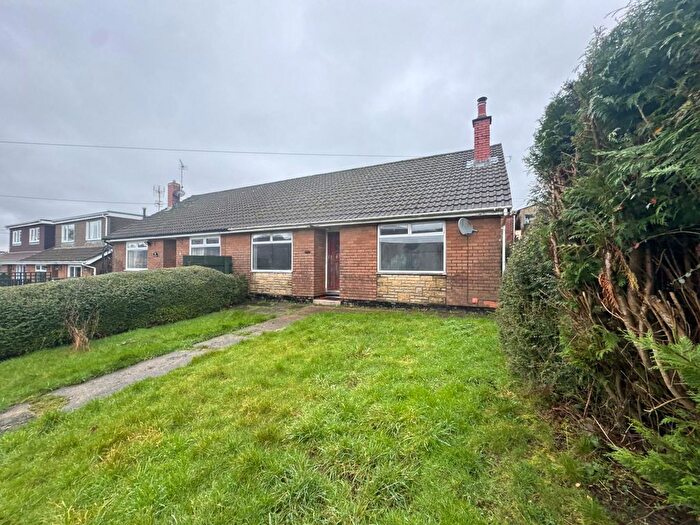
4 Francis Morris Estate, NP4 9JQ, Blaenavon Pontypool
Property 4 has been sold 2 times. The last time it was sold was in 21/09/2006 and the sold price was £183,000.00.
This semi detached house, sold as a freehold on 21/09/2006, is a 78 sqm semi-detached bungalow with an EPC rating of C.
| Date | Price | Property Type | Tenure | Classification |
|---|---|---|---|---|
| 21/09/2006 | £183,000.00 | Semi Detached House | freehold | Established Building |
| 08/02/2000 | £51,500.00 | Semi Detached House | freehold | Established Building |
Transport near NP4 9JQ, Francis Morris Estate
-
 Abergavenny Station
 -
Ebbw Vale Parkway Station
-
Ebbw Vale Town Station
-
Llanhilleth Station
-
Pontypool and New Inn Station
-
Brithdir Station
-
Newbridge Station
-
Tir-Phil Station
-
Cwmbran Station
-
Bargoed Station
House price paid reports for NP4 9JQ, Francis Morris Estate
Click on the buttons below to see price paid reports by year or property price:
- Price Paid By Year
Property Price Paid in NP4 9JQ, Francis Morris Estate by Year
The average sold property price by year was:
| Year | Average Sold Price | Price Change |
Sold Properties
|
|---|---|---|---|
| 2011 | £142,000 | -29% |
1 Property |
| 2006 | £183,000 | 72% |
1 Property |
| 2000 | £51,500 | 22% |
1 Property |
| 1995 | £40,000 | - |
1 Property |