
Houses for sale & to rent in Calderdale, England
House Prices in Calderdale
Properties in Calderdale have
an average house price of
£204k
and had 8,991 Property Transactions
within the last 3 years.¹
Calderdale is a location in
England with
88,451 households², where the most expensive property was sold for £2.15M.
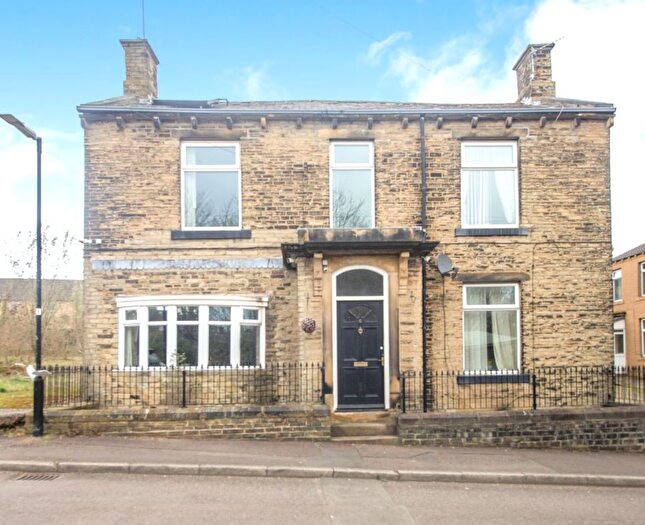
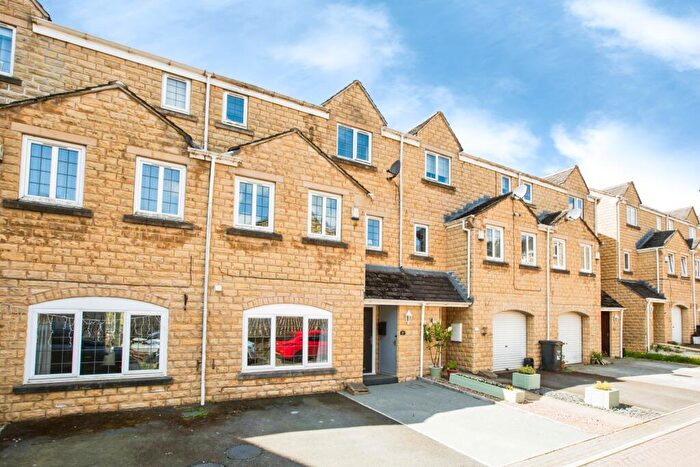
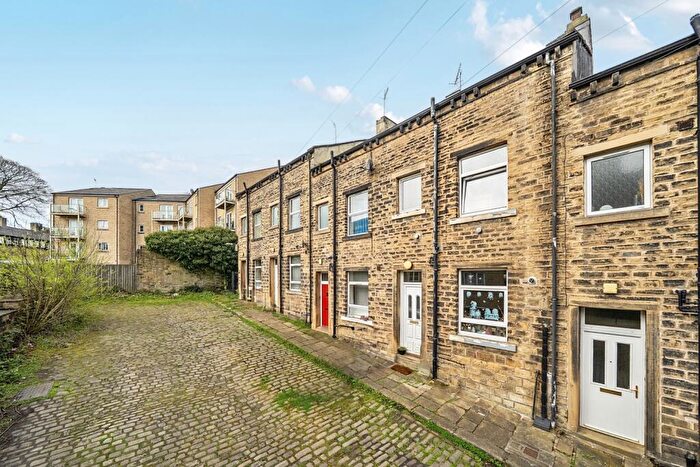
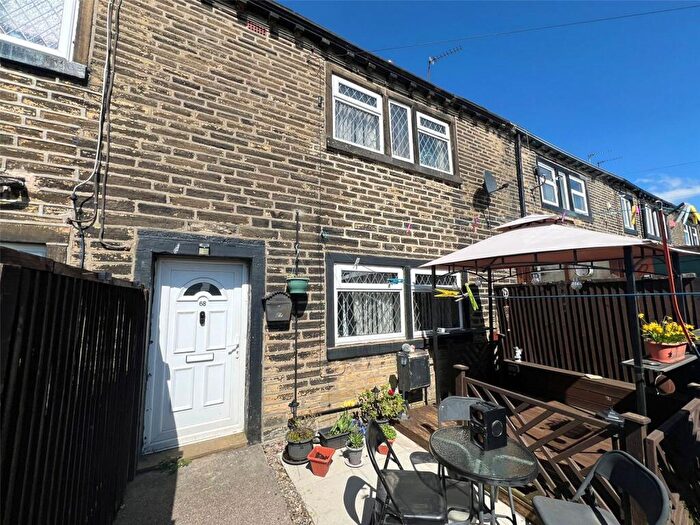
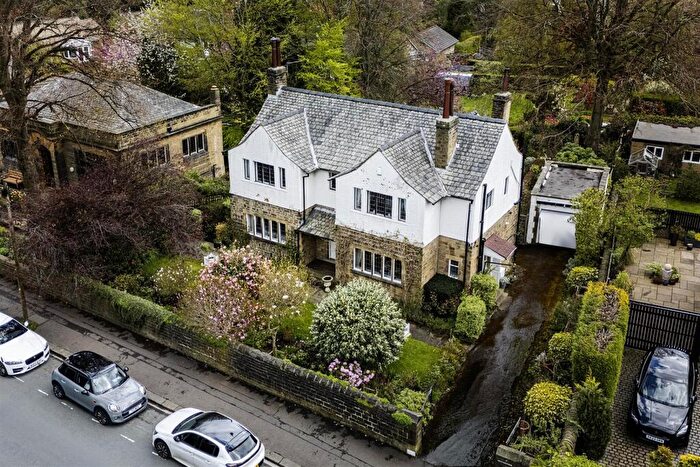
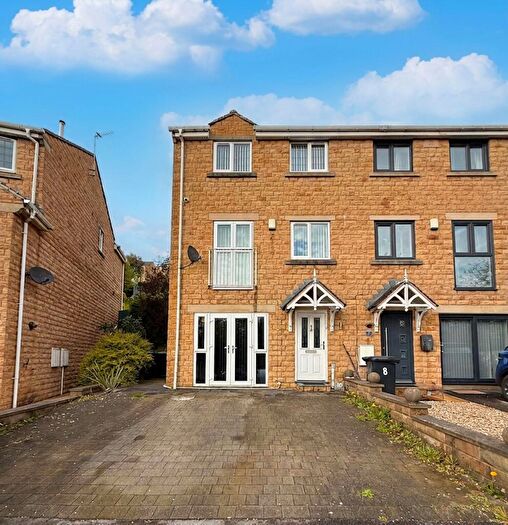
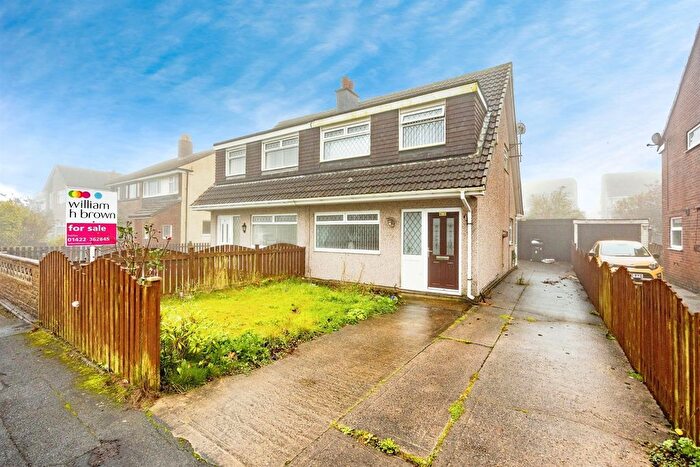
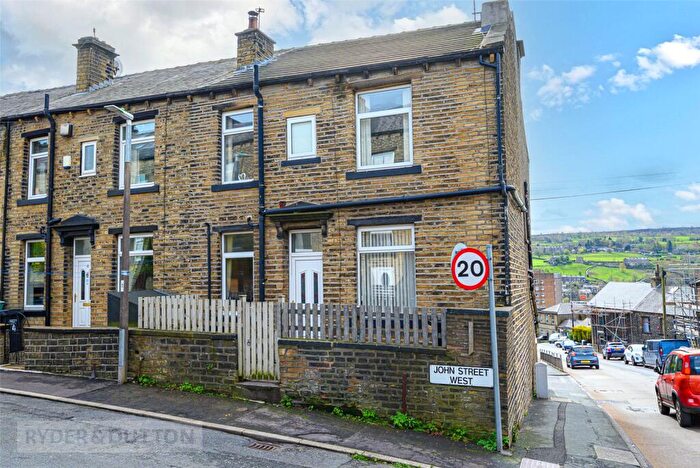
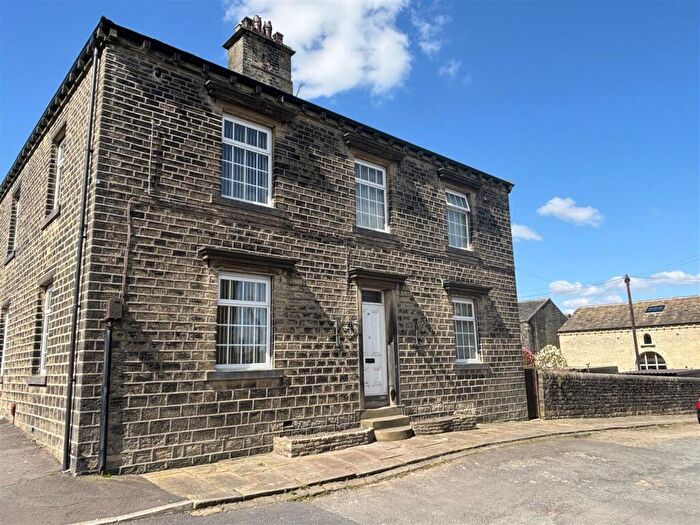
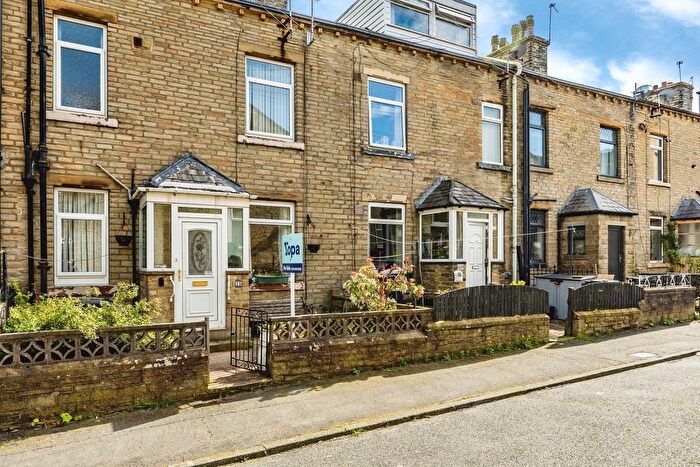
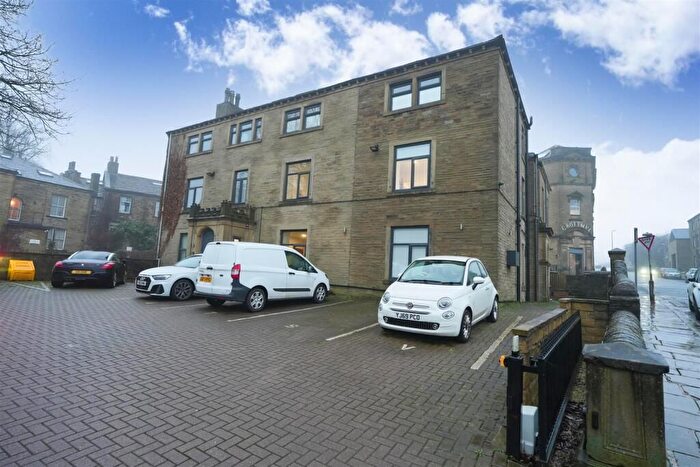
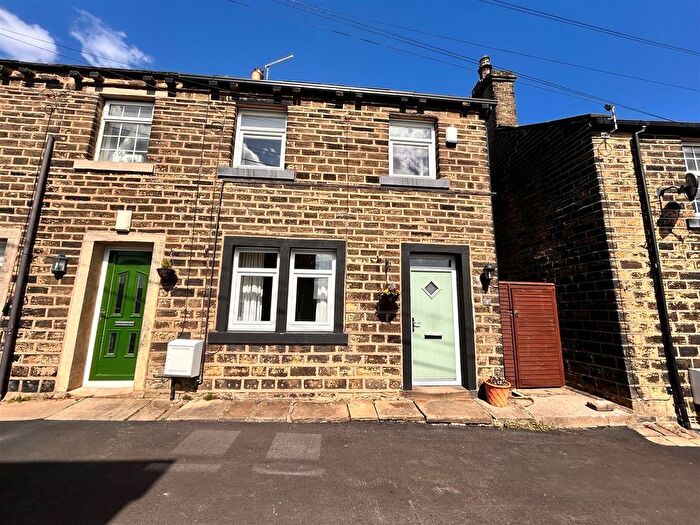
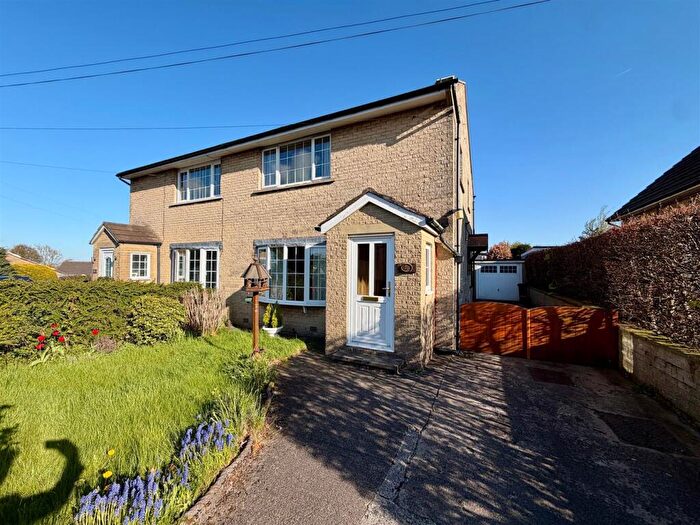
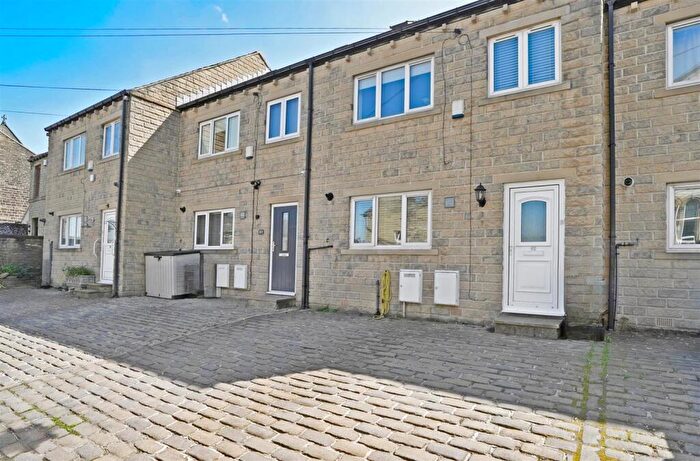
Properties for sale in Calderdale
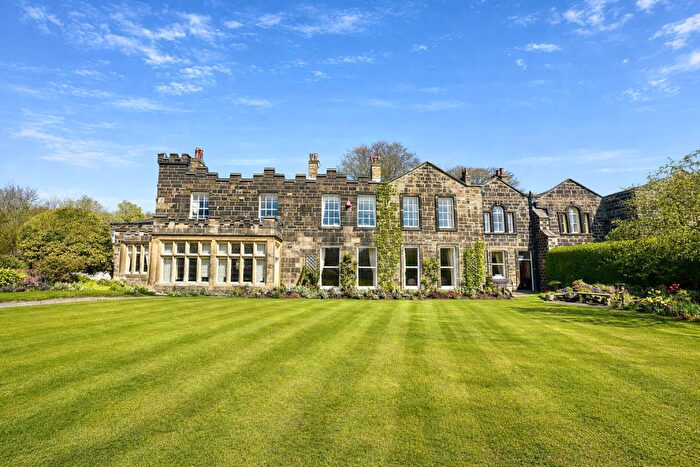
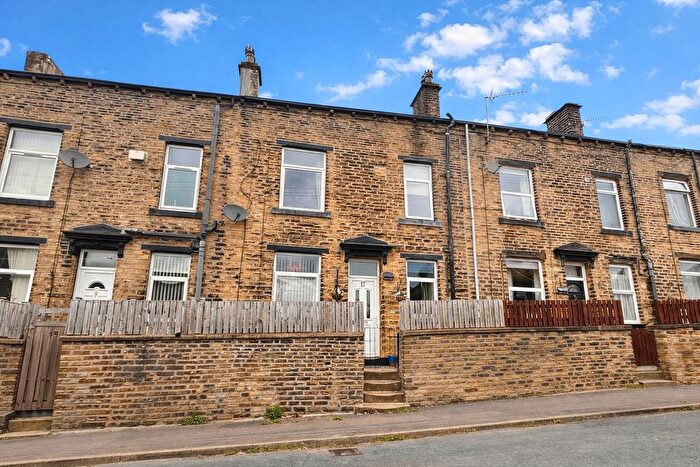

![]()
If you are looking to sell your house, let it out, or receive a property valuation, an expert can help you.
Click the button below to get started.

Towns in Calderdale
Navigate through our locations to find the location of your next house in Calderdale, England for sale or to rent.
Transport in Calderdale
Please see below transportation links in this area:

- FAQ
- Price Paid By Year
- Property Type Price
Frequently asked questions about Calderdale
What is the average price for a property for sale in Calderdale?
The average price for a property for sale in Calderdale is £203,822. This amount is 43% lower than the average price in England. There are more than 10,000 property listings for sale in Calderdale.
What locations have the most expensive properties for sale in Calderdale?
The locations with the most expensive properties for sale in Calderdale are Bradford at an average of £354,333, Huddersfield at an average of £267,930 and Hebden Bridge at an average of £263,164.
What locations have the most affordable properties for sale in Calderdale?
The locations with the most affordable properties for sale in Calderdale are Elland at an average of £189,704, Halifax at an average of £192,848 and Brighouse at an average of £204,369.
Which train stations are available in or near Calderdale?
Some of the train stations available in or near Calderdale are Sowerby Bridge, Halifax and Mytholmroyd.
Property Price Paid in Calderdale by Year
The average sold property price by year was:
| Year | Average Sold Price | Price Change |
Sold Properties
|
|---|---|---|---|
| 2026 | £218,582 | 1% |
54 Properties |
| 2025 | £216,135 | 7% |
2,934 Properties |
| 2024 | £200,097 | 2% |
3,037 Properties |
| 2023 | £195,187 | 1% |
2,966 Properties |
| 2022 | £193,372 | 2% |
3,492 Properties |
| 2021 | £189,402 | 8% |
4,399 Properties |
| 2020 | £173,605 | 2% |
2,931 Properties |
| 2019 | £169,847 | 5% |
3,484 Properties |
| 2018 | £162,119 | 3% |
3,811 Properties |
| 2017 | £157,248 | 0,2% |
3,582 Properties |
| 2016 | £156,857 | 4% |
3,470 Properties |
| 2015 | £150,035 | 5% |
3,504 Properties |
| 2014 | £143,126 | 3% |
3,542 Properties |
| 2013 | £139,048 | -0,1% |
2,848 Properties |
| 2012 | £139,138 | -0,4% |
2,313 Properties |
| 2011 | £139,721 | -6% |
2,212 Properties |
| 2010 | £148,711 | 5% |
2,346 Properties |
| 2009 | £141,120 | -3% |
2,287 Properties |
| 2008 | £145,669 | -3% |
2,741 Properties |
| 2007 | £149,518 | 7% |
5,266 Properties |
| 2006 | £138,972 | 7% |
5,817 Properties |
| 2005 | £129,275 | 11% |
4,911 Properties |
| 2004 | £114,658 | 19% |
5,355 Properties |
| 2003 | £92,919 | 22% |
5,271 Properties |
| 2002 | £72,720 | 10% |
5,144 Properties |
| 2001 | £65,371 | 9% |
4,587 Properties |
| 2000 | £59,322 | 7% |
4,217 Properties |
| 1999 | £55,362 | 1% |
4,033 Properties |
| 1998 | £54,669 | 5% |
3,759 Properties |
| 1997 | £52,102 | 7% |
3,622 Properties |
| 1996 | £48,517 | 1% |
3,229 Properties |
| 1995 | £47,922 | - |
3,215 Properties |
Property Price per Property Type in Calderdale
Here you can find historic sold price data in order to help with your property search.
The average Property Paid Price for specific property types in the last three years are:
| Property Type | Average Sold Price | Sold Properties |
|---|---|---|
| Semi Detached House | £225,215.00 | 2,324 Semi Detached Houses |
| Terraced House | £156,665.00 | 4,716 Terraced Houses |
| Detached House | £413,645.00 | 1,094 Detached Houses |
| Flat | £137,459.00 | 857 Flats |