
Houses for sale & to rent in Leeds, England
House Prices in Leeds
Properties in Leeds have
an average house price of
£260k
and had 31,135 Property Transactions
within the last 3 years.¹
Leeds is a location in
England with
320,379 households², where the most expensive property was sold for £3.25M.
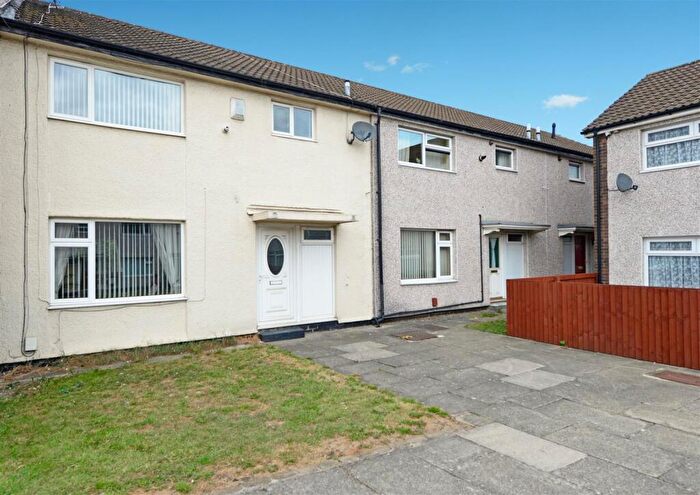
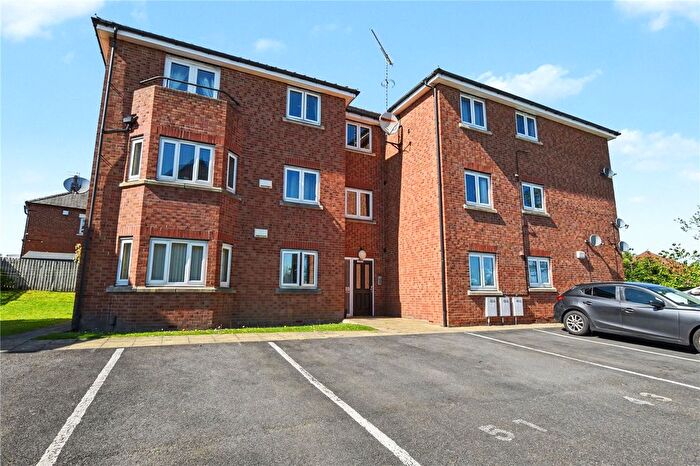
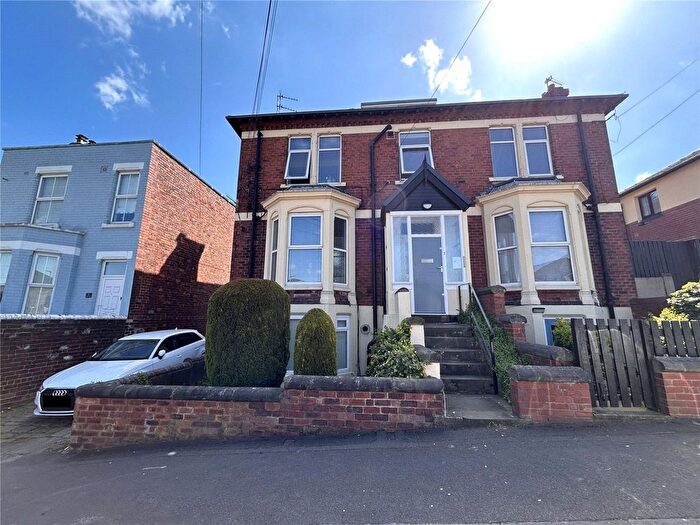
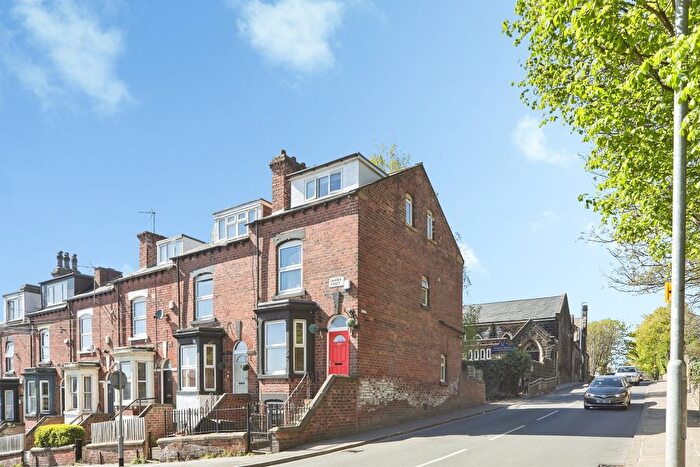
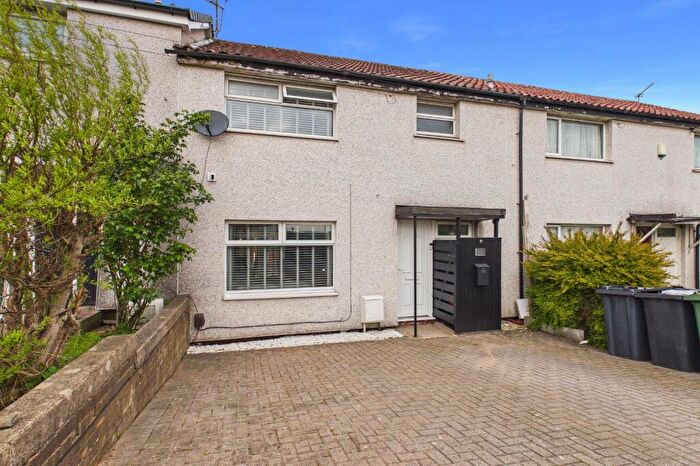
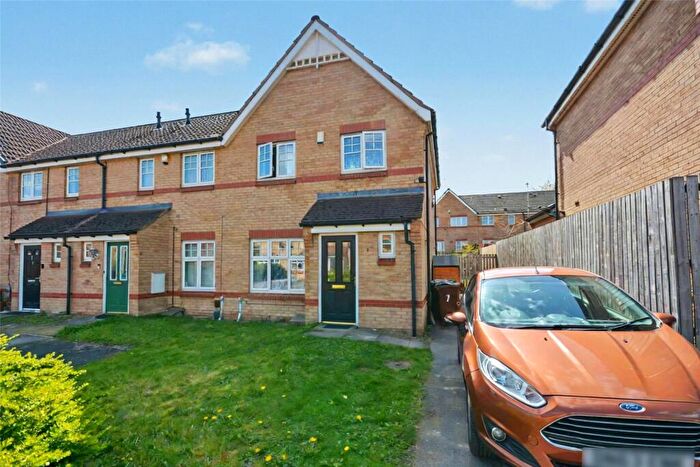
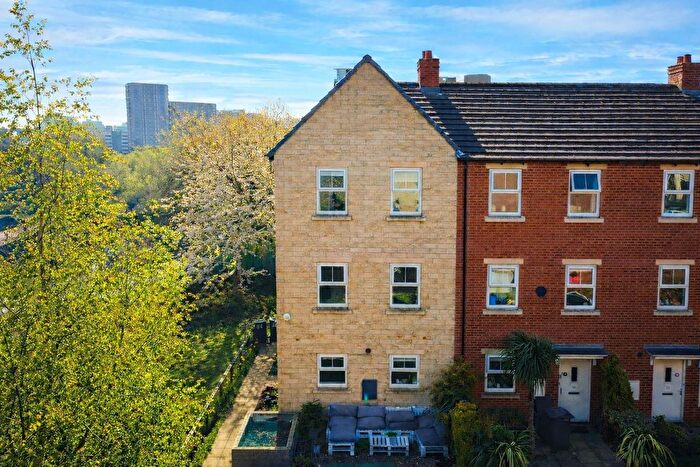
Properties for sale in Leeds
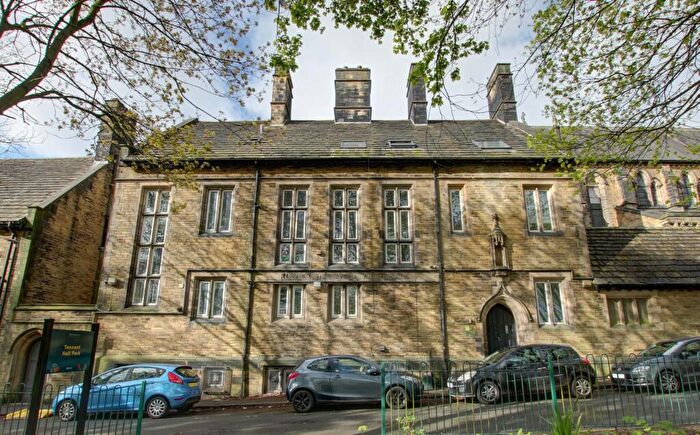
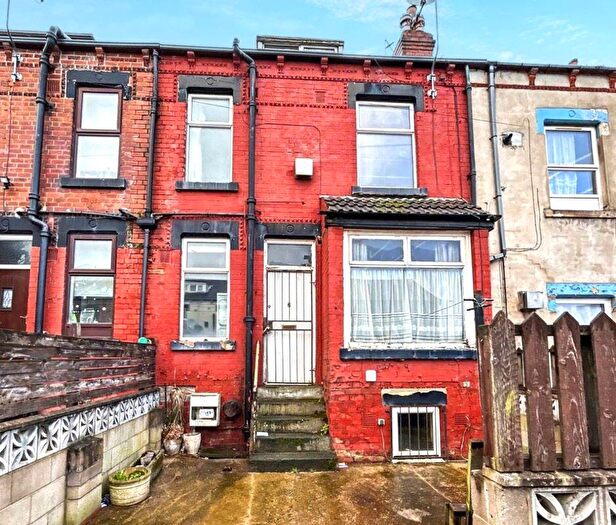
![]()
If you are looking to sell your house, let it out, or receive a property valuation, an expert can help you.
Click the button below to get started.

Towns in Leeds
Navigate through our locations to find the location of your next house in Leeds, England for sale or to rent.
Transport in Leeds
Please see below transportation links in this area:

- FAQ
- Price Paid By Year
- Property Type Price
Frequently asked questions about Leeds
What is the average price for a property for sale in Leeds?
The average price for a property for sale in Leeds is £260,484. This amount is 27% lower than the average price in England. There are more than 10,000 property listings for sale in Leeds.
What locations have the most expensive properties for sale in Leeds?
The locations with the most expensive properties for sale in Leeds are Wetherby at an average of £437,424, Otley at an average of £310,747 and Ilkley at an average of £297,543.
What locations have the most affordable properties for sale in Leeds?
The locations with the most affordable properties for sale in Leeds are Dewsbury at an average of £194,883, Castleford at an average of £206,139 and Batley at an average of £219,750.
Which train stations are available in or near Leeds?
Some of the train stations available in or near Leeds are Leeds, Burley Park and Headingley.
Property Price Paid in Leeds by Year
The average sold property price by year was:
| Year | Average Sold Price | Price Change |
Sold Properties
|
|---|---|---|---|
| 2026 | £264,560 | -1% |
692 Properties |
| 2025 | £267,521 | 3% |
9,910 Properties |
| 2024 | £260,702 | 3% |
10,766 Properties |
| 2023 | £252,814 | -2% |
9,767 Properties |
| 2022 | £257,146 | 5% |
11,740 Properties |
| 2021 | £244,428 | 7% |
14,622 Properties |
| 2020 | £227,822 | 7% |
11,402 Properties |
| 2019 | £210,777 | 3% |
13,481 Properties |
| 2018 | £204,194 | 3% |
13,599 Properties |
| 2017 | £197,914 | 4% |
13,896 Properties |
| 2016 | £190,576 | 5% |
13,806 Properties |
| 2015 | £181,426 | 4% |
13,231 Properties |
| 2014 | £173,581 | 1% |
12,969 Properties |
| 2013 | £171,393 | 1% |
10,493 Properties |
| 2012 | £169,261 | 2% |
8,128 Properties |
| 2011 | £166,426 | -3% |
7,860 Properties |
| 2010 | £172,043 | 8% |
8,077 Properties |
| 2009 | £159,046 | -5% |
8,121 Properties |
| 2008 | £166,588 | -3% |
8,683 Properties |
| 2007 | £170,873 | 4% |
17,730 Properties |
| 2006 | £163,410 | 6% |
19,254 Properties |
| 2005 | £152,834 | 7% |
14,642 Properties |
| 2004 | £142,695 | 14% |
17,312 Properties |
| 2003 | £122,923 | 18% |
17,607 Properties |
| 2002 | £100,535 | 16% |
18,080 Properties |
| 2001 | £84,152 | 8% |
15,933 Properties |
| 2000 | £77,301 | 9% |
14,946 Properties |
| 1999 | £70,351 | 8% |
15,646 Properties |
| 1998 | £64,471 | 5% |
13,385 Properties |
| 1997 | £61,039 | 5% |
13,429 Properties |
| 1996 | £57,718 | 2% |
11,761 Properties |
| 1995 | £56,709 | - |
10,243 Properties |
Property Price per Property Type in Leeds
Here you can find historic sold price data in order to help with your property search.
The average Property Paid Price for specific property types in the last three years are:
| Property Type | Average Sold Price | Sold Properties |
|---|---|---|
| Semi Detached House | £267,668.00 | 11,806 Semi Detached Houses |
| Terraced House | £197,942.00 | 10,398 Terraced Houses |
| Detached House | £478,123.00 | 4,541 Detached Houses |
| Flat | £164,174.00 | 4,390 Flats |