
Houses for sale & to rent in Suffolk, England
House Prices in Suffolk
Properties in Suffolk have
an average house price of
£319k
and had 31,229 Property Transactions
within the last 3 years.¹
Suffolk is a location in
England with
310,571 households², where the most expensive property was sold for £3.88M.
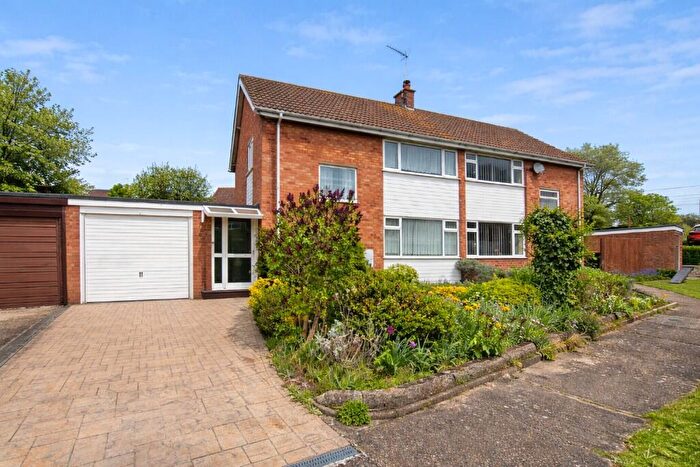
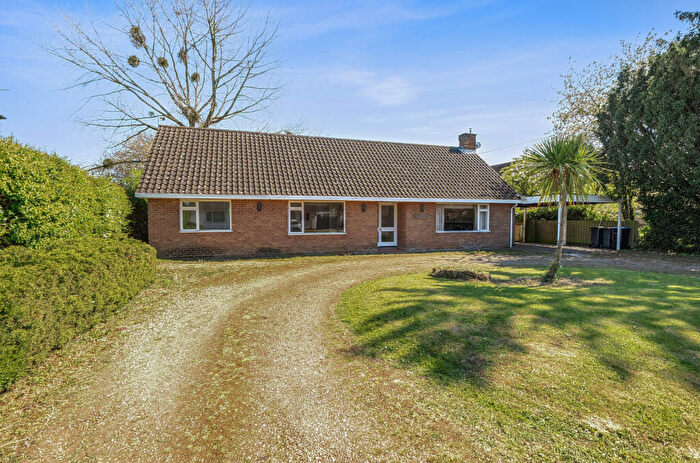
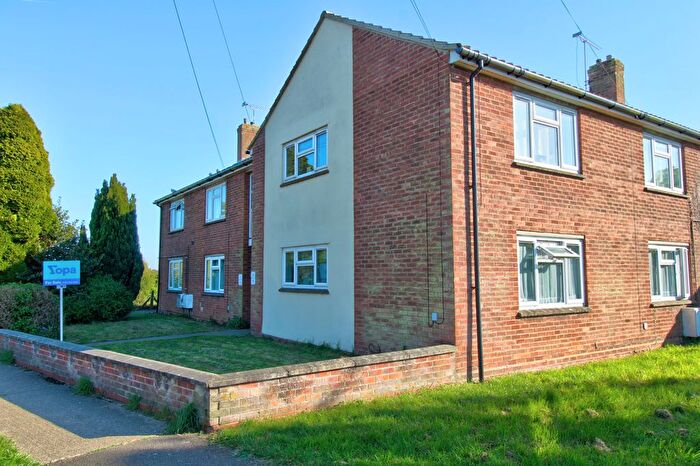
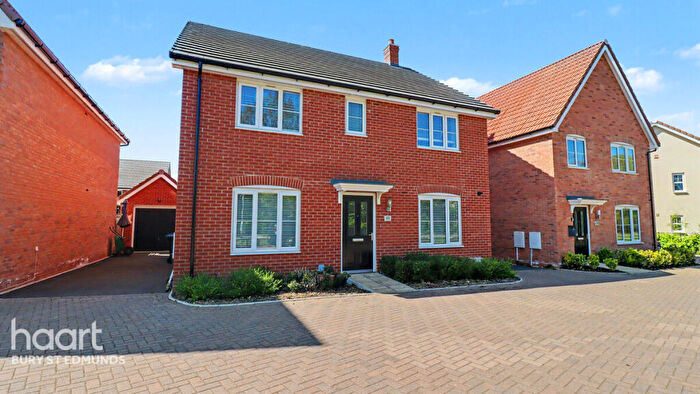
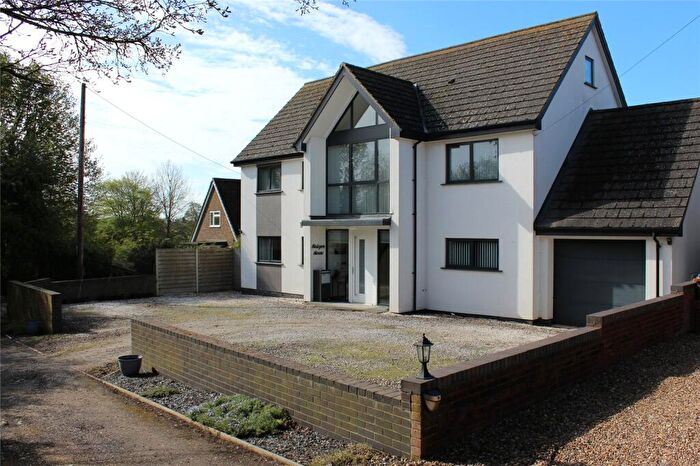
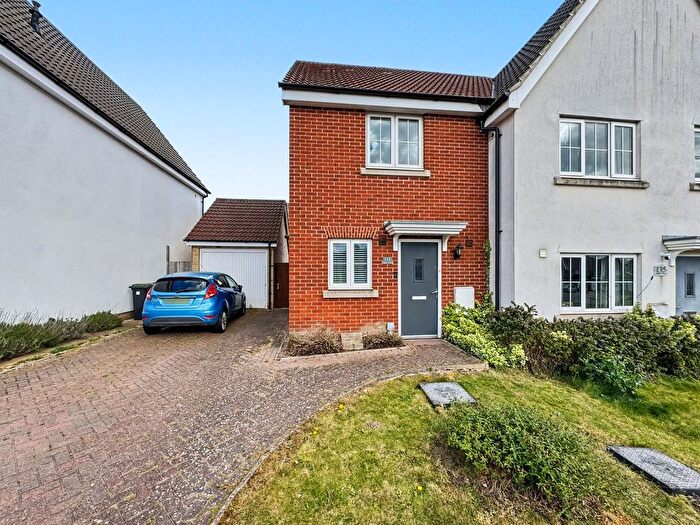
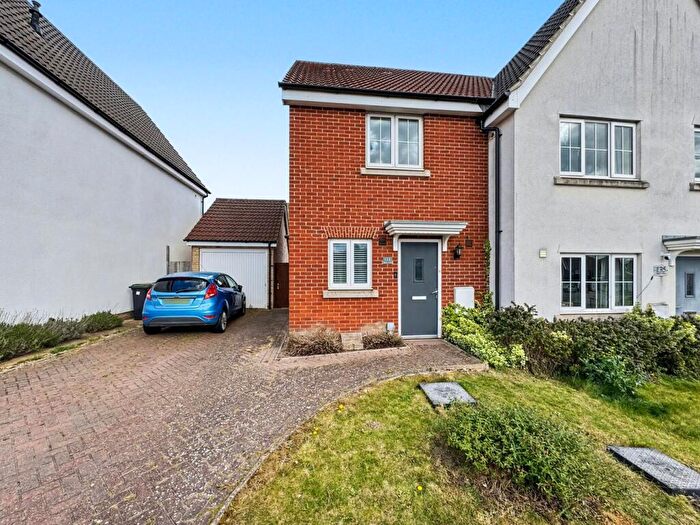
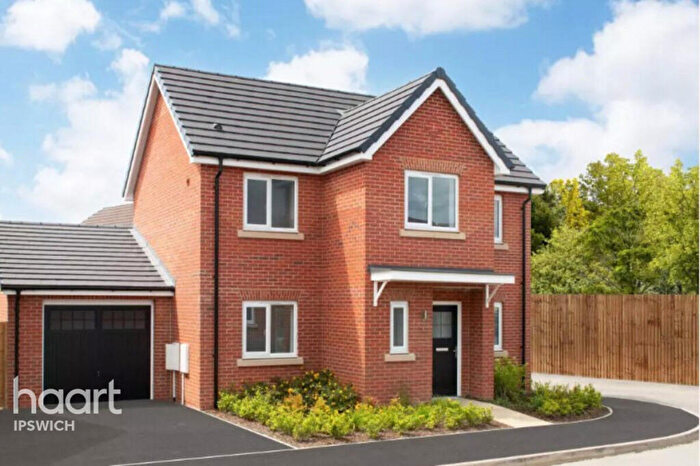
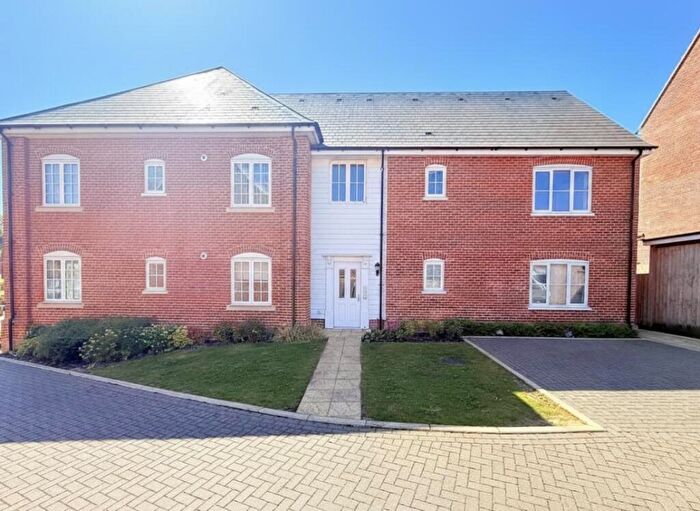
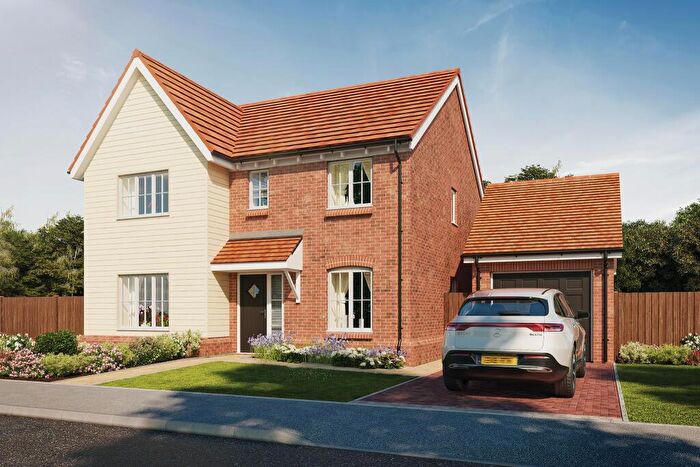
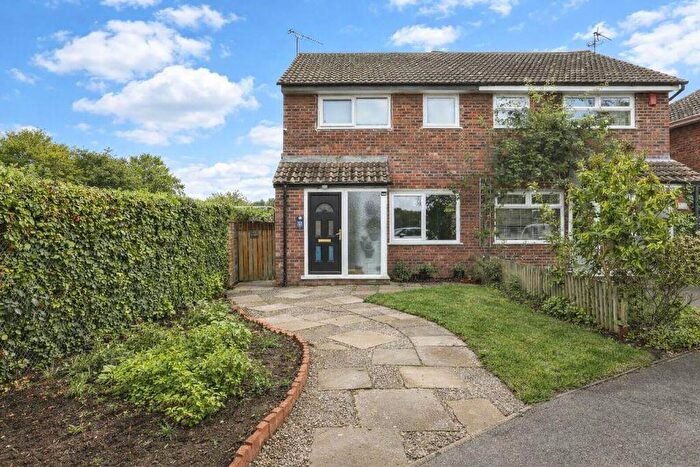
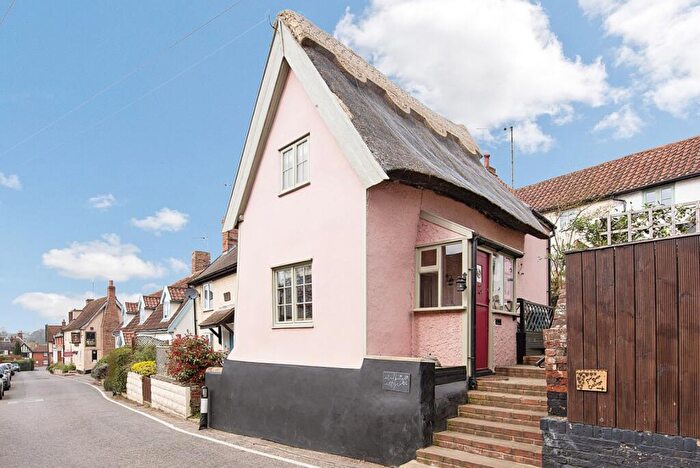
Properties for sale in Suffolk
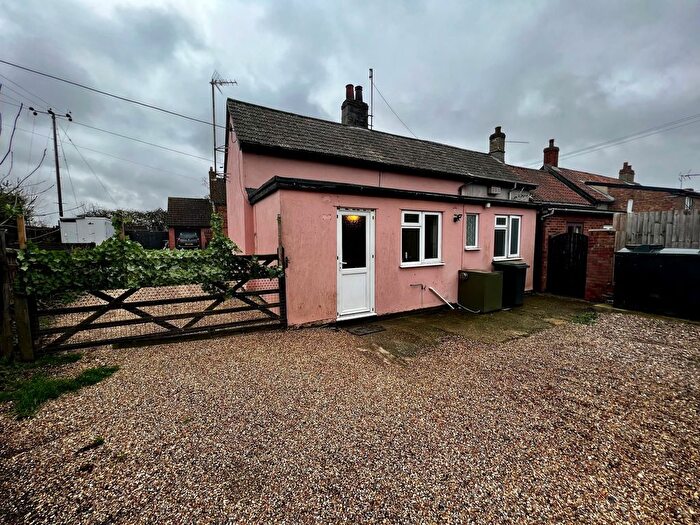
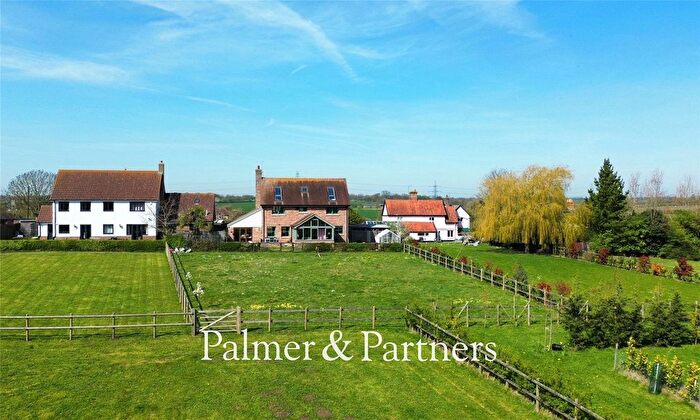

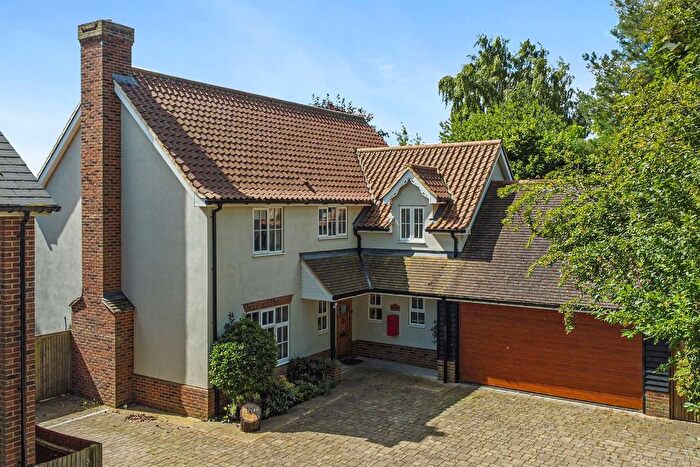
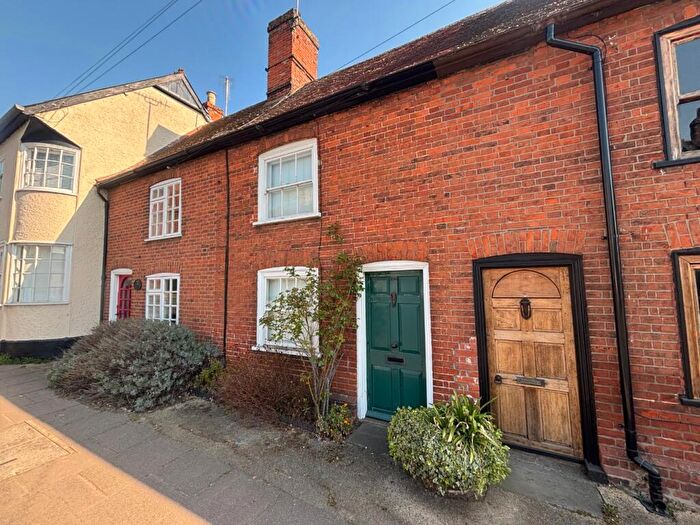
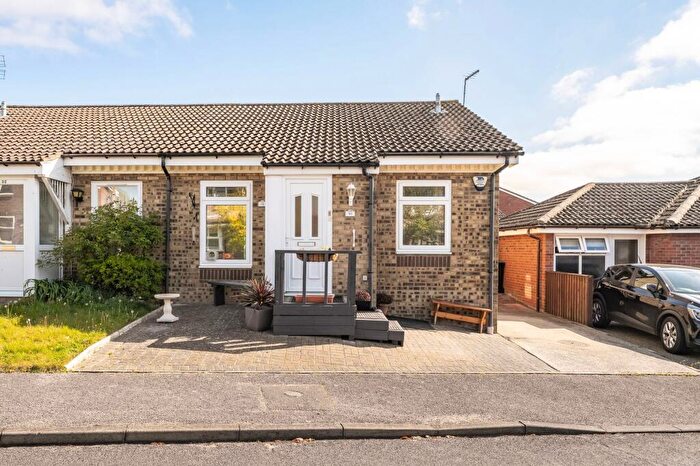
![]()
If you are looking to sell your house, let it out, or receive a property valuation, an expert can help you.
Click the button below to get started.

Towns in Suffolk
Navigate through our locations to find the location of your next house in Suffolk, England for sale or to rent.
Transport in Suffolk
Please see below transportation links in this area:

- FAQ
- Price Paid By Year
- Property Type Price
Frequently asked questions about Suffolk
What is the average price for a property for sale in Suffolk?
The average price for a property for sale in Suffolk is £319,058. This amount is 11% lower than the average price in England. There are more than 10,000 property listings for sale in Suffolk.
What locations have the most expensive properties for sale in Suffolk?
The locations with the most expensive properties for sale in Suffolk are Aldeburgh at an average of £661,786, Southwold at an average of £615,586 and Colchester at an average of £484,646.
What locations have the most affordable properties for sale in Suffolk?
The locations with the most affordable properties for sale in Suffolk are Lowestoft at an average of £232,651, Great Yarmouth at an average of £236,250 and Brandon at an average of £238,539.
Which train stations are available in or near Suffolk?
Some of the train stations available in or near Suffolk are Needham Market, Stowmarket and Westerfield.
Property Price Paid in Suffolk by Year
The average sold property price by year was:
| Year | Average Sold Price | Price Change |
Sold Properties
|
|---|---|---|---|
| 2026 | £300,368 | -6% |
822 Properties |
| 2025 | £319,592 | 2% |
10,224 Properties |
| 2024 | £312,971 | -4% |
10,541 Properties |
| 2023 | £326,739 | -1% |
9,642 Properties |
| 2022 | £330,272 | 5% |
12,231 Properties |
| 2021 | £312,136 | 6% |
16,053 Properties |
| 2020 | £292,683 | 6% |
11,567 Properties |
| 2019 | £276,045 | 1% |
12,615 Properties |
| 2018 | £274,220 | 3% |
13,159 Properties |
| 2017 | £266,657 | 8% |
13,738 Properties |
| 2016 | £246,303 | 5% |
14,238 Properties |
| 2015 | £233,955 | 7% |
14,234 Properties |
| 2014 | £217,595 | 5% |
14,545 Properties |
| 2013 | £206,631 | 2% |
11,953 Properties |
| 2012 | £201,747 | 0,3% |
10,471 Properties |
| 2011 | £201,096 | -2% |
10,141 Properties |
| 2010 | £205,995 | 10% |
10,364 Properties |
| 2009 | £185,187 | -8% |
10,516 Properties |
| 2008 | £200,334 | -1% |
9,346 Properties |
| 2007 | £203,049 | 7% |
17,627 Properties |
| 2006 | £188,558 | 6% |
19,177 Properties |
| 2005 | £177,709 | 4% |
15,371 Properties |
| 2004 | £170,828 | 13% |
16,755 Properties |
| 2003 | £148,781 | 13% |
16,835 Properties |
| 2002 | £129,710 | 19% |
17,882 Properties |
| 2001 | £105,681 | 12% |
17,617 Properties |
| 2000 | £92,590 | 13% |
15,653 Properties |
| 1999 | £80,533 | 10% |
17,199 Properties |
| 1998 | £72,757 | 7% |
14,995 Properties |
| 1997 | £67,942 | 9% |
15,652 Properties |
| 1996 | £61,874 | 2% |
13,813 Properties |
| 1995 | £60,528 | - |
11,422 Properties |
Property Price per Property Type in Suffolk
Here you can find historic sold price data in order to help with your property search.
The average Property Paid Price for specific property types in the last three years are:
| Property Type | Average Sold Price | Sold Properties |
|---|---|---|
| Semi Detached House | £283,116.00 | 9,042 Semi Detached Houses |
| Terraced House | £237,427.00 | 8,858 Terraced Houses |
| Detached House | £456,974.00 | 10,626 Detached Houses |
| Flat | £164,631.00 | 2,703 Flats |