
Houses for sale & to rent in Norfolk, England
House Prices in Norfolk
Properties in Norfolk have
an average house price of
£299k
and had 39,380 Property Transactions
within the last 3 years.¹
Norfolk is a location in
England with
372,103 households², where the most expensive property was sold for £6M.
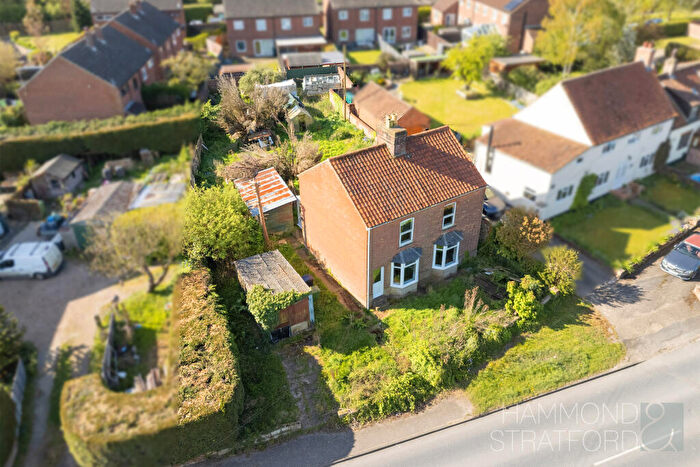
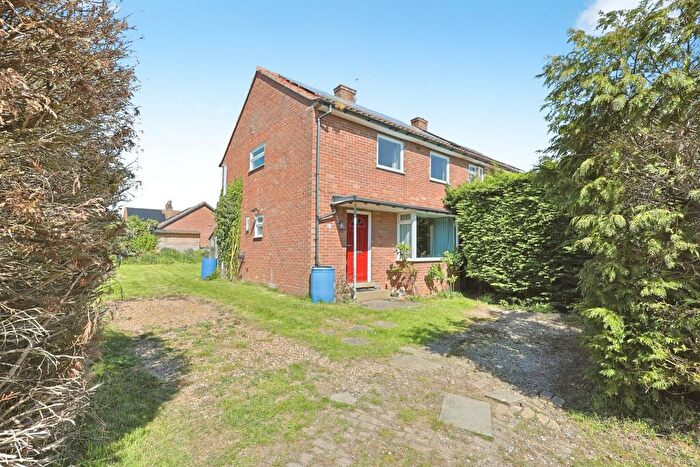
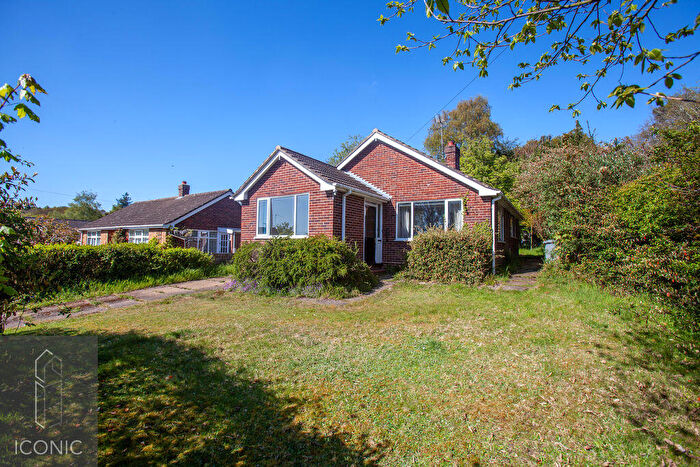
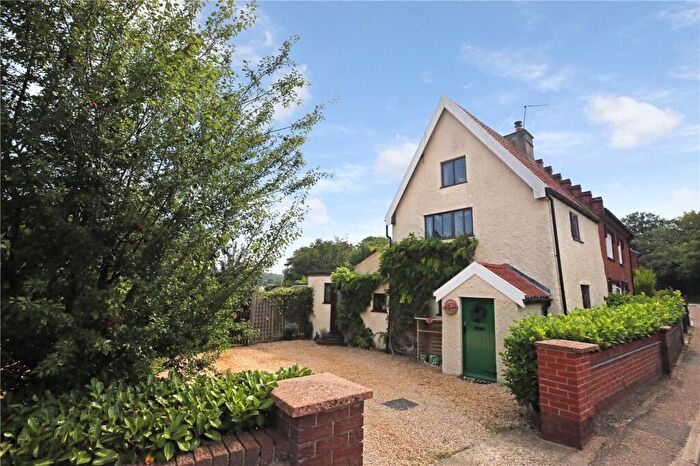
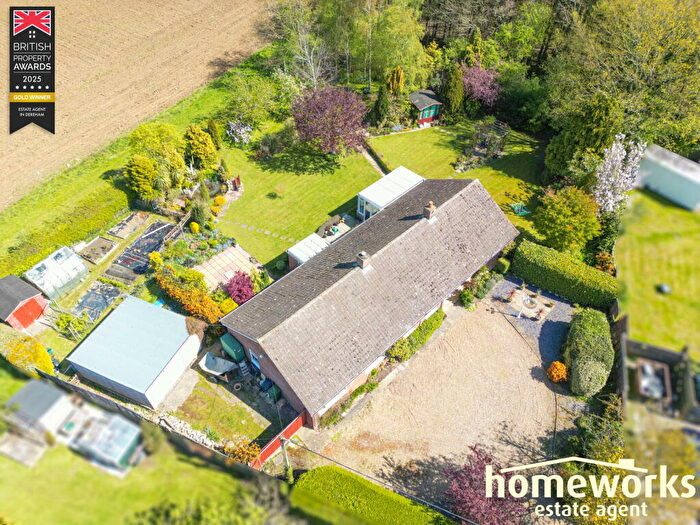
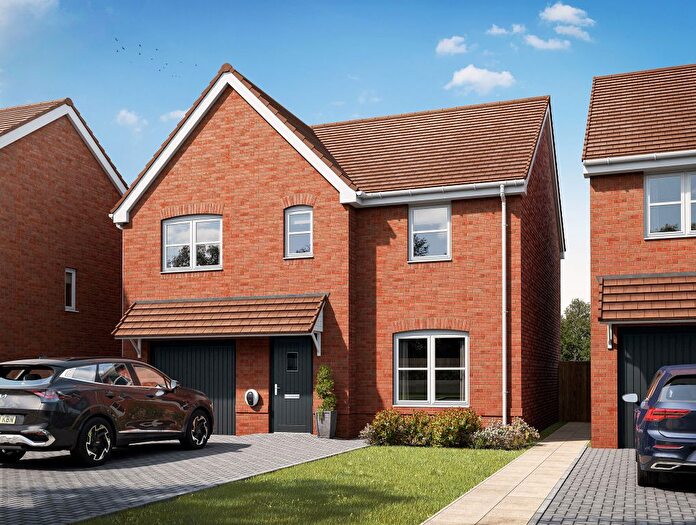
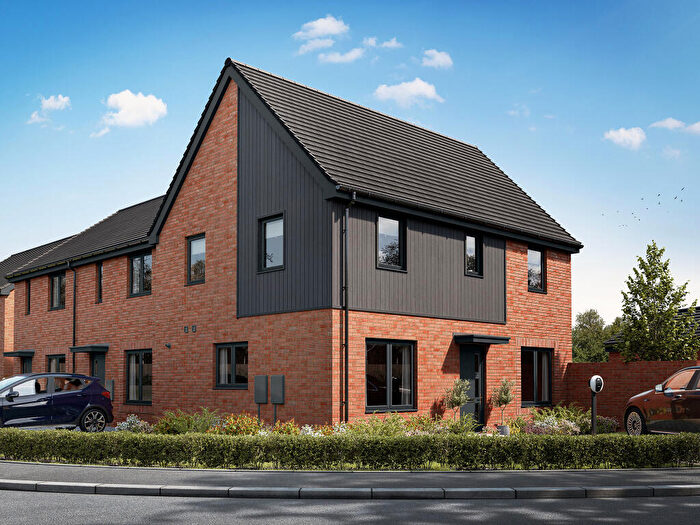
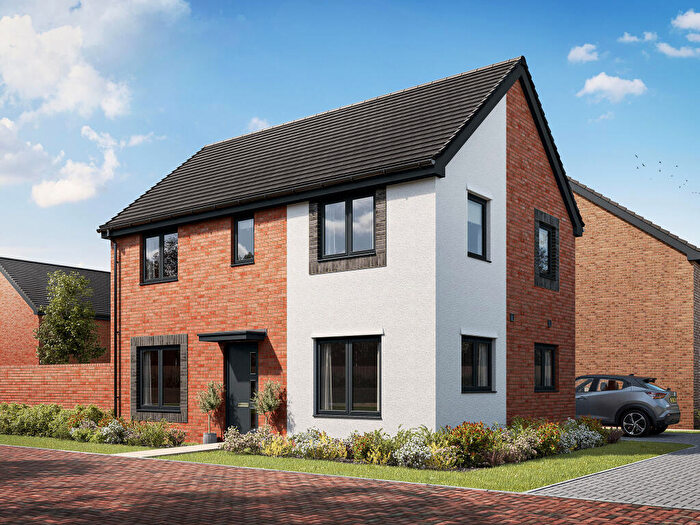
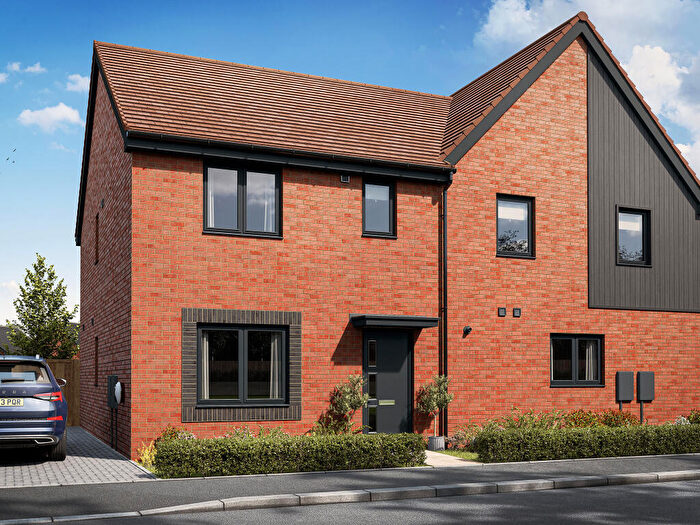
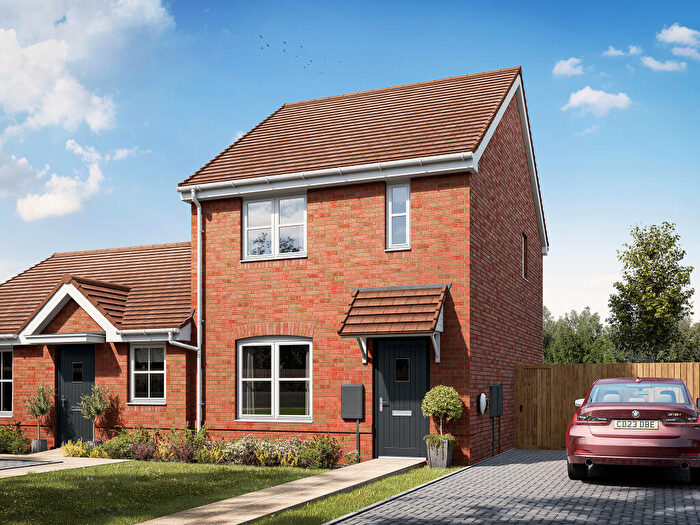
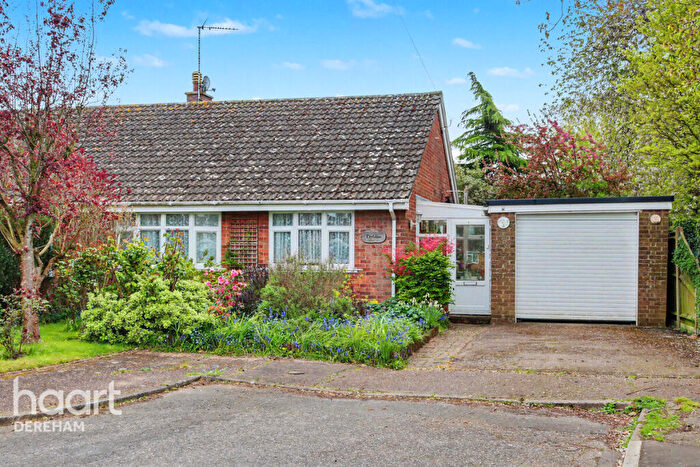
Properties for sale in Norfolk

![]()
If you are looking to sell your house, let it out, or receive a property valuation, an expert can help you.
Click the button below to get started.


Towns in Norfolk
Navigate through our locations to find the location of your next house in Norfolk, England for sale or to rent.
Transport in Norfolk
Please see below transportation links in this area:

- FAQ
- Price Paid By Year
- Property Type Price
Frequently asked questions about Norfolk
What is the average price for a property for sale in Norfolk?
The average price for a property for sale in Norfolk is £299,319. This amount is 17% lower than the average price in England. There are more than 10,000 property listings for sale in Norfolk.
What locations have the most expensive properties for sale in Norfolk?
The locations with the most expensive properties for sale in Norfolk are Wells-next-the-sea at an average of £528,733, Holt at an average of £503,205 and Walsingham at an average of £405,382.
What locations have the most affordable properties for sale in Norfolk?
The locations with the most affordable properties for sale in Norfolk are Great Yarmouth at an average of £229,732, Brandon at an average of £256,448 and Swaffham at an average of £258,769.
Which train stations are available in or near Norfolk?
Some of the train stations available in or near Norfolk are Wymondham, Spooner Row and Norwich.
Property Price Paid in Norfolk by Year
The average sold property price by year was:
| Year | Average Sold Price | Price Change |
Sold Properties
|
|---|---|---|---|
| 2026 | £297,078 | 0,2% |
1,052 Properties |
| 2025 | £296,505 | -1% |
12,689 Properties |
| 2024 | £298,067 | -2% |
13,399 Properties |
| 2023 | £303,799 | -3% |
12,240 Properties |
| 2022 | £313,573 | 7% |
15,792 Properties |
| 2021 | £292,230 | 7% |
20,435 Properties |
| 2020 | £271,320 | 6% |
14,605 Properties |
| 2019 | £253,925 | 2% |
17,149 Properties |
| 2018 | £248,736 | 2% |
16,997 Properties |
| 2017 | £243,605 | 6% |
17,730 Properties |
| 2016 | £227,987 | 7% |
18,112 Properties |
| 2015 | £212,151 | 5% |
17,627 Properties |
| 2014 | £201,149 | 5% |
17,772 Properties |
| 2013 | £190,707 | 4% |
15,119 Properties |
| 2012 | £183,133 | 0,2% |
12,265 Properties |
| 2011 | £182,858 | -4% |
12,651 Properties |
| 2010 | £189,847 | 7% |
12,134 Properties |
| 2009 | £175,703 | -6% |
12,365 Properties |
| 2008 | £185,490 | -3% |
10,855 Properties |
| 2007 | £190,790 | 7% |
21,451 Properties |
| 2006 | £177,205 | 6% |
21,727 Properties |
| 2005 | £167,027 | 5% |
16,965 Properties |
| 2004 | £158,855 | 12% |
19,433 Properties |
| 2003 | £140,011 | 15% |
19,102 Properties |
| 2002 | £118,658 | 19% |
20,968 Properties |
| 2001 | £95,702 | 15% |
21,170 Properties |
| 2000 | £81,089 | 14% |
18,992 Properties |
| 1999 | £70,127 | 7% |
20,905 Properties |
| 1998 | £64,987 | 8% |
18,244 Properties |
| 1997 | £59,913 | 7% |
18,829 Properties |
| 1996 | £55,914 | 1% |
16,481 Properties |
| 1995 | £55,104 | - |
13,318 Properties |
Property Price per Property Type in Norfolk
Here you can find historic sold price data in order to help with your property search.
The average Property Paid Price for specific property types in the last three years are:
| Property Type | Average Sold Price | Sold Properties |
|---|---|---|
| Semi Detached House | £267,023.00 | 10,576 Semi Detached Houses |
| Terraced House | £226,927.00 | 9,921 Terraced Houses |
| Detached House | £403,098.00 | 15,174 Detached Houses |
| Flat | £160,472.00 | 3,709 Flats |