
Houses for sale & to rent in West Sussex, England
House Prices in West Sussex
Properties in West Sussex have
an average house price of
£421k
and had 32,152 Property Transactions
within the last 3 years.¹
West Sussex is a location in
England with
296,213 households², where the most expensive property was sold for £6.75M.
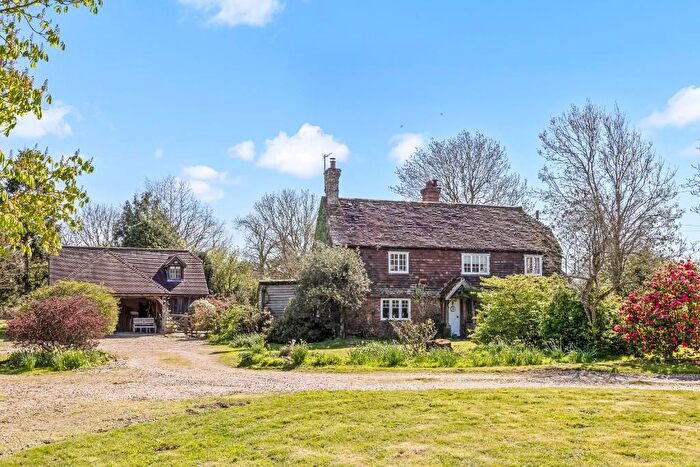
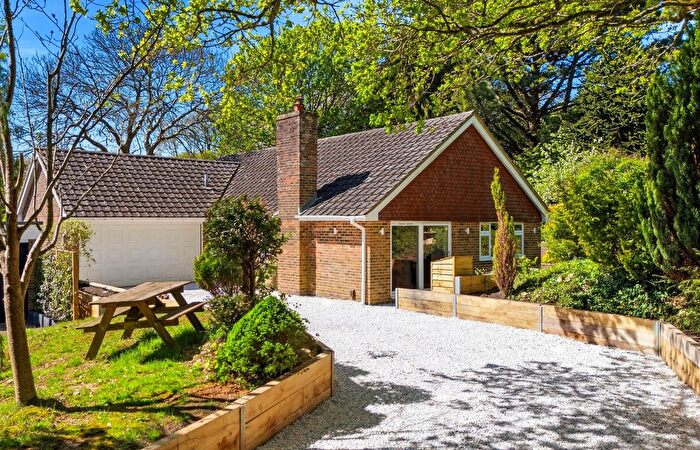
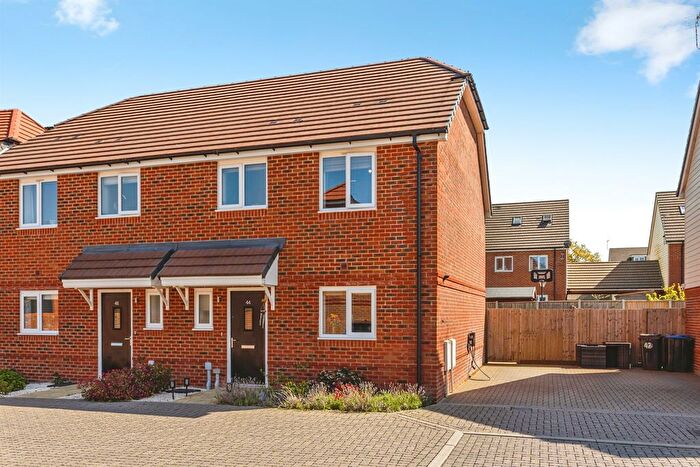
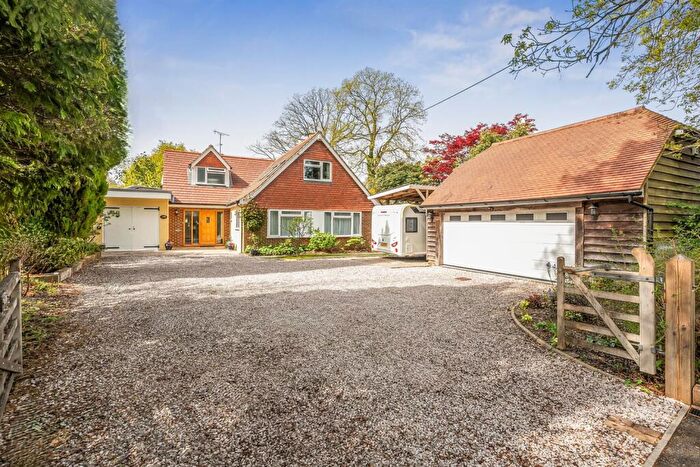
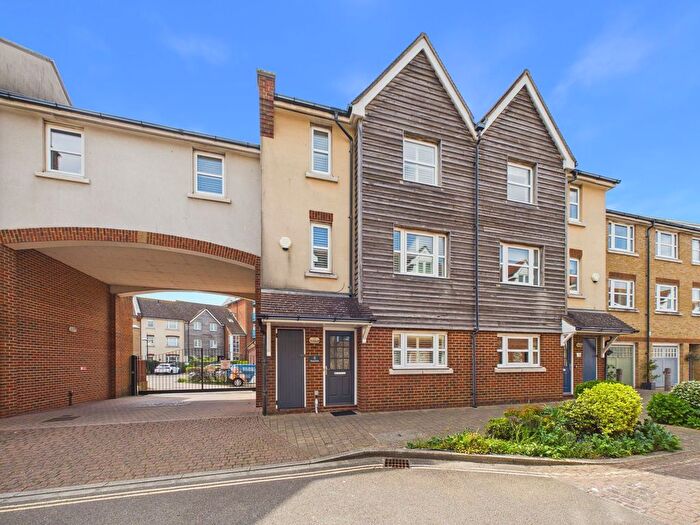
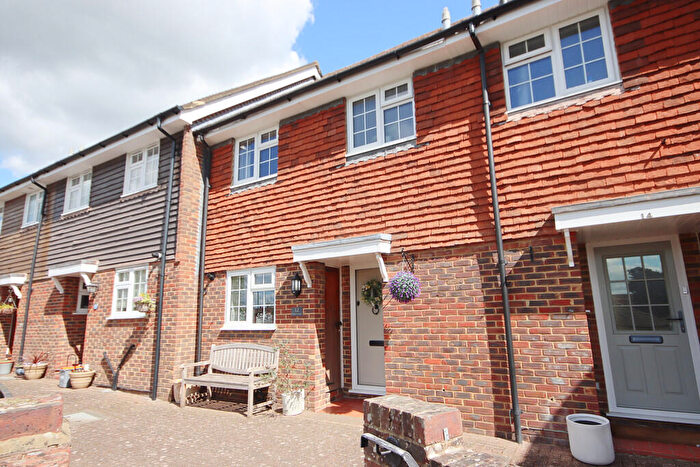
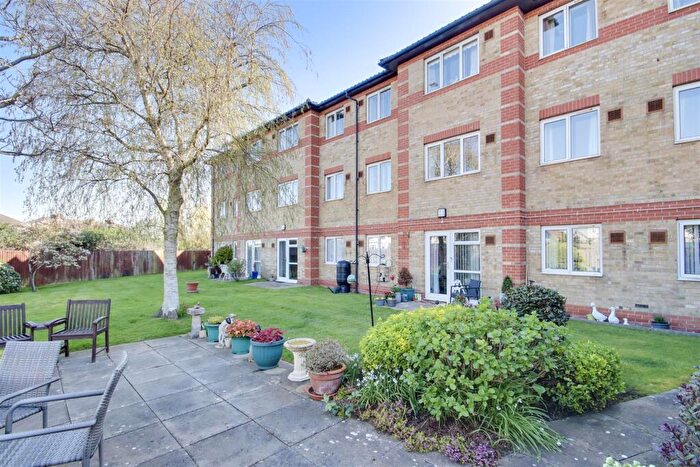
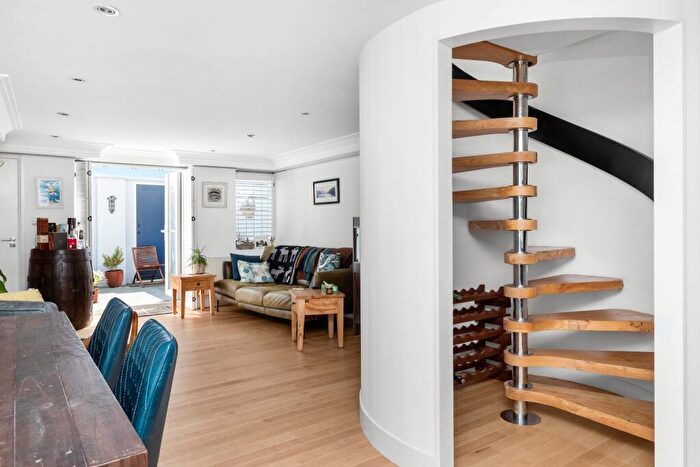
Properties for sale in West Sussex
![]()
If you are looking to sell your house, let it out, or receive a property valuation, an expert can help you.
Click the button below to get started.


Towns in West Sussex
Navigate through our locations to find the location of your next house in West Sussex, England for sale or to rent.
- Arundel
- Billingshurst
- Bognor Regis
- Brighton
- Burgess Hill
- Chichester
- Crawley
- Dorking
- East Grinstead
- Hassocks
- Haywards Heath
- Henfield
- Horley
- Horsham
- Lancing
- Littlehampton
- Pulborough
- Shoreham-by-sea
- Steyning
- Washington
- Worthing
- Liphook
- Petersfield
- Liss
- Havant
- Rowland's Castle
- Hindhead
- Petworth
- Midhurst
- Emsworth
- Gatwick
Transport in West Sussex
Please see below transportation links in this area:
-
 Billingshurst Station
 -
Lancing Station
-
Shoreham-By-Sea Station
-
Pulborough Station
-
East Worthing Station
-
Christ's Hospital Station
-
Worthing Station
-
West Worthing Station
-
Southwick Station
-
Hassocks Station
- FAQ
- Price Paid By Year
- Property Type Price
Frequently asked questions about West Sussex
What is the average price for a property for sale in West Sussex?
The average price for a property for sale in West Sussex is £421,149. This amount is 17% higher than the average price in England. There are more than 10,000 property listings for sale in West Sussex.
What locations have the most expensive properties for sale in West Sussex?
The locations with the most expensive properties for sale in West Sussex are Liphook at an average of £982,500, Dorking at an average of £910,000 and Petersfield at an average of £888,437.
What locations have the most affordable properties for sale in West Sussex?
The locations with the most affordable properties for sale in West Sussex are Lancing at an average of £344,259, Bognor Regis at an average of £346,796 and Crawley at an average of £370,791.
Which train stations are available in or near West Sussex?
Some of the train stations available in or near West Sussex are Billingshurst, Lancing and Shoreham-By-Sea.
Property Price Paid in West Sussex by Year
The average sold property price by year was:
| Year | Average Sold Price | Price Change |
Sold Properties
|
|---|---|---|---|
| 2026 | £416,372 | -2% |
834 Properties |
| 2025 | £423,229 | 1% |
10,371 Properties |
| 2024 | £420,702 | 0,2% |
10,860 Properties |
| 2023 | £419,886 | -1% |
10,087 Properties |
| 2022 | £425,943 | 5% |
12,763 Properties |
| 2021 | £402,996 | 5% |
16,325 Properties |
| 2020 | £383,213 | 6% |
11,766 Properties |
| 2019 | £359,399 | 1% |
13,856 Properties |
| 2018 | £354,713 | 2% |
13,911 Properties |
| 2017 | £349,359 | 5% |
14,334 Properties |
| 2016 | £333,088 | 7% |
14,960 Properties |
| 2015 | £309,744 | 7% |
15,493 Properties |
| 2014 | £288,798 | 7% |
15,507 Properties |
| 2013 | £269,528 | 3% |
12,802 Properties |
| 2012 | £260,331 | 2% |
11,094 Properties |
| 2011 | £253,931 | -2% |
10,712 Properties |
| 2010 | £257,957 | 10% |
10,635 Properties |
| 2009 | £232,383 | -7% |
10,292 Properties |
| 2008 | £249,320 | -1% |
9,192 Properties |
| 2007 | £251,169 | 8% |
18,385 Properties |
| 2006 | £230,364 | 6% |
19,419 Properties |
| 2005 | £216,837 | 2% |
14,692 Properties |
| 2004 | £211,600 | 8% |
17,325 Properties |
| 2003 | £194,398 | 13% |
17,041 Properties |
| 2002 | £169,927 | 15% |
19,996 Properties |
| 2001 | £144,361 | 11% |
18,287 Properties |
| 2000 | £128,041 | 16% |
16,177 Properties |
| 1999 | £107,857 | 10% |
18,501 Properties |
| 1998 | £96,750 | 11% |
16,895 Properties |
| 1997 | £86,102 | 10% |
19,103 Properties |
| 1996 | £77,677 | 3% |
16,486 Properties |
| 1995 | £75,445 | - |
13,497 Properties |
Property Price per Property Type in West Sussex
Here you can find historic sold price data in order to help with your property search.
The average Property Paid Price for specific property types in the last three years are:
| Property Type | Average Sold Price | Sold Properties |
|---|---|---|
| Semi Detached House | £428,757.00 | 8,020 Semi Detached Houses |
| Terraced House | £354,588.00 | 7,948 Terraced Houses |
| Detached House | £661,518.00 | 8,414 Detached Houses |
| Flat | £221,089.00 | 7,770 Flats |