
Houses for sale & to rent in Drumchapel/Anniesland, Glasgow
House Prices in Drumchapel/Anniesland
Properties in Drumchapel/Anniesland have an average house price of £190k and had 449 Property Transactions within the last 3 years¹.
Drumchapel/Anniesland is an area in Glasgow, Glasgow City with 13,550 households², where the most expensive property was sold for £541k.
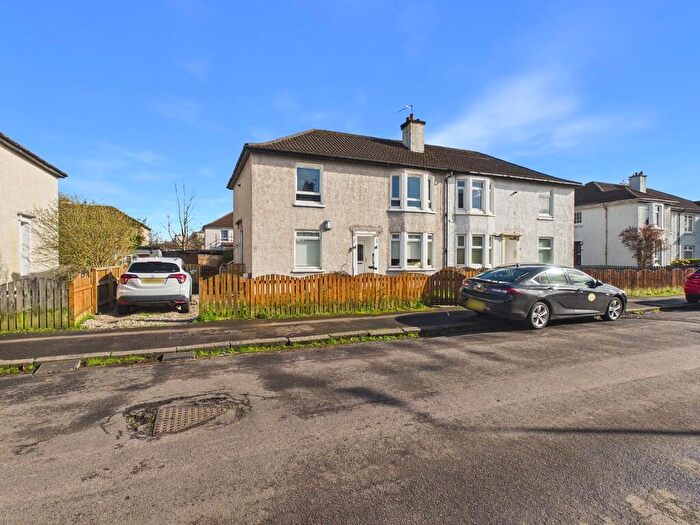
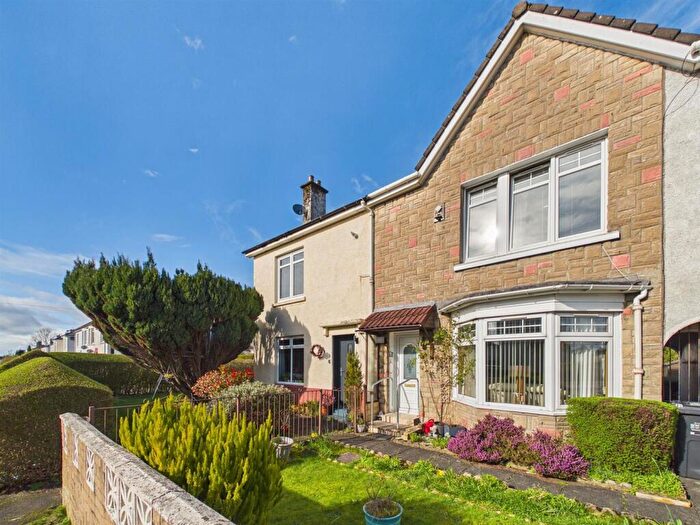
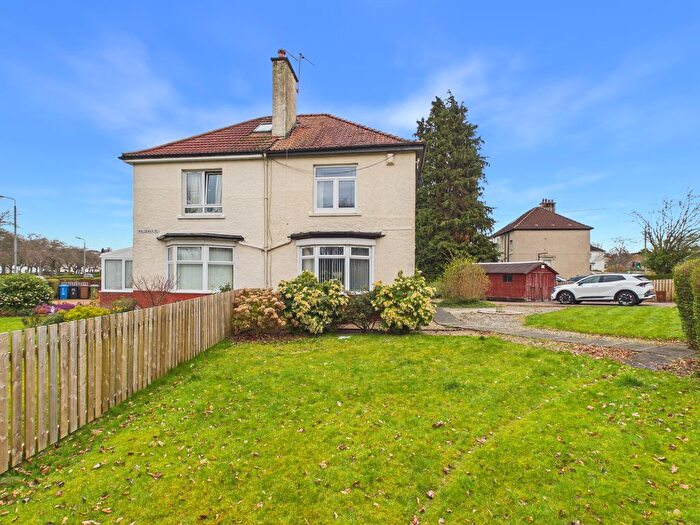
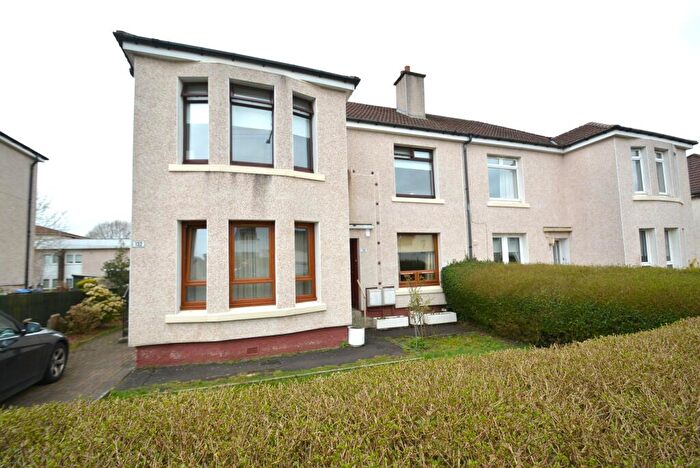
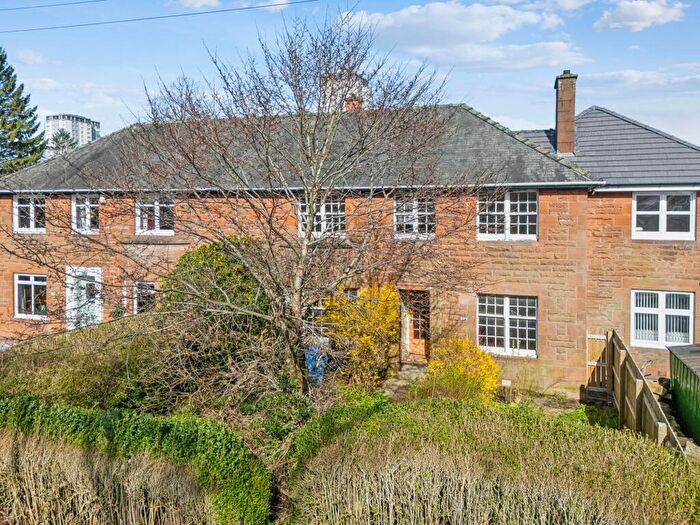
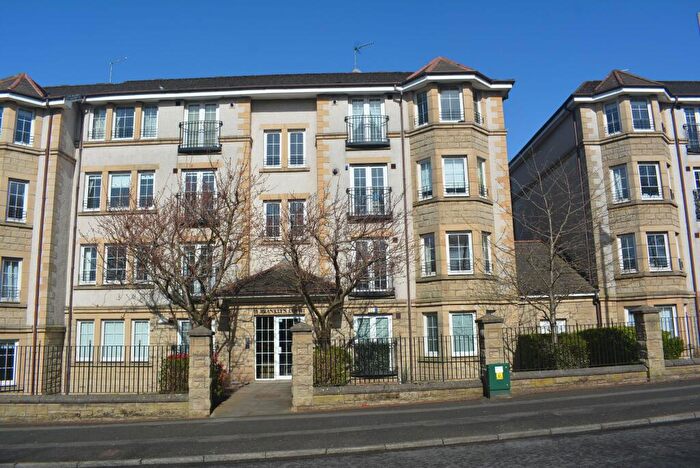
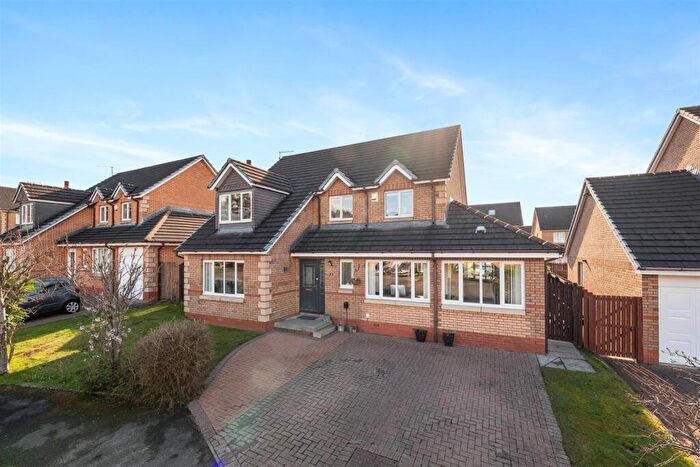
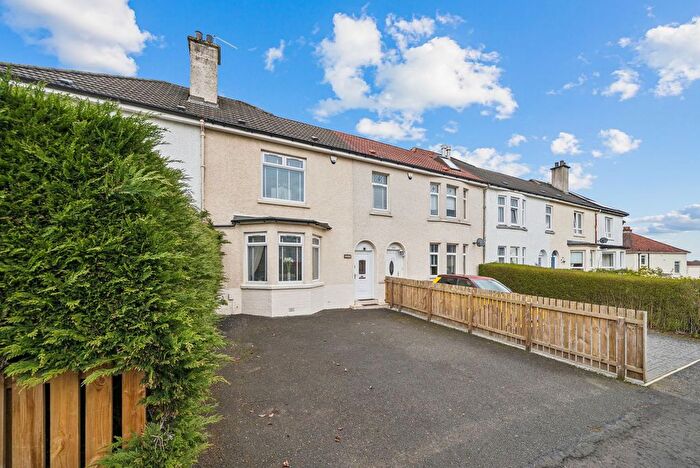
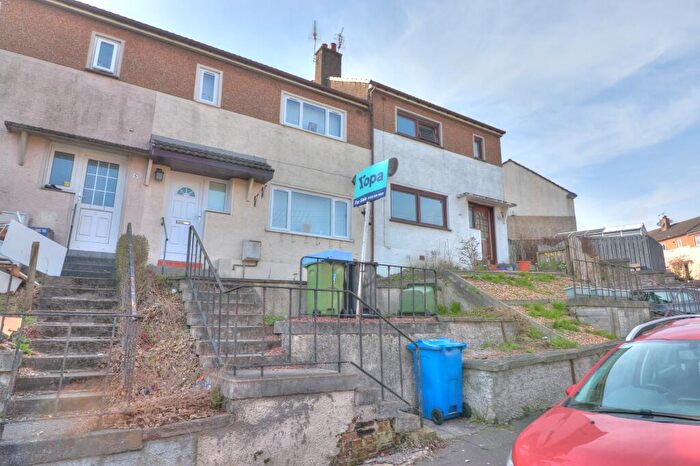
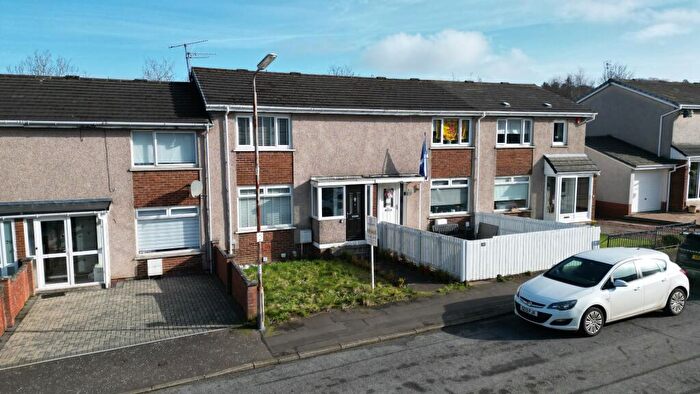
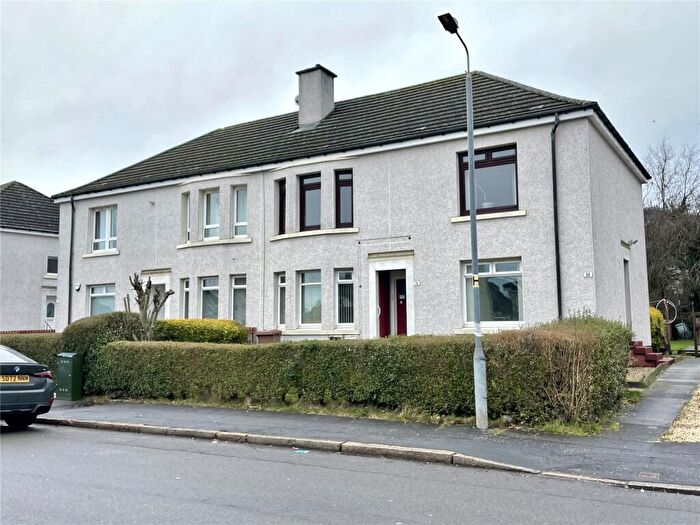
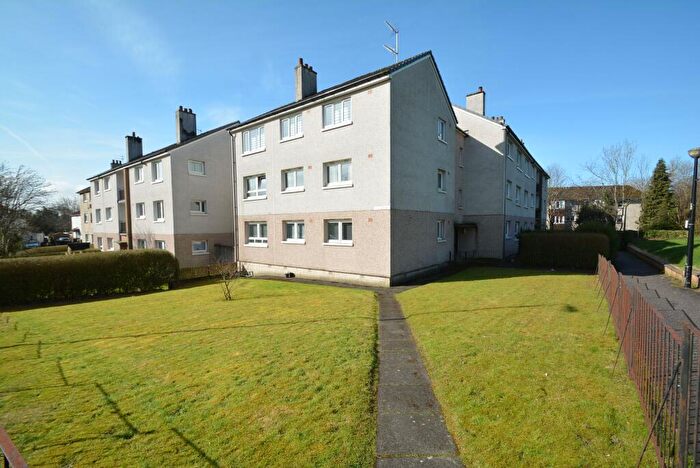
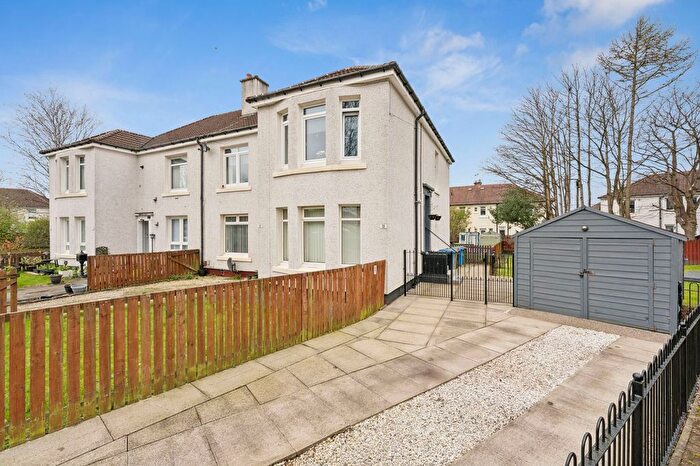
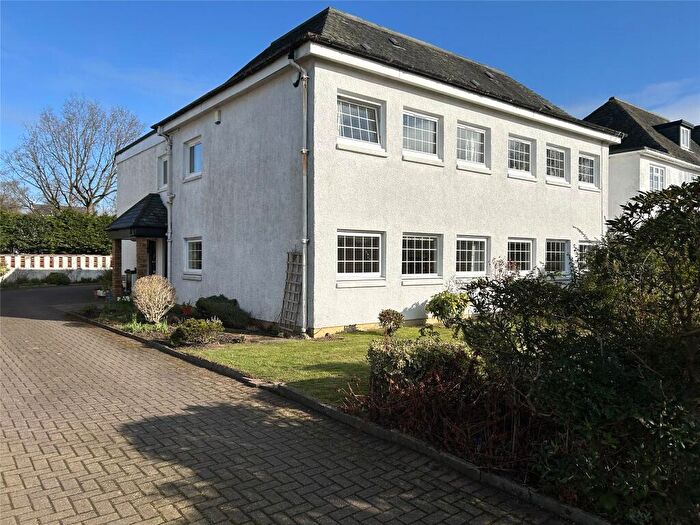
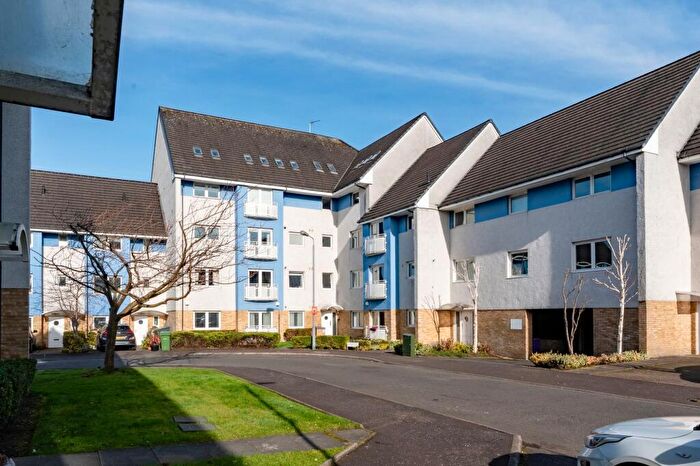
Properties for sale in Drumchapel/Anniesland
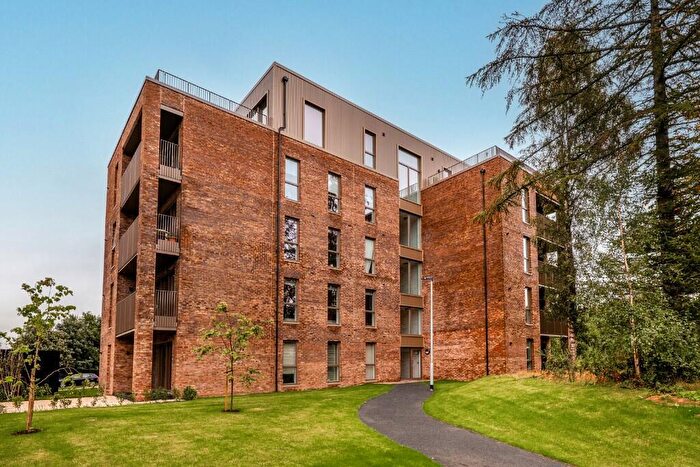

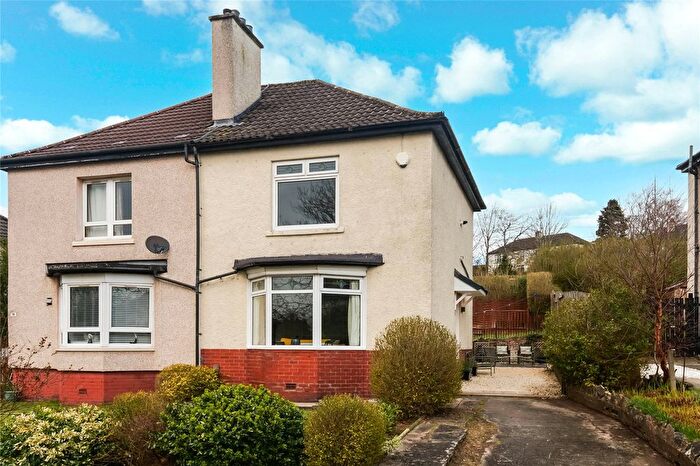
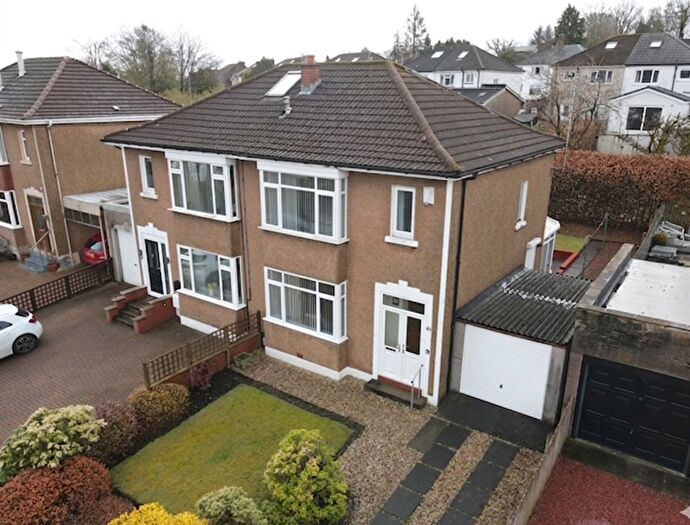
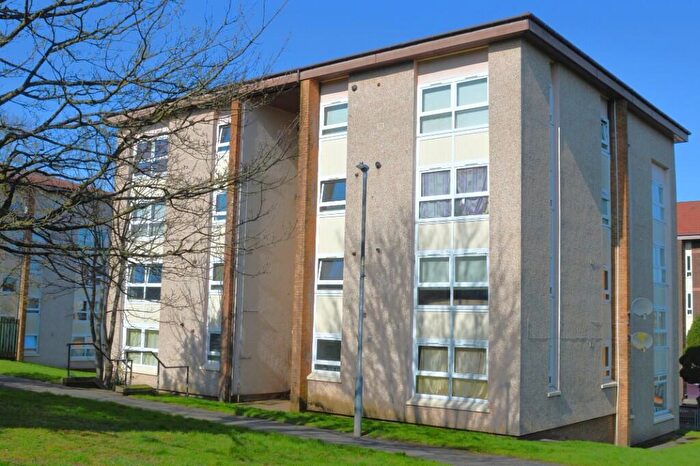
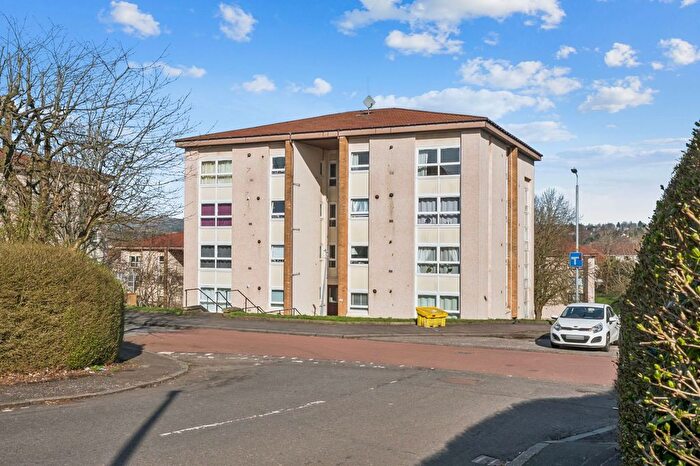
![]()
If you are looking to sell your house, let it out, or receive a property valuation, an expert can help you.
Click the button below to get started.


Roads and Postcodes in Drumchapel/Anniesland
Navigate through our locations to find the location of your next house in Drumchapel/Anniesland, Glasgow for sale or to rent.
Transport near Drumchapel/Anniesland
-
 Drumchapel Station
 -
Westerton Station
-
Bearsden Station
-
Garscadden Station
-
Scotstounhill Station
-
Drumry Station
-
Anniesland Station
-
Yoker Station
-
Hillfoot Station
-
Kelvindale Station
- FAQ
- Price Paid By Year
Frequently asked questions about Drumchapel/Anniesland
What is the average price for a property for sale in Drumchapel/Anniesland?
The average price for a property for sale in Drumchapel/Anniesland is £189,664. This amount is 12% lower than the average price in Glasgow. There are 3,138 property listings for sale in Drumchapel/Anniesland.
What streets have the most expensive properties for sale in Drumchapel/Anniesland?
The streets with the most expensive properties for sale in Drumchapel/Anniesland are Old Farm Road at an average of £521,000, Craigend Court at an average of £331,500 and Fruin Road at an average of £330,750.
What streets have the most affordable properties for sale in Drumchapel/Anniesland?
The streets with the most affordable properties for sale in Drumchapel/Anniesland are Linkwood Avenue at an average of £65,710, Katewell Avenue at an average of £78,000 and Monymusk Place at an average of £97,500.
Which train stations are available in or near Drumchapel/Anniesland?
Some of the train stations available in or near Drumchapel/Anniesland are Drumchapel, Westerton and Bearsden.
Property Price Paid in Drumchapel/Anniesland by Year
The average sold property price by year was:
| Year | Average Sold Price | Price Change |
Sold Properties
|
|---|---|---|---|
| 2025 | £206,492 | 8% |
147 Properties |
| 2024 | £190,356 | 10% |
156 Properties |
| 2023 | £171,981 | 3% |
146 Properties |
| 2022 | £167,502 | 11% |
415 Properties |
| 2021 | £148,607 | 3% |
523 Properties |
| 2020 | £143,840 | 11% |
384 Properties |
| 2019 | £127,359 | -5% |
444 Properties |
| 2018 | £133,768 | 9% |
449 Properties |
| 2017 | £121,994 | 3% |
456 Properties |
| 2016 | £118,167 | 5% |
409 Properties |
| 2015 | £112,520 | 8% |
377 Properties |
| 2014 | £103,540 | -2% |
398 Properties |
| 2013 | £106,021 | -4% |
337 Properties |
| 2012 | £110,261 | -1% |
319 Properties |
| 2011 | £110,855 | -1% |
245 Properties |
| 2010 | £111,742 | 4% |
334 Properties |
| 2009 | £106,731 | -15% |
347 Properties |
| 2008 | £122,454 | -5% |
475 Properties |
| 2007 | £128,060 | 4% |
622 Properties |
| 2006 | £122,746 | 13% |
639 Properties |
| 2005 | £106,490 | 3% |
659 Properties |
| 2004 | £103,185 | 32% |
628 Properties |
| 2003 | £70,343 | 12% |
641 Properties |
| 2002 | £61,596 | -37% |
681 Properties |
| 2001 | £84,437 | - |
46 Properties |