
Houses for sale & to rent in Garscadden/Scotstounhill, Glasgow
House Prices in Garscadden/Scotstounhill
Properties in Garscadden/Scotstounhill have an average house price of £200k and had 574 Property Transactions within the last 3 years¹.
Garscadden/Scotstounhill is an area in Glasgow, Glasgow City with 14,602 households², where the most expensive property was sold for £710k.
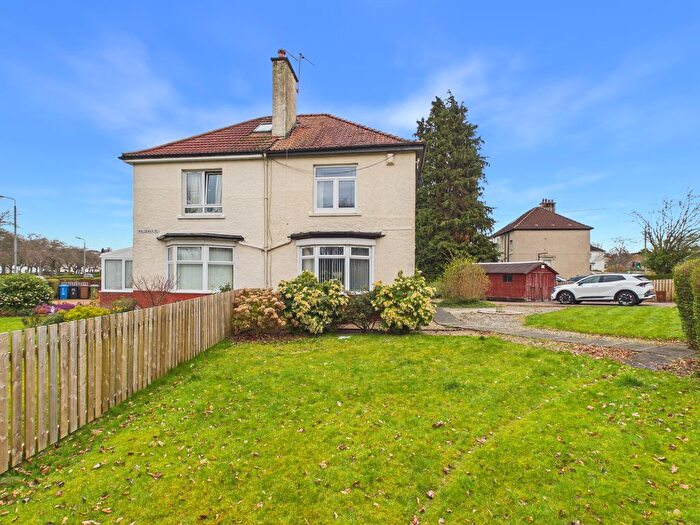
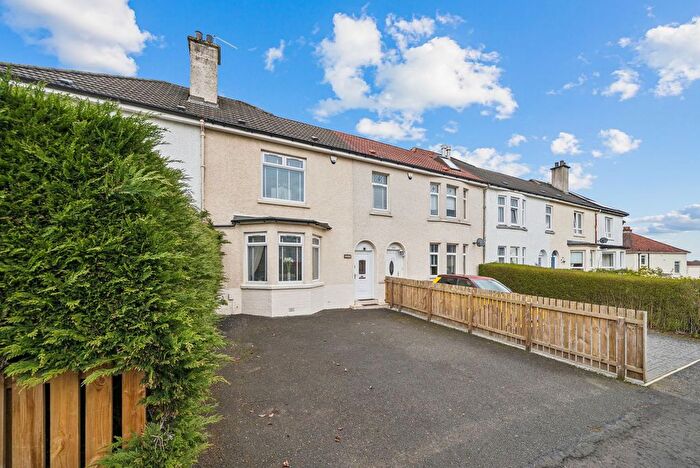
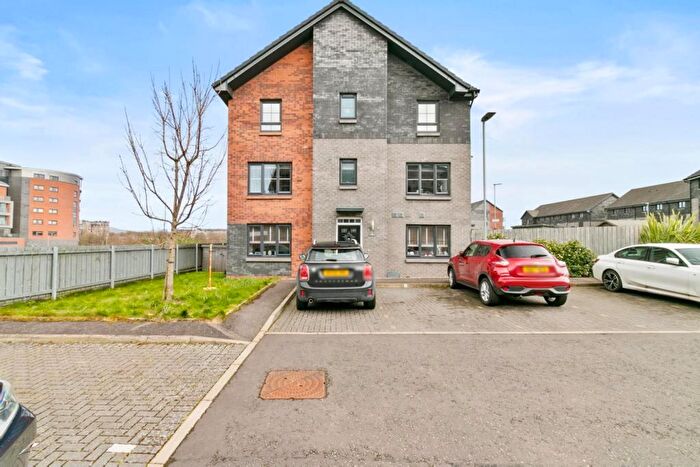
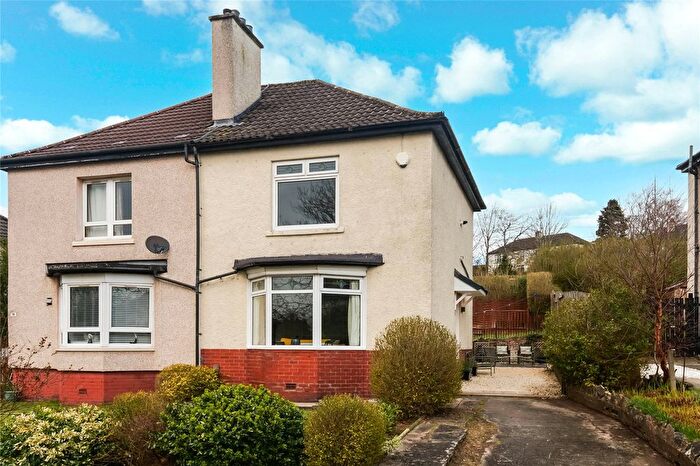
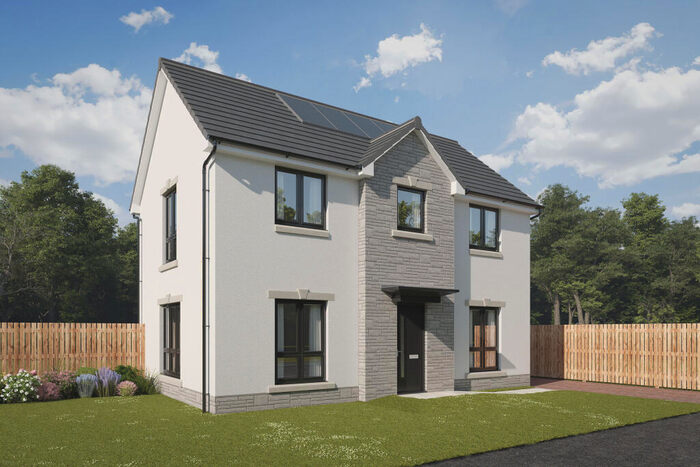
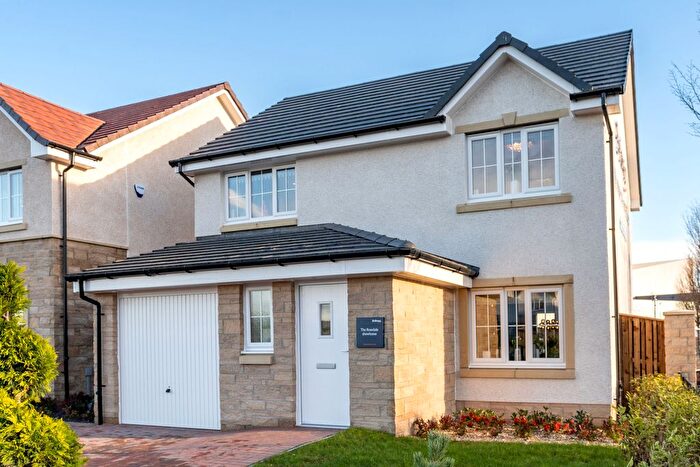
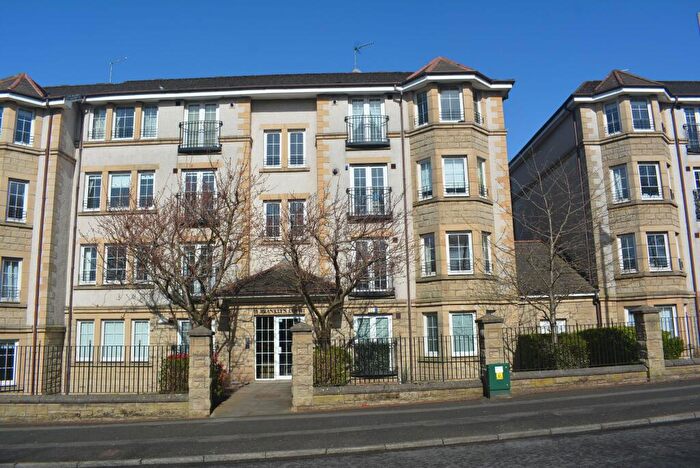
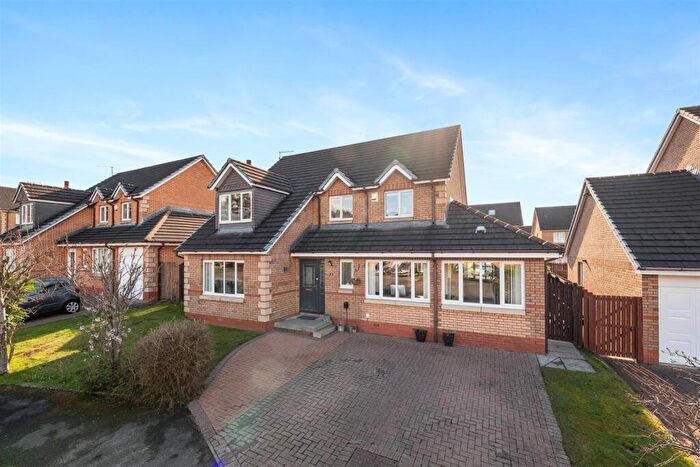
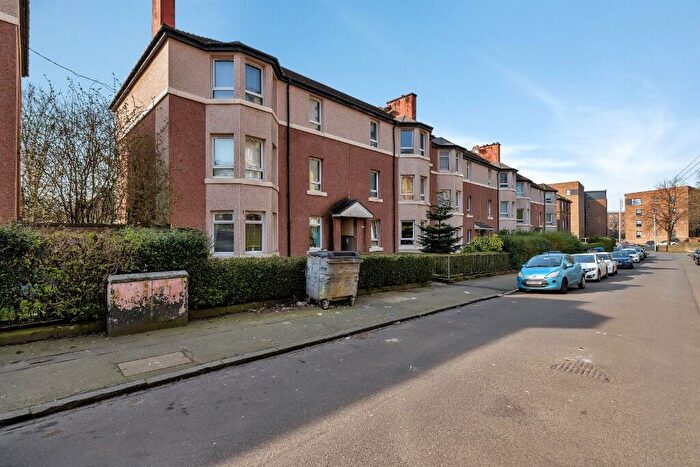
Properties for sale in Garscadden/Scotstounhill
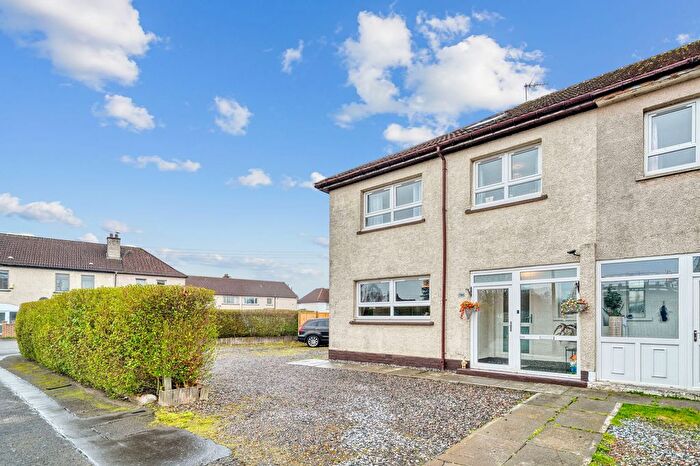

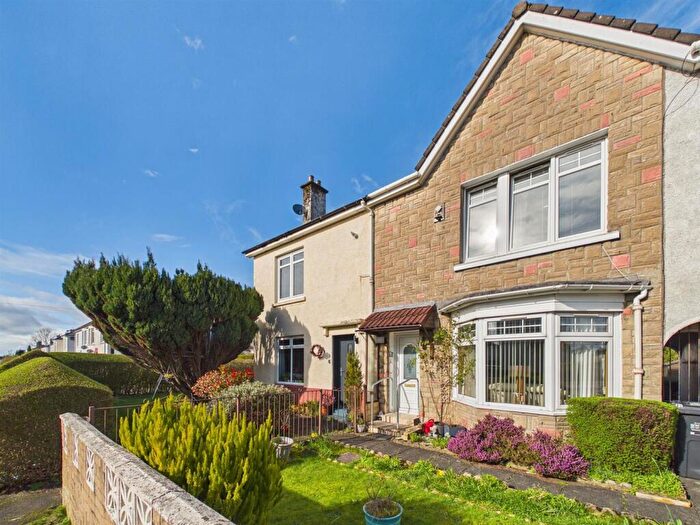
![]()
If you are looking to sell your house, let it out, or receive a property valuation, an expert can help you.
Click the button below to get started.


Roads and Postcodes in Garscadden/Scotstounhill
Navigate through our locations to find the location of your next house in Garscadden/Scotstounhill, Glasgow for sale or to rent.
Transport near Garscadden/Scotstounhill
-
 Garscadden Station
 -
Scotstounhill Station
-
Yoker Station
-
Drumchapel Station
-
Jordanhill Station
-
Anniesland Station
-
Westerton Station
-
Drumry Station
-
Hyndland Station
-
Clydebank Station
- FAQ
- Price Paid By Year
Frequently asked questions about Garscadden/Scotstounhill
What is the average price for a property for sale in Garscadden/Scotstounhill?
The average price for a property for sale in Garscadden/Scotstounhill is £200,115. This amount is 7% lower than the average price in Glasgow. There are 3,714 property listings for sale in Garscadden/Scotstounhill.
What streets have the most expensive properties for sale in Garscadden/Scotstounhill?
The streets with the most expensive properties for sale in Garscadden/Scotstounhill are Duthie Park Place at an average of £700,500, Priorwood Place at an average of £637,000 and Ormiston Avenue at an average of £486,211.
What streets have the most affordable properties for sale in Garscadden/Scotstounhill?
The streets with the most affordable properties for sale in Garscadden/Scotstounhill are Gosford Lane at an average of £60,000, Riversdale Lane at an average of £92,333 and Culbin Drive at an average of £97,655.
Which train stations are available in or near Garscadden/Scotstounhill?
Some of the train stations available in or near Garscadden/Scotstounhill are Garscadden, Scotstounhill and Yoker.
Property Price Paid in Garscadden/Scotstounhill by Year
The average sold property price by year was:
| Year | Average Sold Price | Price Change |
Sold Properties
|
|---|---|---|---|
| 2025 | £222,009 | 13% |
219 Properties |
| 2024 | £193,034 | 6% |
172 Properties |
| 2023 | £180,571 | 7% |
183 Properties |
| 2022 | £168,283 | 6% |
434 Properties |
| 2021 | £158,299 | 14% |
541 Properties |
| 2020 | £136,888 | -1% |
364 Properties |
| 2019 | £137,676 | -0,5% |
464 Properties |
| 2018 | £138,313 | 9% |
468 Properties |
| 2017 | £126,408 | 4% |
501 Properties |
| 2016 | £121,499 | 3% |
482 Properties |
| 2015 | £117,575 | -0,4% |
435 Properties |
| 2014 | £118,063 | 6% |
417 Properties |
| 2013 | £111,225 | 2% |
397 Properties |
| 2012 | £108,835 | -9% |
333 Properties |
| 2011 | £118,832 | 1% |
289 Properties |
| 2010 | £117,096 | 3% |
320 Properties |
| 2009 | £113,423 | -18% |
385 Properties |
| 2008 | £133,784 | -3% |
534 Properties |
| 2007 | £138,224 | 8% |
710 Properties |
| 2006 | £126,931 | 19% |
692 Properties |
| 2005 | £102,384 | 7% |
663 Properties |
| 2004 | £94,859 | 19% |
638 Properties |
| 2003 | £76,390 | 17% |
674 Properties |
| 2002 | £63,754 | -5% |
791 Properties |
| 2001 | £66,748 | - |
72 Properties |