
Properties for sale in TQ
Torquay
- Info
- Price Paid By Year
- Property Type Price
House Prices in TQ
Properties in TQ have an average house price of £344,221 and had 13764 Property Transactions within the last 3 years.
The most expensive property was sold for £5,250,000.
Property Price Paid in TQ by Year
The average sold property price by year was:
| Year | Average Sold Price | Sold Properties |
|---|---|---|
| 2026 | £302,849.00 | 372 Properties |
| 2025 | £333,939.00 | 4,285 Properties |
| 2024 | £346,015.00 | 4,731 Properties |
| 2023 | £355,869.00 | 4,376 Properties |
| 2022 | £359,550.00 | 5,722 Properties |
| 2021 | £328,054.00 | 7,708 Properties |
| 2020 | £306,779.00 | 5,243 Properties |
| 2019 | £274,601.00 | 5,996 Properties |
| 2018 | £271,492.00 | 6,208 Properties |
| 2017 | £263,560.00 | 6,782 Properties |
| 2016 | £252,922.00 | 6,672 Properties |
| 2015 | £243,533.00 | 6,631 Properties |
| 2014 | £236,530.00 | 6,194 Properties |
| 2013 | £227,206.00 | 5,334 Properties |
| 2012 | £223,846.00 | 4,520 Properties |
| 2011 | £223,839.00 | 4,294 Properties |
| 2010 | £236,105.00 | 4,471 Properties |
| 2009 | £217,497.00 | 4,418 Properties |
| 2008 | £229,580.00 | 3,837 Properties |
| 2007 | £236,178.00 | 7,436 Properties |
| 2006 | £215,334.00 | 7,881 Properties |
| 2005 | £207,568.00 | 6,055 Properties |
| 2004 | £192,397.00 | 7,584 Properties |
| 2003 | £165,208.00 | 7,898 Properties |
| 2002 | £138,120.00 | 8,880 Properties |
| 2001 | £112,581.00 | 8,585 Properties |
| 2000 | £98,379.00 | 8,237 Properties |
| 1999 | £86,352.00 | 8,731 Properties |
| 1998 | £76,766.00 | 7,565 Properties |
| 1997 | £72,214.00 | 7,790 Properties |
| 1996 | £66,296.00 | 6,615 Properties |
| 1995 | £66,060.00 | 5,171 Properties |
Property Price per Property Type in TQ
Here you can find historic sold price data in order to help with your property search.
The average Property Paid Price for specific property types in the last three years are:
| Property Type | Average Sold Price | Sold Properties |
|---|---|---|
| Semi Detached House | £322,968.00 | 2,911 Semi Detached Houses |
| Terraced House | £267,833.00 | 4,086 Terraced Houses |
| Detached House | £533,766.00 | 3,989 Detached Houses |
| Flat | £206,675.00 | 2,778 Flats |
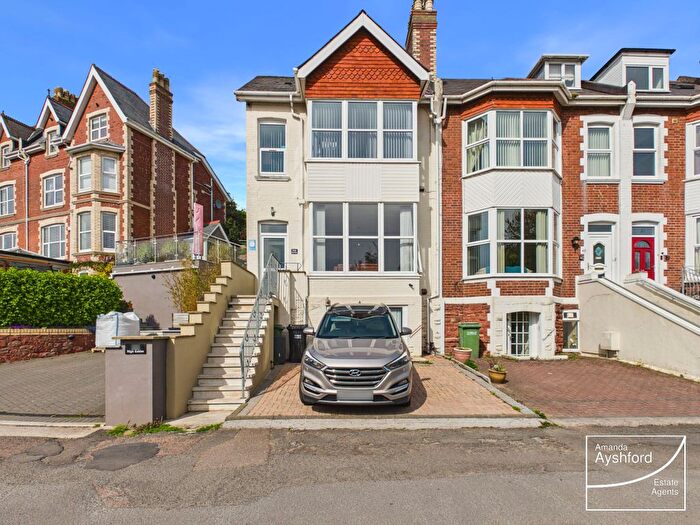
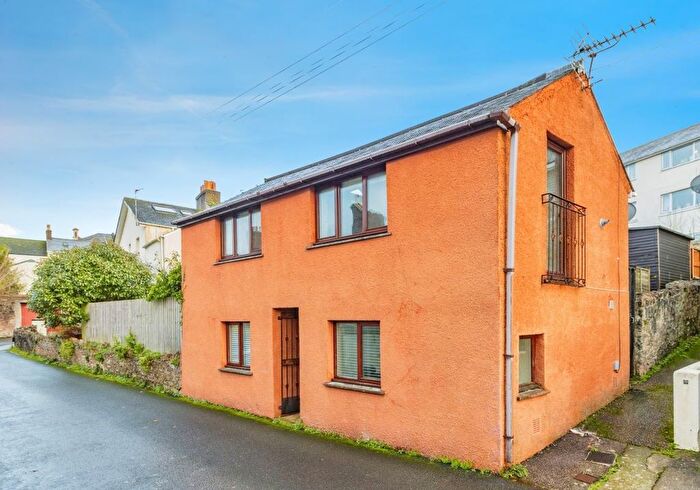
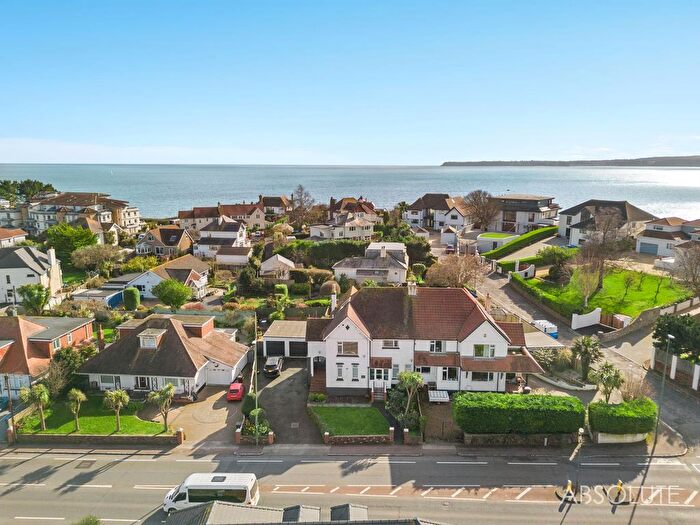
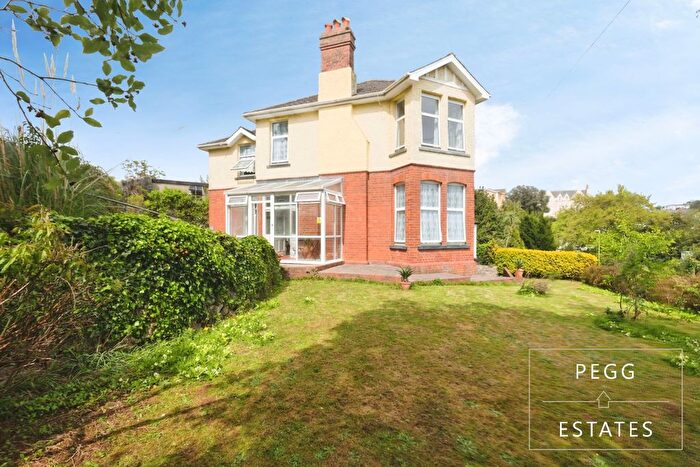
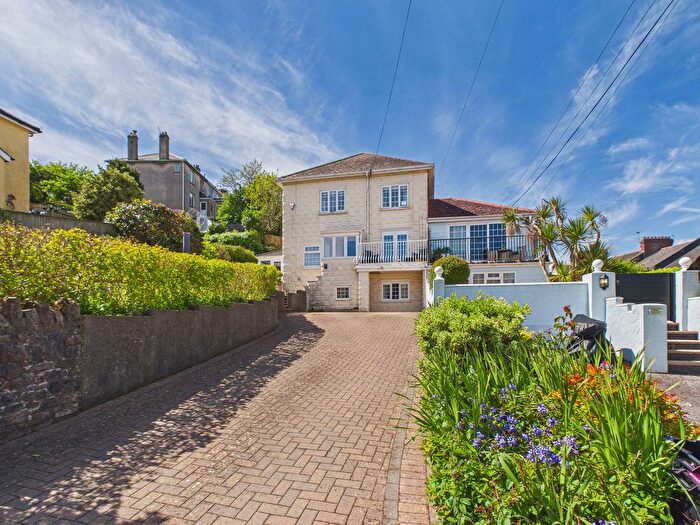
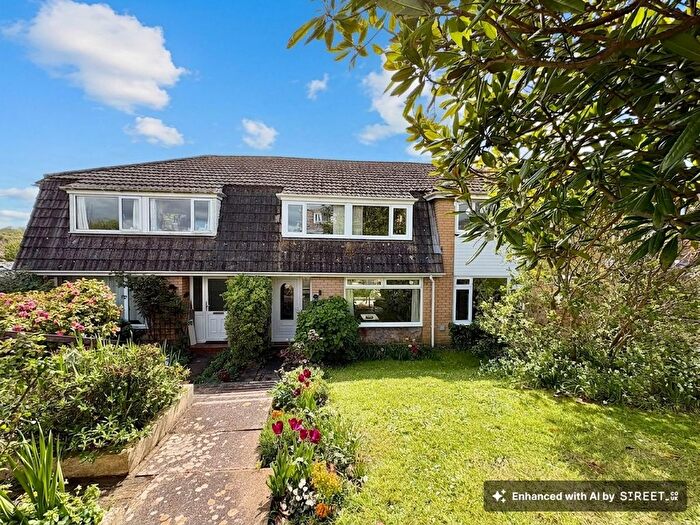
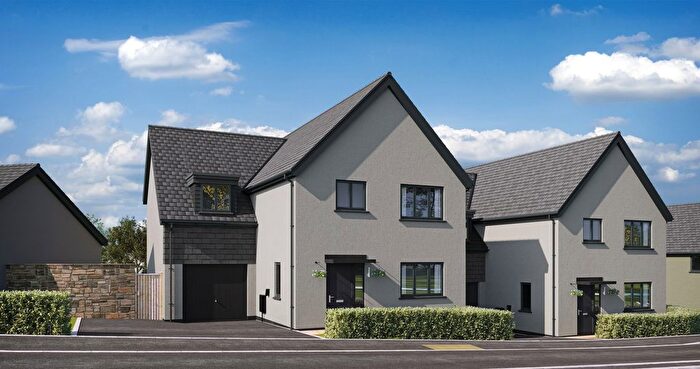
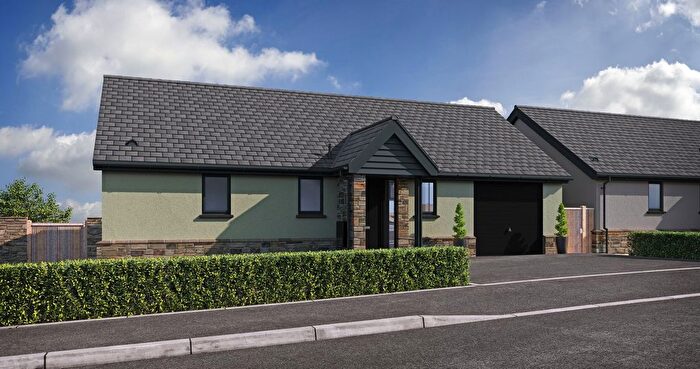
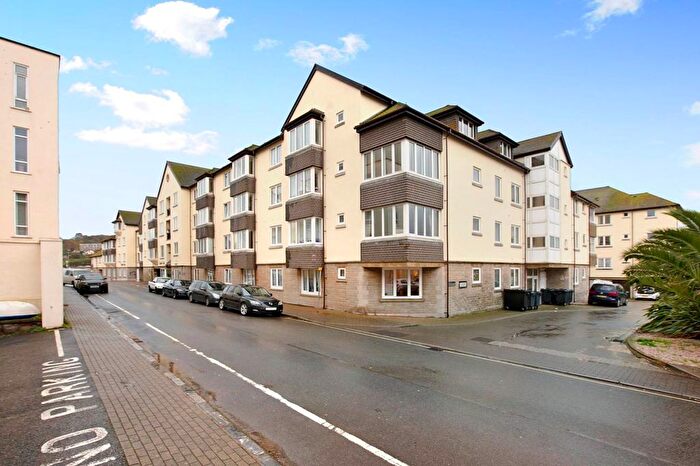
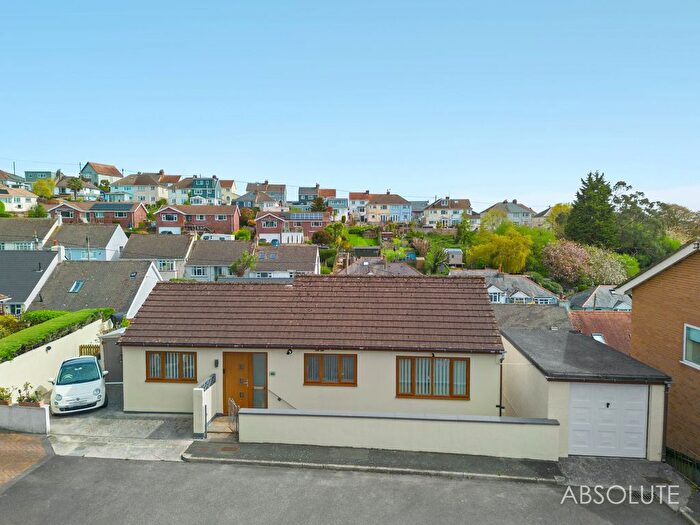
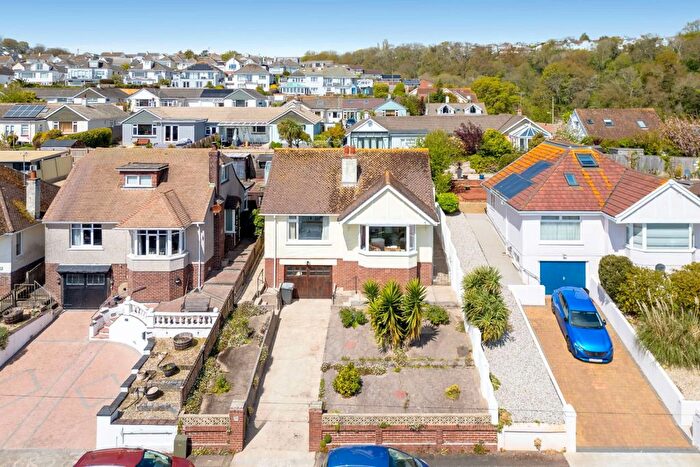
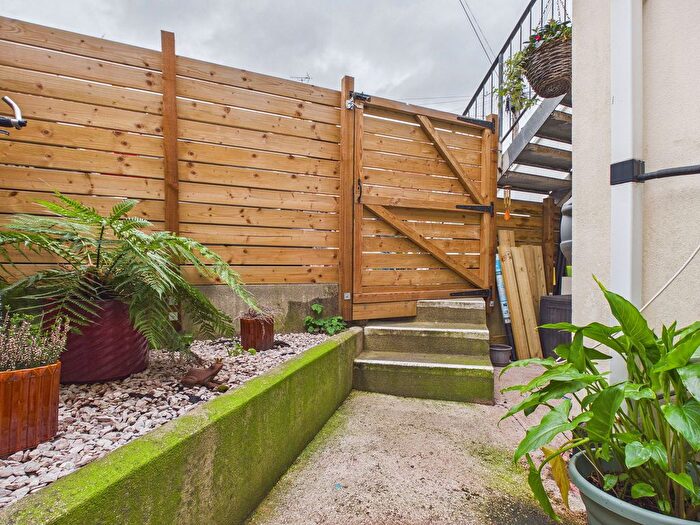
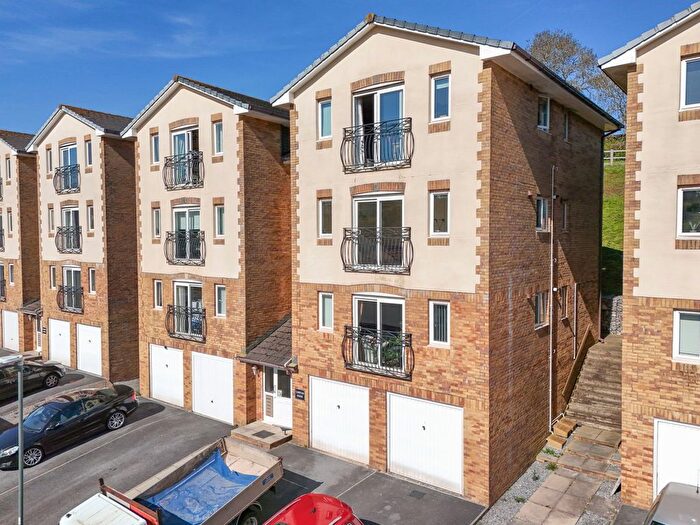
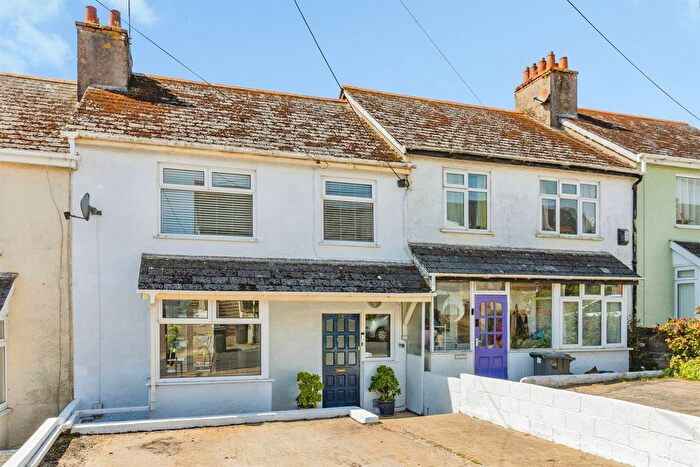
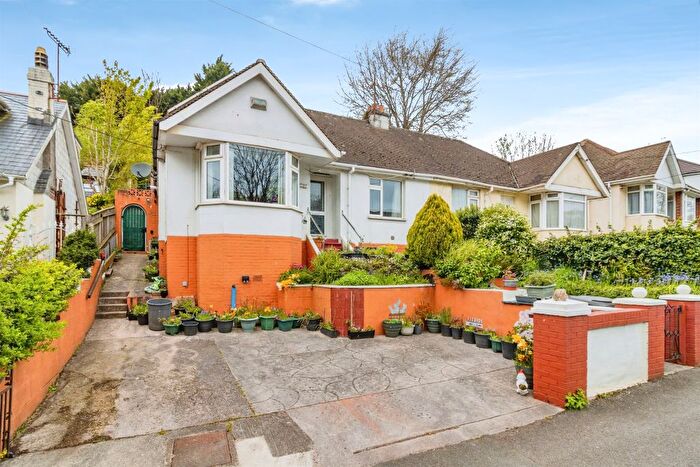
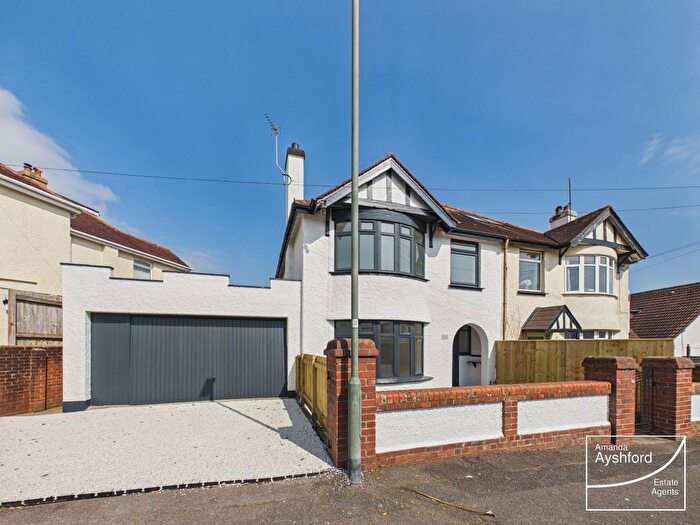
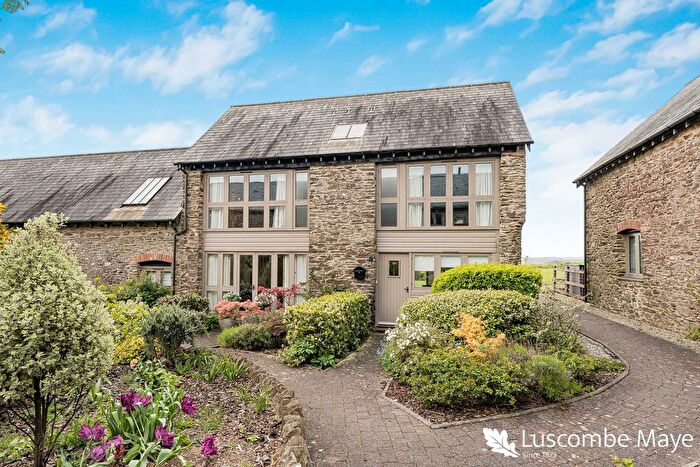
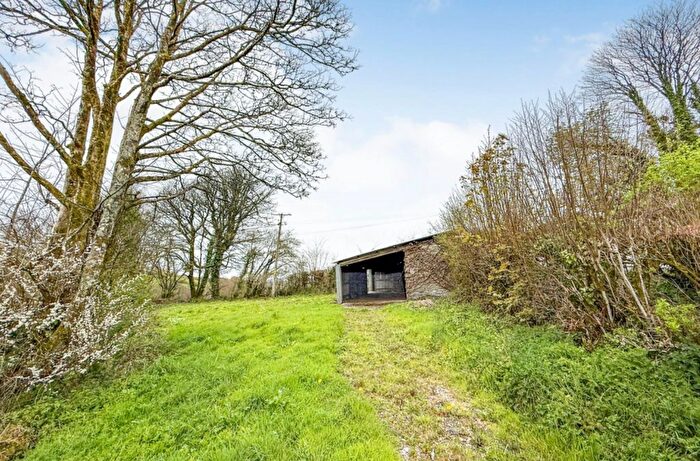
Houses and Flats for sale in TQ, Torquay
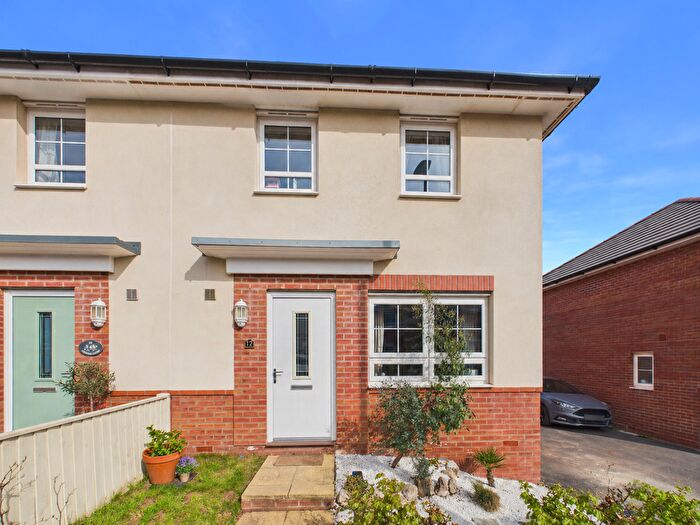
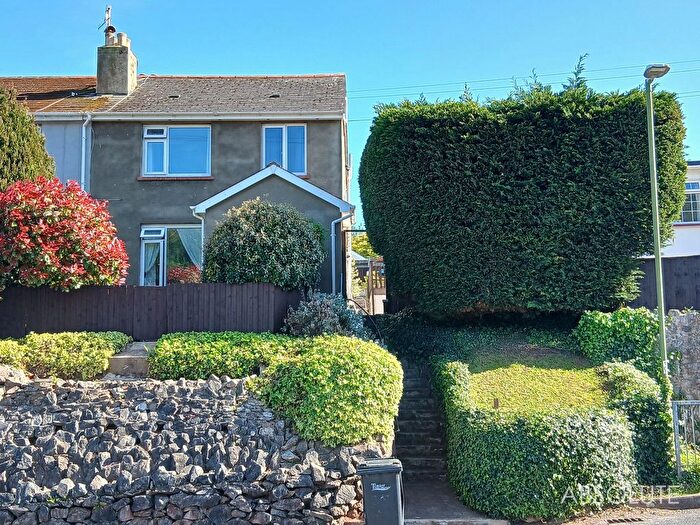
![]()
If you are looking to sell your house, let it out, or receive a property valuation, an expert can help you.
Click the button below to get started.
Postcode districts in TQ, Torquay
Navigate through our locations to find the location of your next house in TQ, Torquay, England for sale or to rent.
Transport in TQ, Torquay
Please see below transportation links in this area:

Frequently asked questions about TQ
What is the average price for a property for sale in TQ?
The average price for a property for sale in TQ is £344,221. This amount is 4% lower than the average price in England. There are 1,077 property listings for sale in TQ.
What locations have the most expensive properties for sale in TQ?
The locations with the most expensive properties for sale in TQ are TQ8 at an average of £1,001,003, TQ6 at an average of £516,783 and TQ7 at an average of £488,688.
What locations have the most affordable properties for sale in TQ?
The locations with the most affordable properties for sale in TQ are TQ1 at an average of £262,133, TQ3 at an average of £263,863 and TQ2 at an average of £273,090.
Which train stations are available in or near TQ?
Some of the train stations available in or near TQ are Paignton, Totnes and Torquay.