
Properties for sale in TQ9
Totnes
- Info
- Price Paid By Year
- Property Type Price
- Transport
House Prices in TQ9
Properties in TQ9 have an average house price of £483,742.00 and had 855 Property Transactions within the last 3 years.
The most expensive property was sold for £2,300,000.00.
Property Price Paid in TQ9 by Year
The average sold property price by year was:
| Year | Average Sold Price | Sold Properties |
|---|---|---|
| 2026 | £421,500.00 | 15 Properties |
| 2025 | £456,755.00 | 262 Properties |
| 2024 | £490,303.00 | 301 Properties |
| 2023 | £505,510.00 | 277 Properties |
| 2022 | £489,167.00 | 352 Properties |
| 2021 | £403,635.00 | 465 Properties |
| 2020 | £390,718.00 | 330 Properties |
| 2019 | £368,401.00 | 352 Properties |
| 2018 | £367,129.00 | 431 Properties |
| 2017 | £349,168.00 | 384 Properties |
| 2016 | £307,495.00 | 453 Properties |
| 2015 | £310,688.00 | 330 Properties |
| 2014 | £290,198.00 | 331 Properties |
| 2013 | £327,442.00 | 278 Properties |
| 2012 | £286,984.00 | 269 Properties |
| 2011 | £279,396.00 | 273 Properties |
| 2010 | £304,530.00 | 297 Properties |
| 2009 | £273,439.00 | 274 Properties |
| 2008 | £284,982.00 | 214 Properties |
| 2007 | £316,597.00 | 340 Properties |
| 2006 | £275,582.00 | 396 Properties |
| 2005 | £274,349.00 | 334 Properties |
| 2004 | £250,777.00 | 371 Properties |
| 2003 | £225,196.00 | 401 Properties |
| 2002 | £177,461.00 | 423 Properties |
| 2001 | £151,923.00 | 393 Properties |
| 2000 | £132,245.00 | 407 Properties |
| 1999 | £106,803.00 | 432 Properties |
| 1998 | £91,752.00 | 362 Properties |
| 1997 | £84,704.00 | 415 Properties |
| 1996 | £84,269.00 | 413 Properties |
| 1995 | £85,718.00 | 320 Properties |
Property Price per Property Type in TQ9
Here you can find historic sold price data in order to help with your property search.
The average Property Paid Price for specific property types in the last three years are:
| Property Type | Average Sold Price | Sold Properties |
|---|---|---|
| Semi Detached House | £438,323.00 | 199 Semi Detached Houses |
| Detached House | £669,318.00 | 292 Detached Houses |
| Terraced House | £389,066.00 | 253 Terraced Houses |
| Flat | £292,780.00 | 111 Flats |
Transport near TQ9

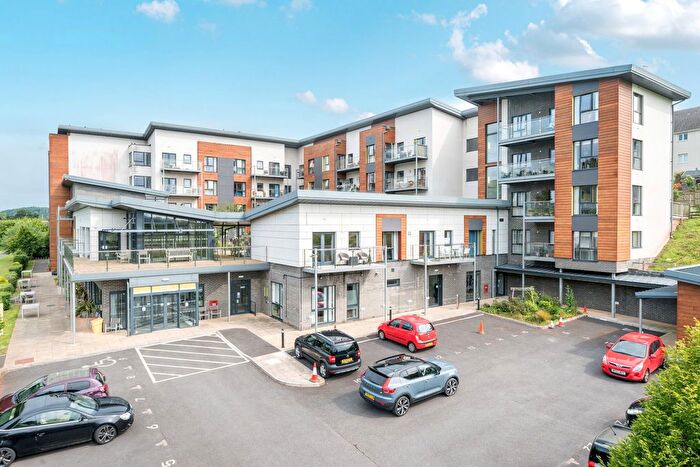
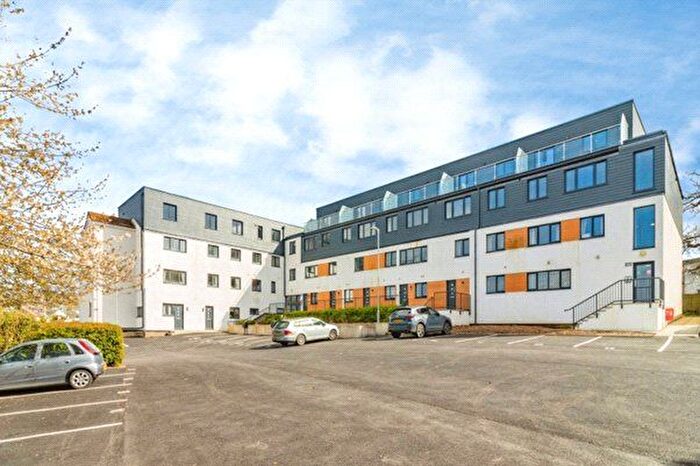
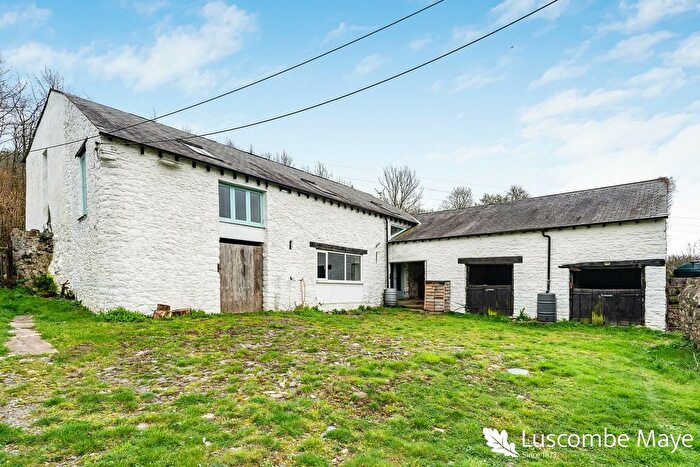
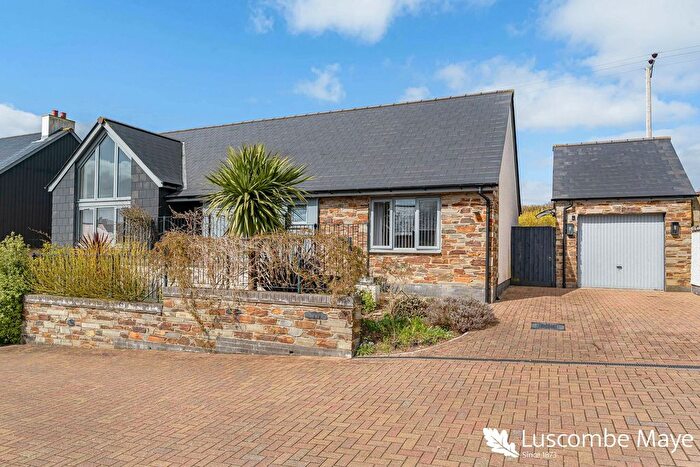
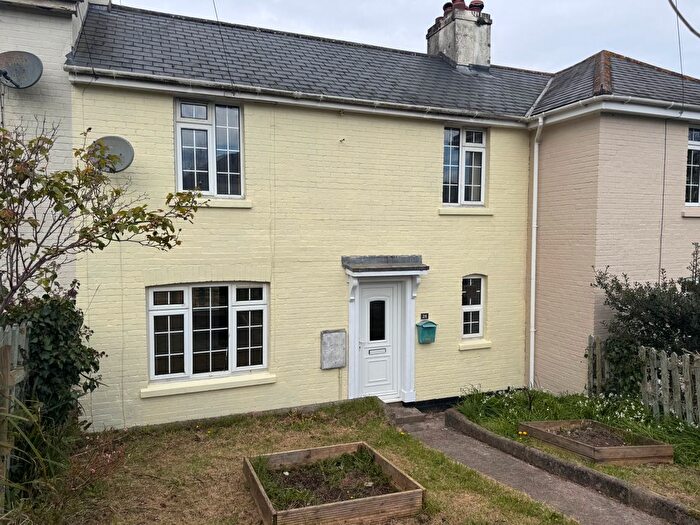
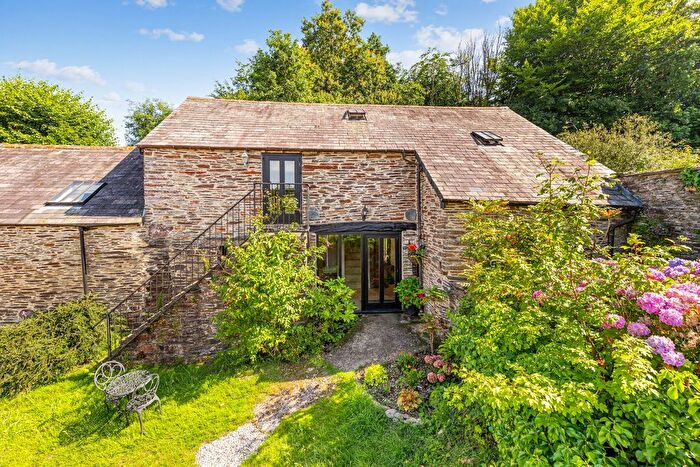
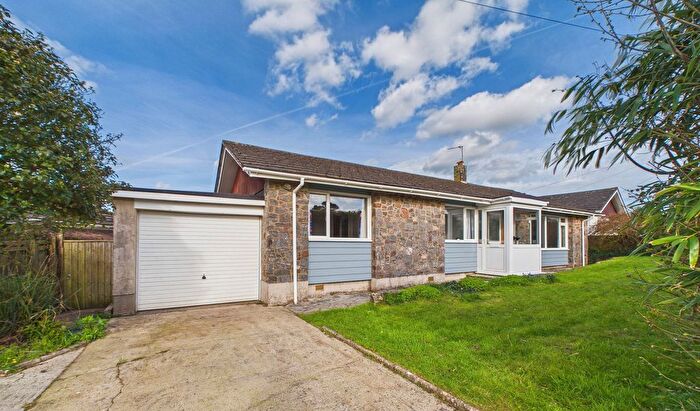
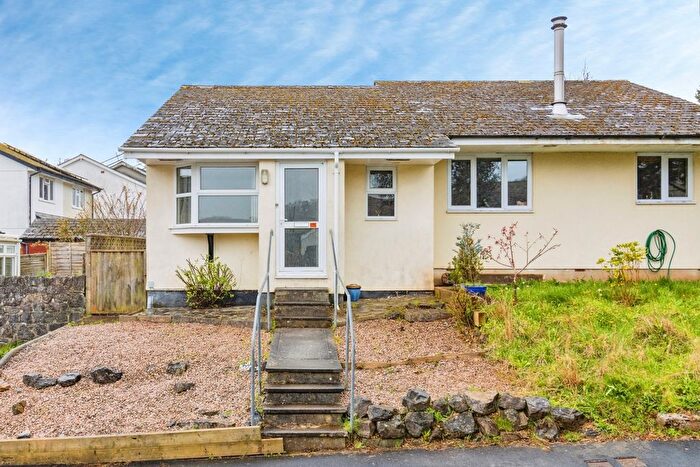
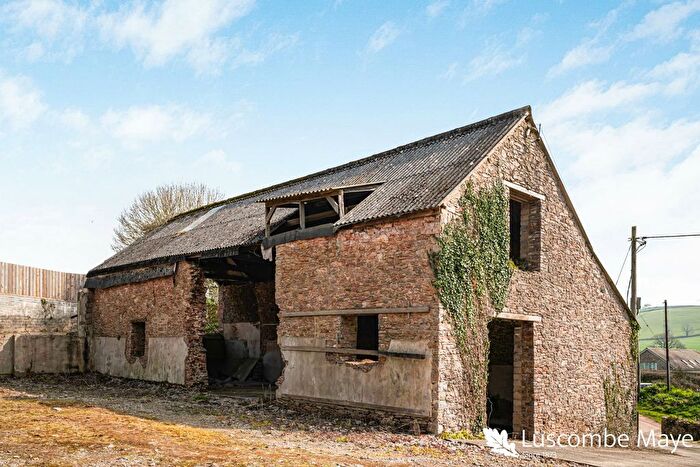
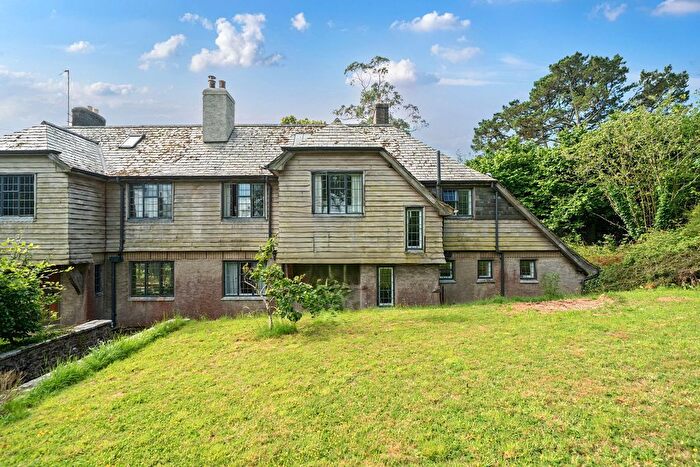
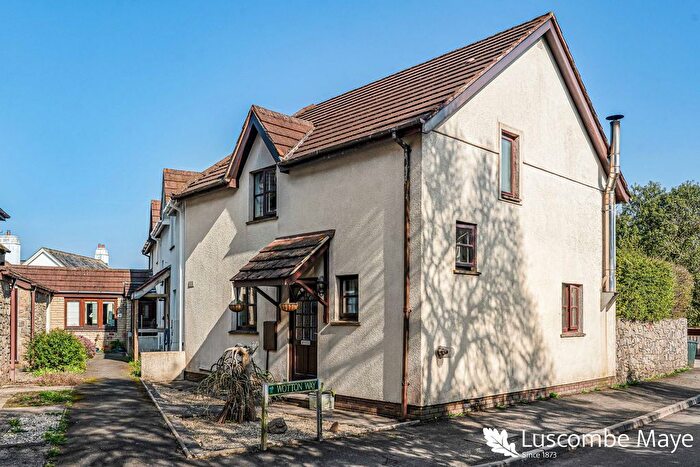
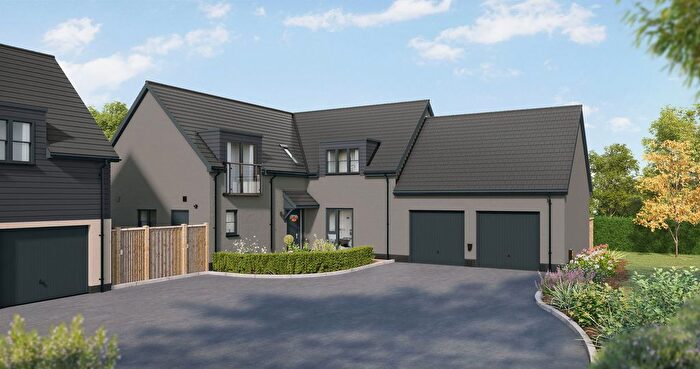
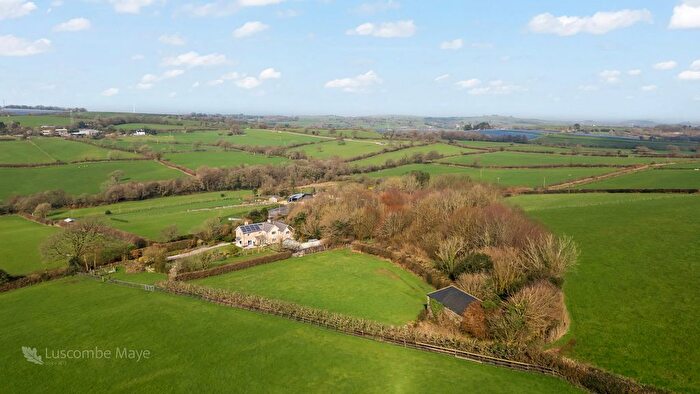
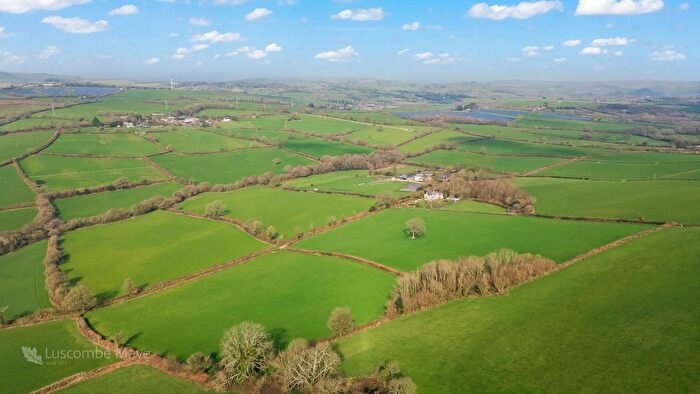
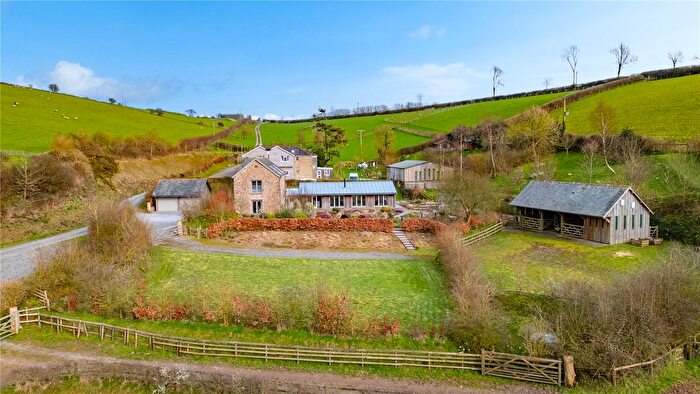
Houses and Flats for sale in TQ9, Totnes
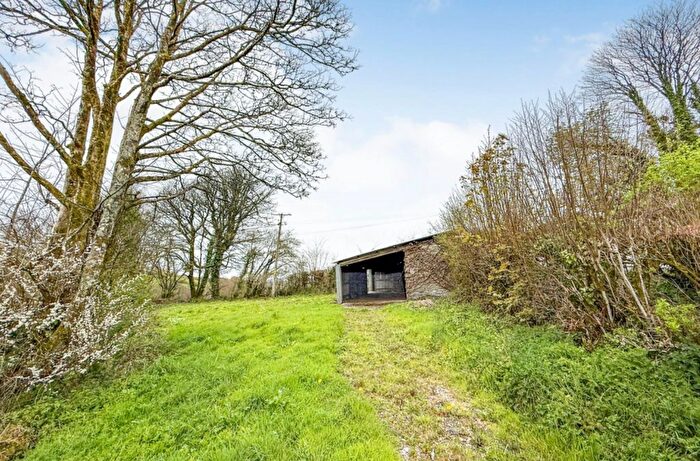
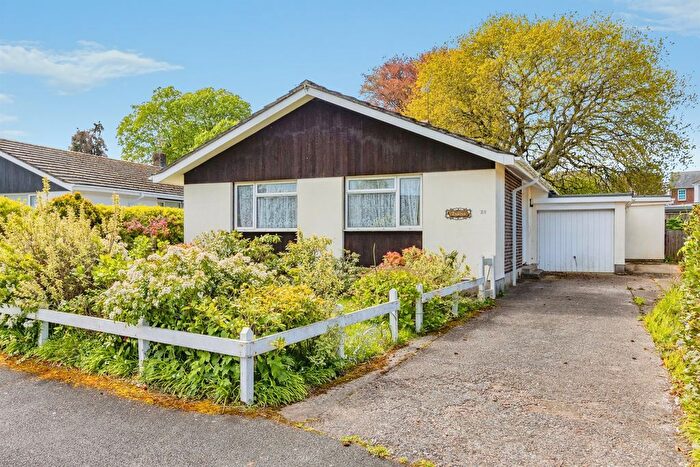
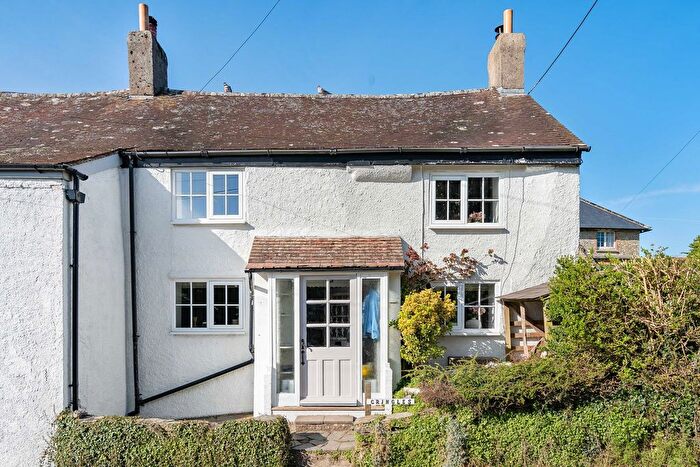
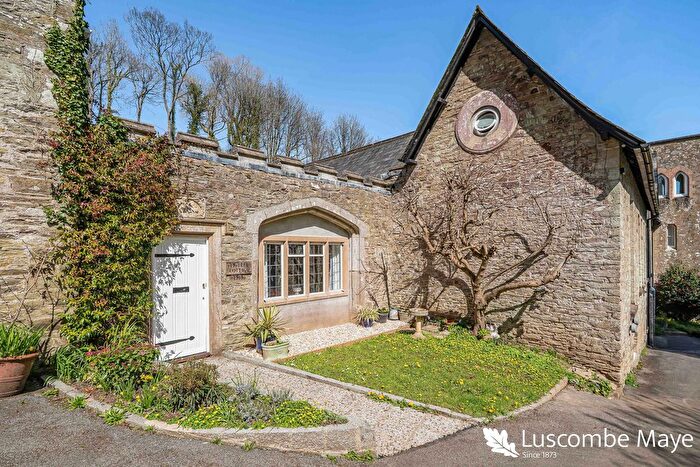
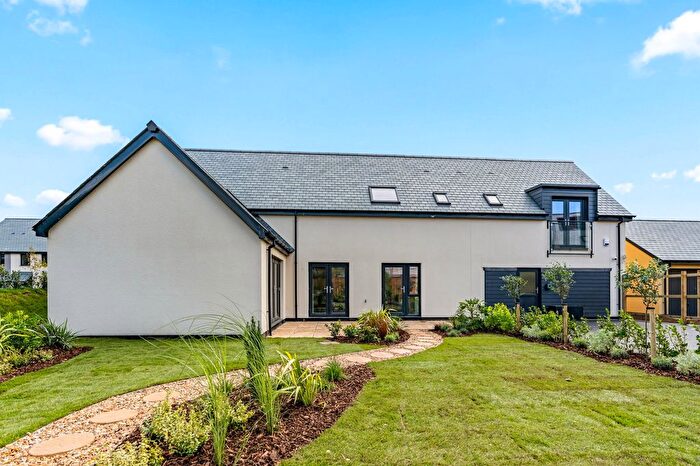
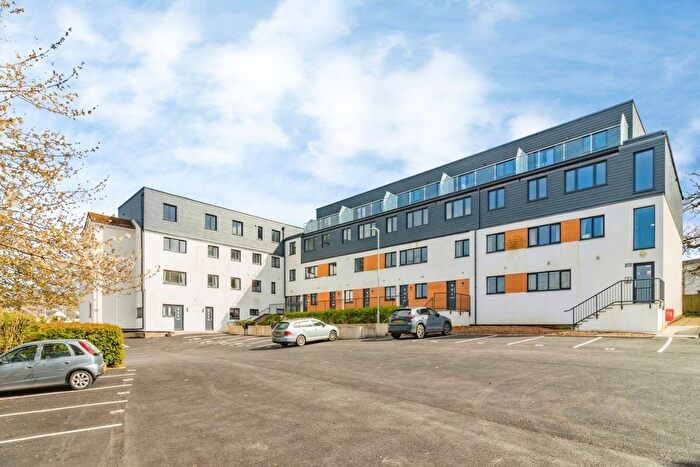
![]()
If you are looking to sell your house, let it out, or receive a property valuation, an expert can help you.
Click the button below to get started.
Frequently Asked Questions about TQ9
What is the average price for a property for sale in TQ9?
The average price for a property for sale in TQ9 is £483,742. There are 56 property listings for sale in TQ9.
Which areas are included in the TQ9 postcode district?
The main area within TQ9 is Totnes.
What are the most common property types in TQ9?
The most common property types in TQ9 are Detached Houses, Terraced Houses, Semi Detached Houses and Flats.
What has been the average sold property price in TQ9 over the last three years?
Detached Houses in TQ9 have an average sold price of £669,318, while Terraced Houses have an average of £389,066. Semi Detached Houses have an average of £438,323 and Flats have an average of £292,780. The average sold property price in TQ9 over the last three years is approximately £456,186.
Which train stations are available in TQ9?
The train station available in TQ9 is Totnes Station..