
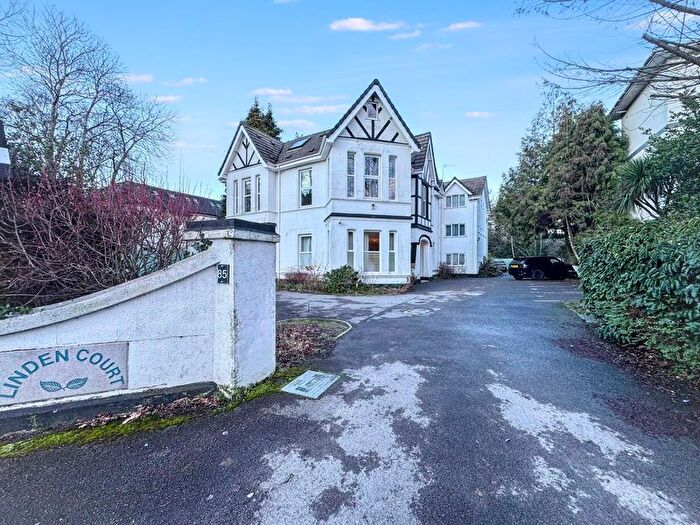
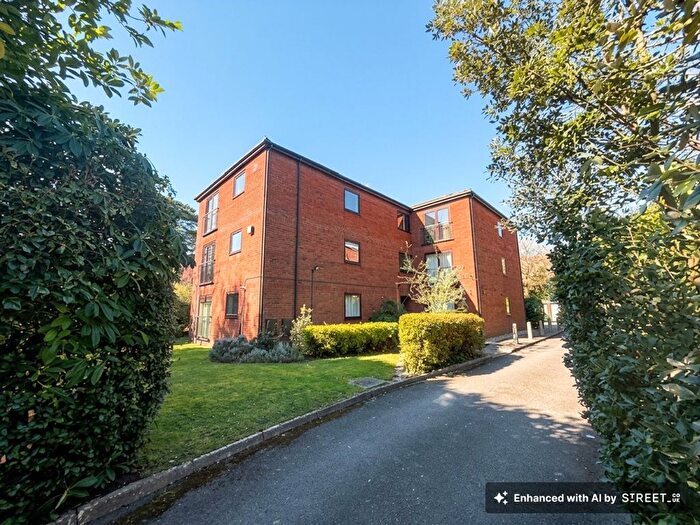
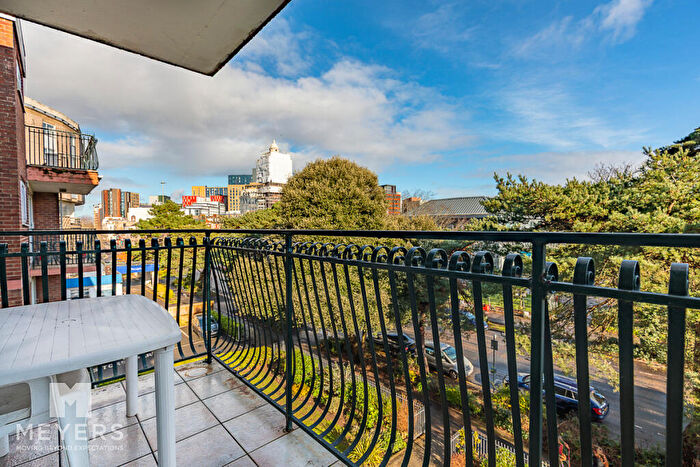
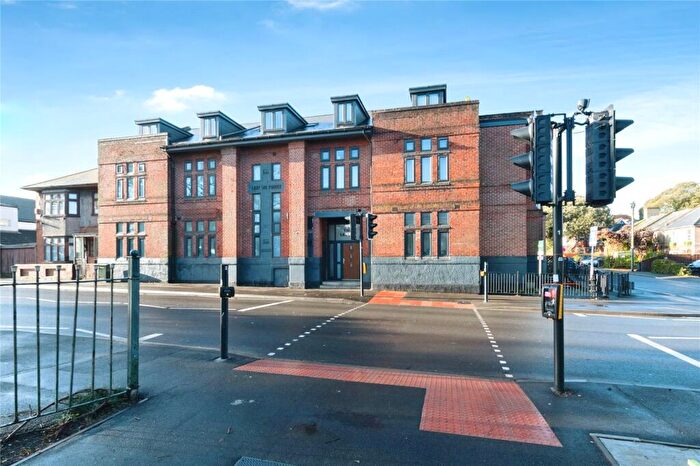
Properties for sale in BH1
Bournemouth town centre, Springbourne, East Cliff, Boscombe
- Info
- Price Paid By Year
- Property Type Price
- Transport
House Prices in BH1
Properties in BH1 have an average house price of £242,767.00 and had 1053 Property Transactions within the last 3 years.
The most expensive property was sold for £1,600,000.00.
Property Price Paid in BH1 by Year
The average sold property price by year was:
| Year | Average Sold Price | Sold Properties |
|---|---|---|
| 2026 | £226,717.00 | 31 Properties |
| 2025 | £235,368.00 | 320 Properties |
| 2024 | £238,335.00 | 337 Properties |
| 2023 | £254,709.00 | 365 Properties |
| 2022 | £245,078.00 | 554 Properties |
| 2021 | £228,654.00 | 544 Properties |
| 2020 | £217,314.00 | 437 Properties |
| 2019 | £205,774.00 | 498 Properties |
| 2018 | £204,765.00 | 585 Properties |
| 2017 | £197,428.00 | 647 Properties |
| 2016 | £180,479.00 | 689 Properties |
| 2015 | £189,938.00 | 630 Properties |
| 2014 | £180,751.00 | 548 Properties |
| 2013 | £170,852.00 | 433 Properties |
| 2012 | £174,981.00 | 301 Properties |
| 2011 | £184,547.00 | 327 Properties |
| 2010 | £186,234.00 | 284 Properties |
| 2009 | £167,735.00 | 290 Properties |
| 2008 | £183,289.00 | 404 Properties |
| 2007 | £190,576.00 | 830 Properties |
| 2006 | £174,298.00 | 812 Properties |
| 2005 | £173,046.00 | 674 Properties |
| 2004 | £166,075.00 | 797 Properties |
| 2003 | £157,126.00 | 957 Properties |
| 2002 | £127,947.00 | 875 Properties |
| 2001 | £107,039.00 | 838 Properties |
| 2000 | £96,541.00 | 818 Properties |
| 1999 | £70,444.00 | 828 Properties |
| 1998 | £67,040.00 | 776 Properties |
| 1997 | £59,228.00 | 694 Properties |
| 1996 | £54,010.00 | 572 Properties |
| 1995 | £53,927.00 | 495 Properties |
Property Price per Property Type in BH1
Here you can find historic sold price data in order to help with your property search.
The average Property Paid Price for specific property types in the last three years are:
| Property Type | Average Sold Price | Sold Properties |
|---|---|---|
| Semi Detached House | £306,641.00 | 64 Semi Detached Houses |
| Detached House | £416,474.00 | 41 Detached Houses |
| Terraced House | £268,969.00 | 115 Terraced Houses |
| Flat | £225,692.00 | 833 Flats |
Transport near BH1

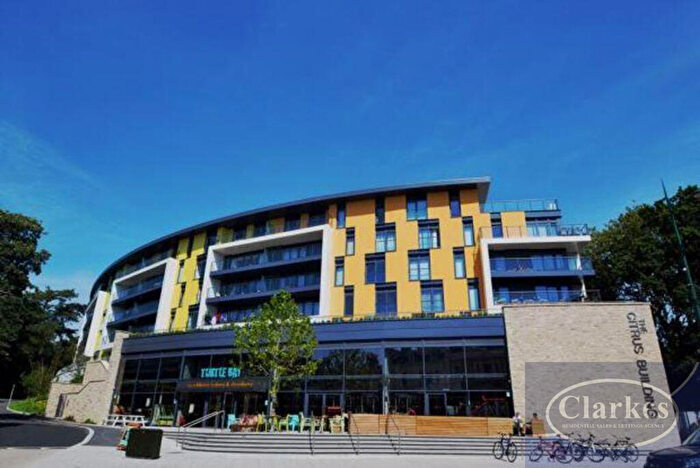
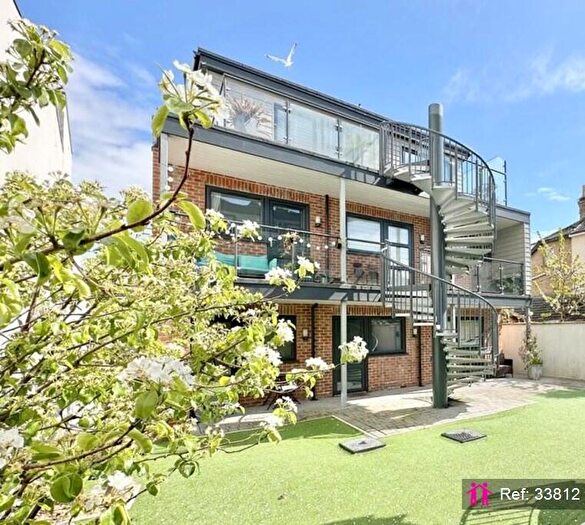
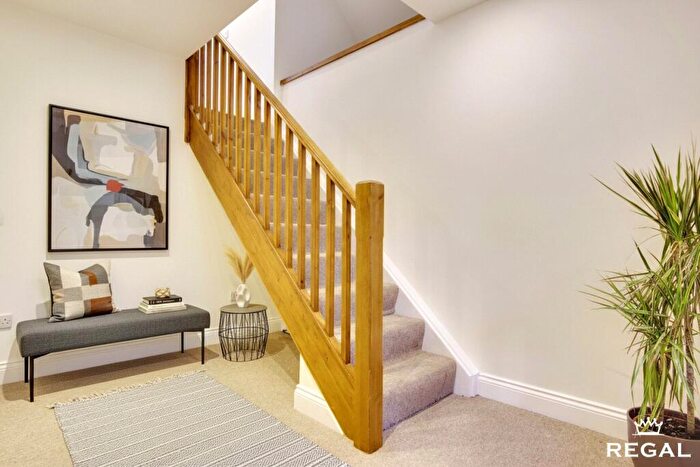
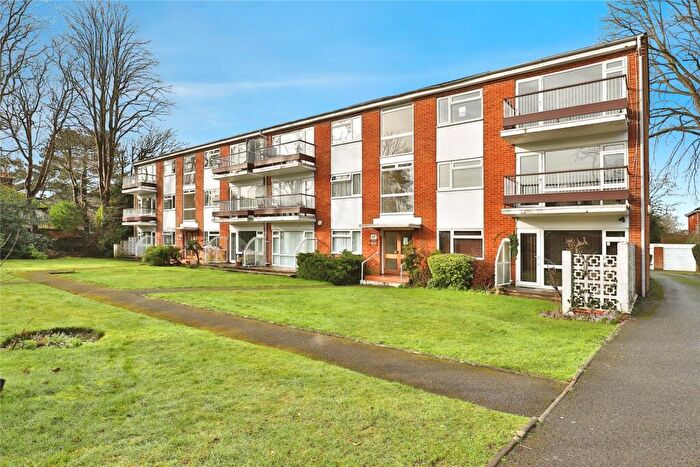
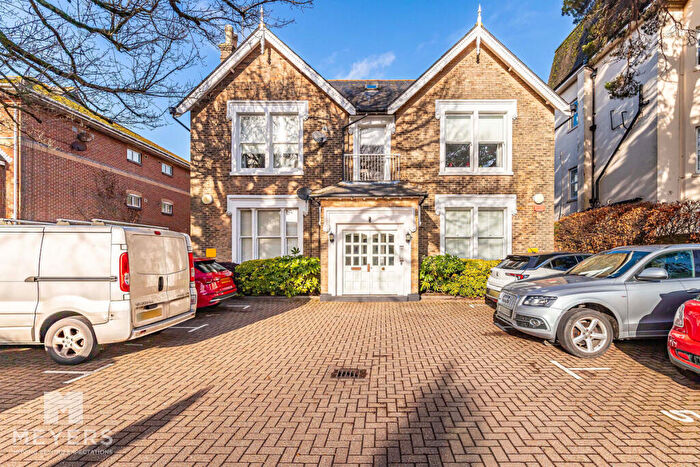
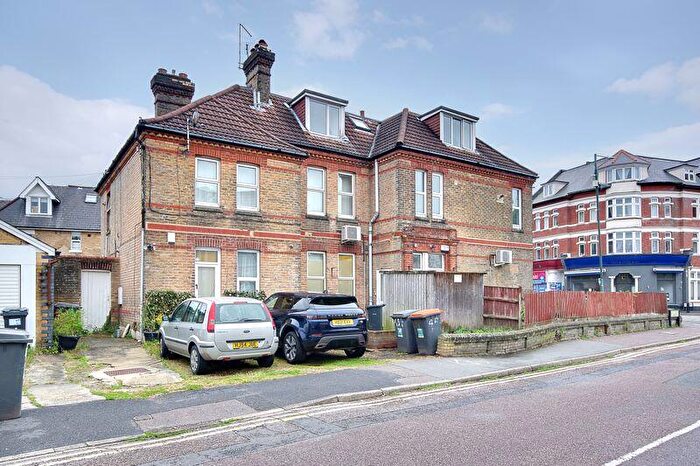
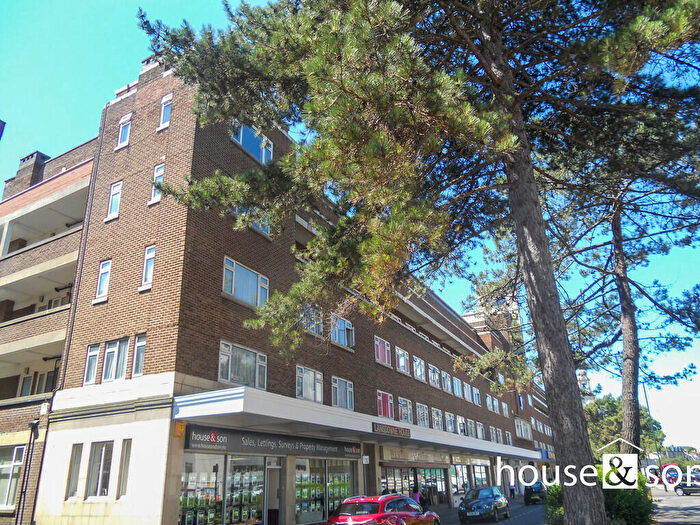
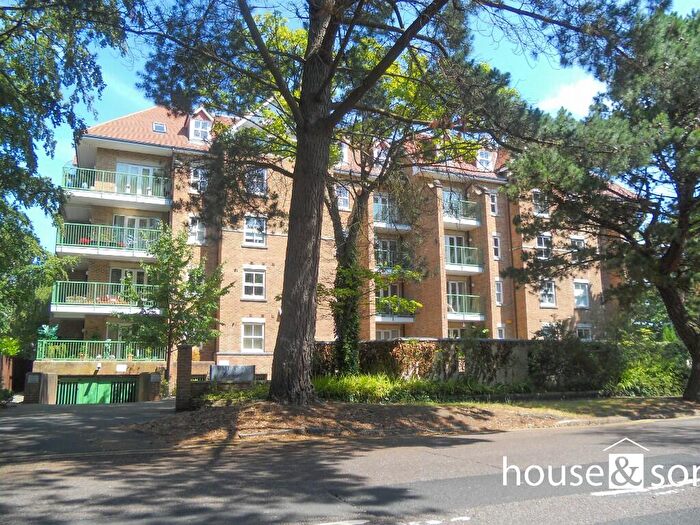
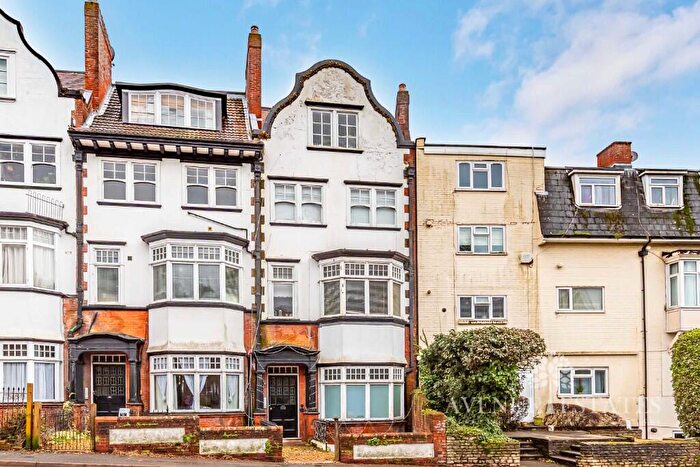
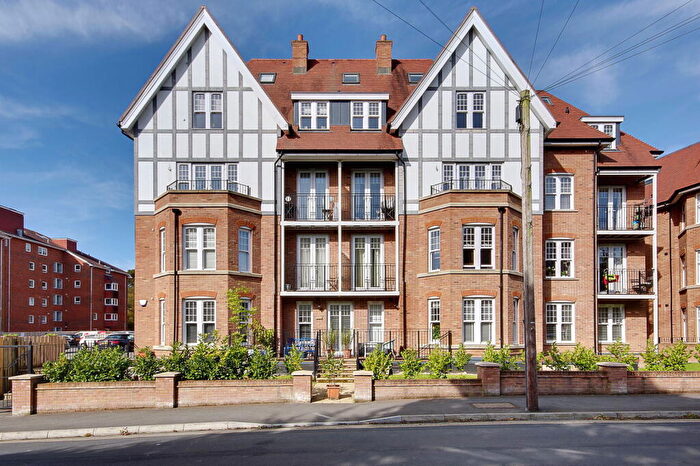
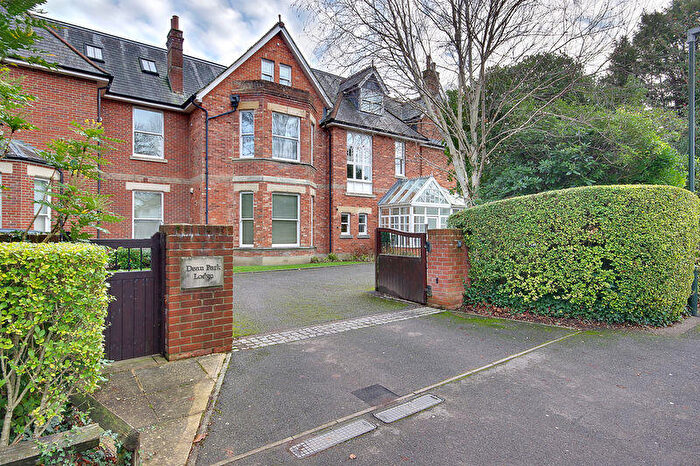
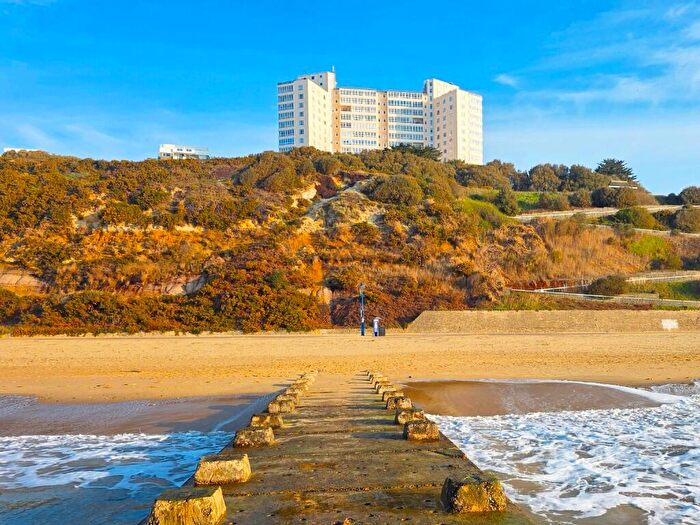
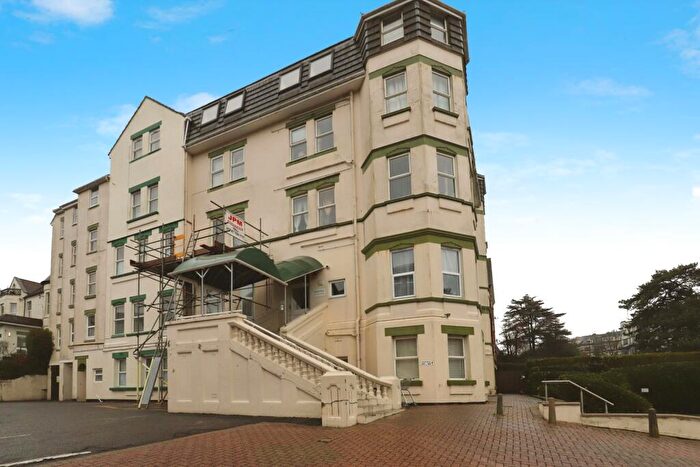
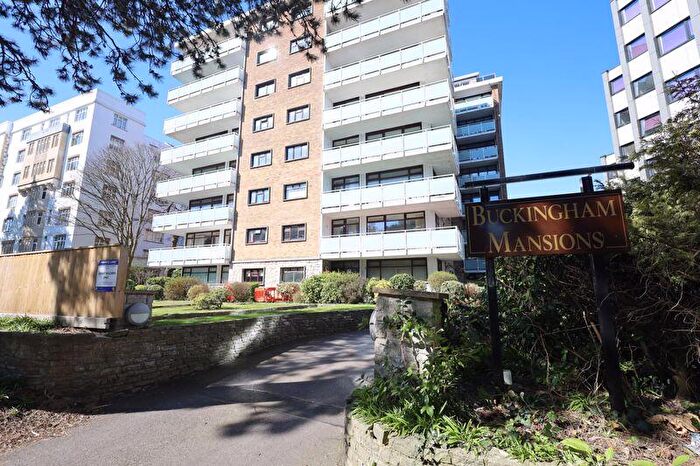
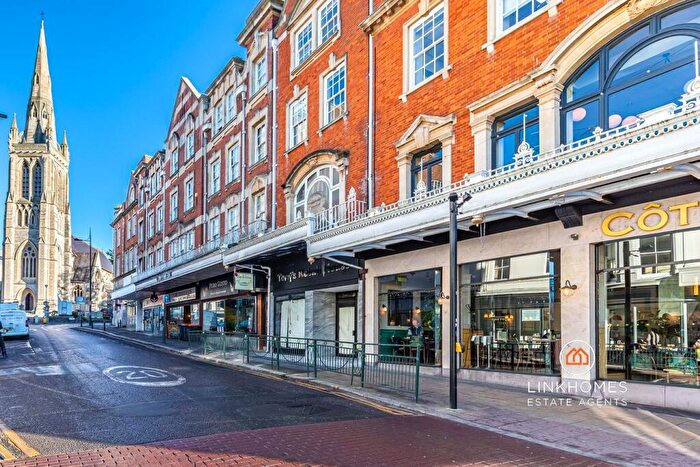
Houses and Flats for sale in BH1, Bournemouth town centre, Springbourne, East Cliff, Boscombe
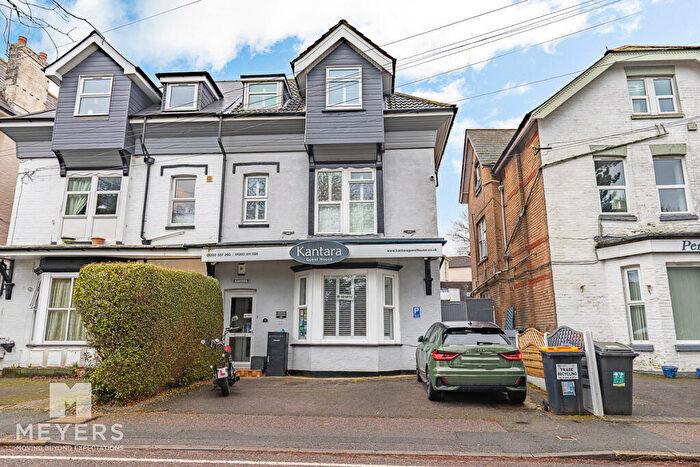
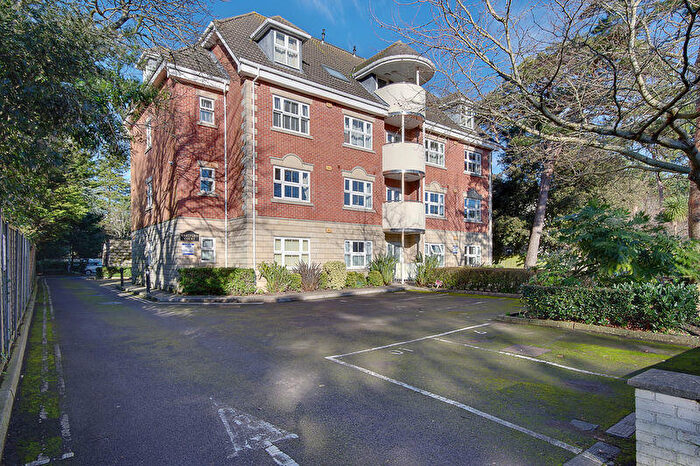
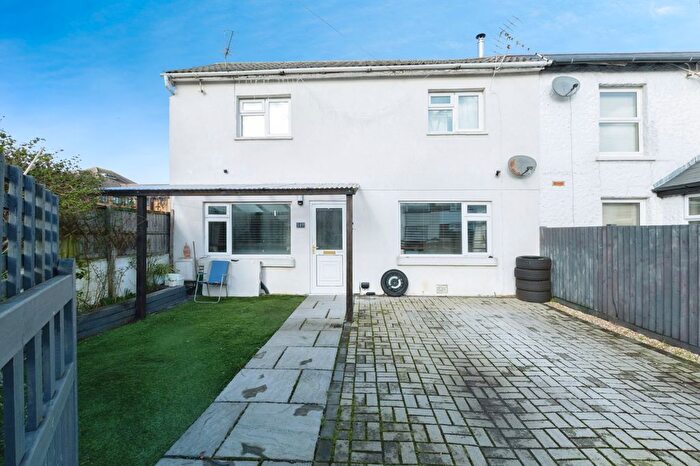
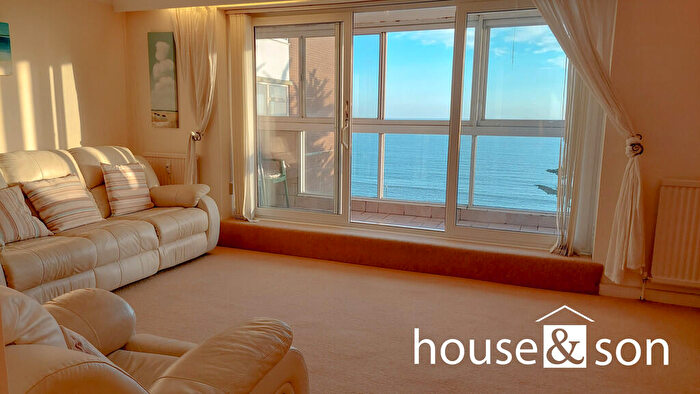

![]()
If you are looking to sell your house, let it out, or receive a property valuation, an expert can help you.
Click the button below to get started.
Frequently Asked Questions about BH1
What is the average price for a property for sale in BH1?
The average price for a property for sale in BH1 is £242,767. There are 319 property listings for sale in BH1.
Which areas are included in the BH1 postcode district?
The main areas within BH1 include Bournemouth town centre, Springbourne, East Cliff and Boscombe.
What are the most common property types in BH1?
The most common property types in BH1 are Flats, Terraced Houses, Semi Detached Houses and Detached Houses.
What has been the average sold property price in BH1 over the last three years?
Flats in BH1 have an average sold price of £225,692, while Terraced Houses have an average of £268,969. Semi Detached Houses have an average of £306,641 and Detached Houses have an average of £416,474. The average sold property price in BH1 over the last three years is approximately £233,473.
Which train stations are available in BH1?
The train stations available in BH1 are Branksome Station, Hamworthy Station, Holton Heath Station, Parkstone Station and Poole Station..