
Properties for sale in BH
Bournemouth
- Info
- Price Paid By Year
- Property Type Price
House Prices in BH
Properties in BH have an average house price of £411,161 and had 26011 Property Transactions within the last 3 years.
The most expensive property was sold for £13,500,000.
Property Price Paid in BH by Year
The average sold property price by year was:
| Year | Average Sold Price | Sold Properties |
|---|---|---|
| 2026 | £399,146.00 | 751 Properties |
| 2025 | £404,259.00 | 8,171 Properties |
| 2024 | £409,134.00 | 8,842 Properties |
| 2023 | £421,267.00 | 8,247 Properties |
| 2022 | £427,145.00 | 10,546 Properties |
| 2021 | £403,351.00 | 14,062 Properties |
| 2020 | £372,450.00 | 9,806 Properties |
| 2019 | £344,806.00 | 10,503 Properties |
| 2018 | £339,305.00 | 11,184 Properties |
| 2017 | £333,489.00 | 11,956 Properties |
| 2016 | £311,682.00 | 12,386 Properties |
| 2015 | £300,793.00 | 12,597 Properties |
| 2014 | £281,705.00 | 12,282 Properties |
| 2013 | £264,596.00 | 10,383 Properties |
| 2012 | £262,947.00 | 8,422 Properties |
| 2011 | £262,272.00 | 8,729 Properties |
| 2010 | £262,182.00 | 8,743 Properties |
| 2009 | £240,279.00 | 9,044 Properties |
| 2008 | £258,873.00 | 7,971 Properties |
| 2007 | £262,671.00 | 16,076 Properties |
| 2006 | £243,555.00 | 16,874 Properties |
| 2005 | £228,043.00 | 12,818 Properties |
| 2004 | £222,477.00 | 15,145 Properties |
| 2003 | £199,636.00 | 15,092 Properties |
| 2002 | £170,779.00 | 17,402 Properties |
| 2001 | £142,088.00 | 16,376 Properties |
| 2000 | £128,853.00 | 14,560 Properties |
| 1999 | £108,009.00 | 16,953 Properties |
| 1998 | £95,581.00 | 14,426 Properties |
| 1997 | £86,890.00 | 15,582 Properties |
| 1996 | £77,238.00 | 13,858 Properties |
| 1995 | £73,483.00 | 10,605 Properties |
Property Price per Property Type in BH
Here you can find historic sold price data in order to help with your property search.
The average Property Paid Price for specific property types in the last three years are:
| Property Type | Average Sold Price | Sold Properties |
|---|---|---|
| Semi Detached House | £366,168.00 | 4,156 Semi Detached Houses |
| Terraced House | £326,426.00 | 3,387 Terraced Houses |
| Detached House | £583,577.00 | 10,352 Detached Houses |
| Flat | £249,644.00 | 8,116 Flats |
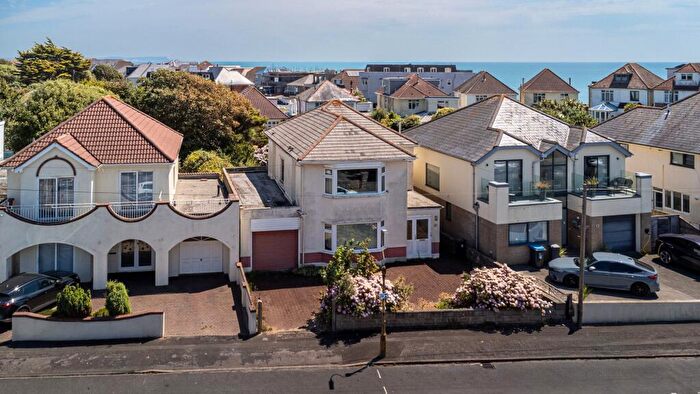
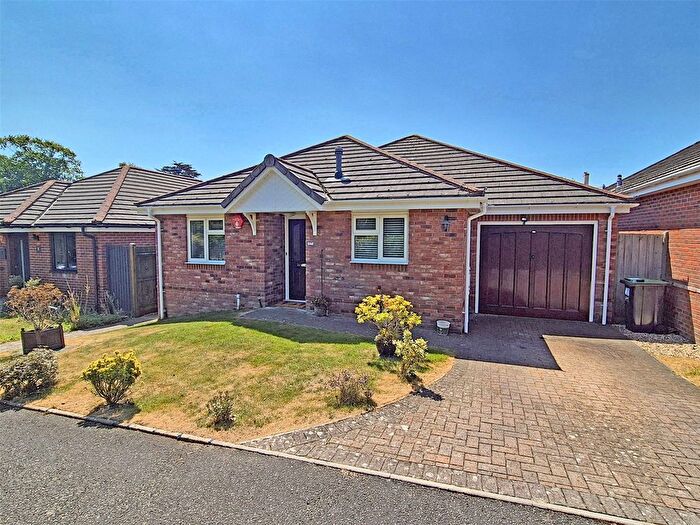
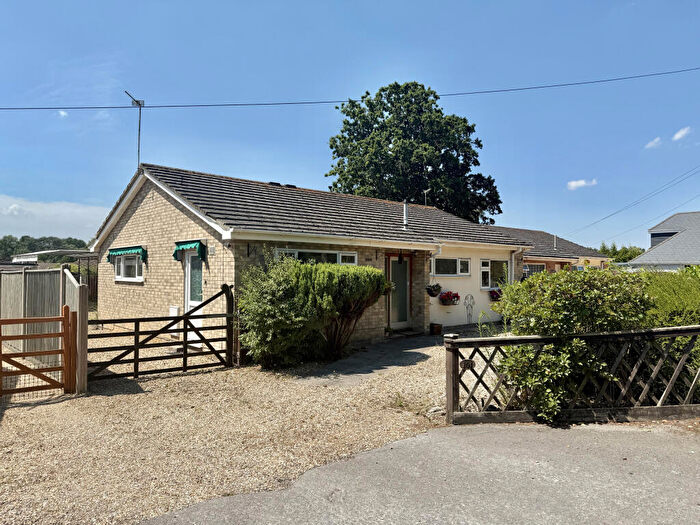
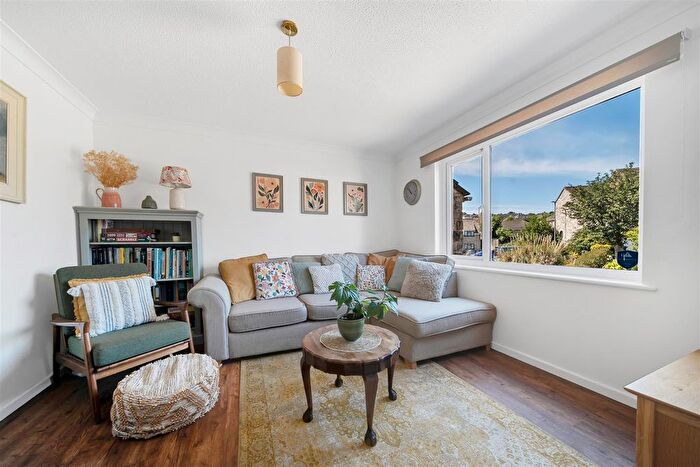
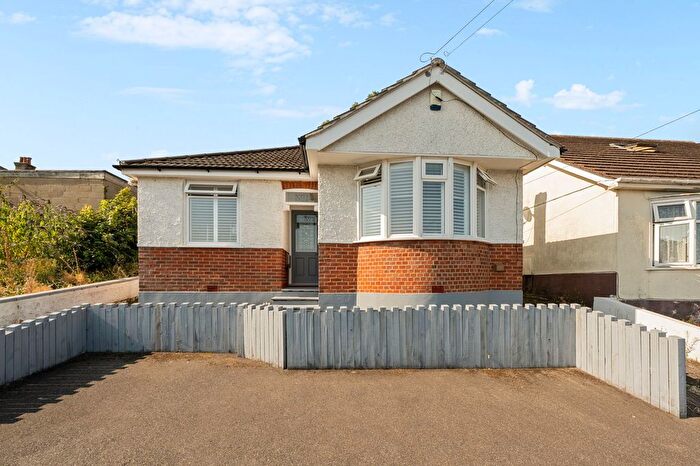
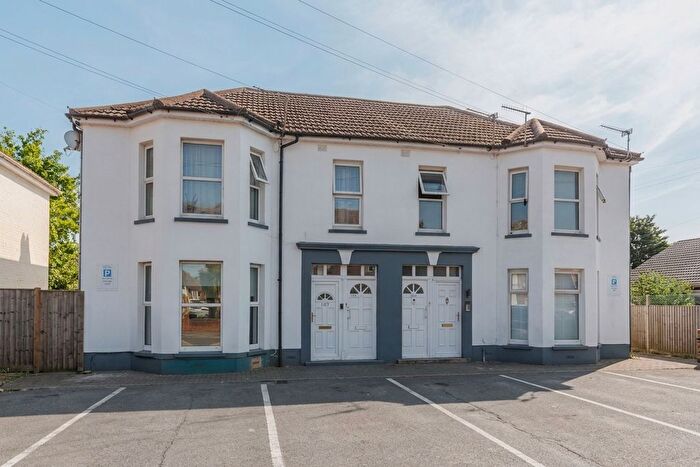
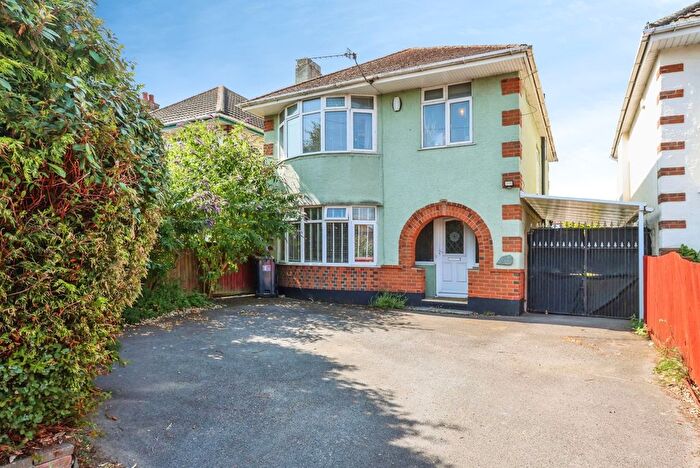
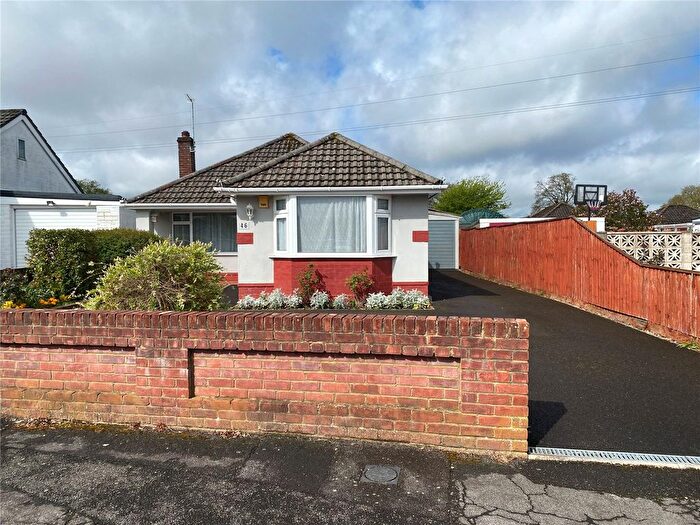
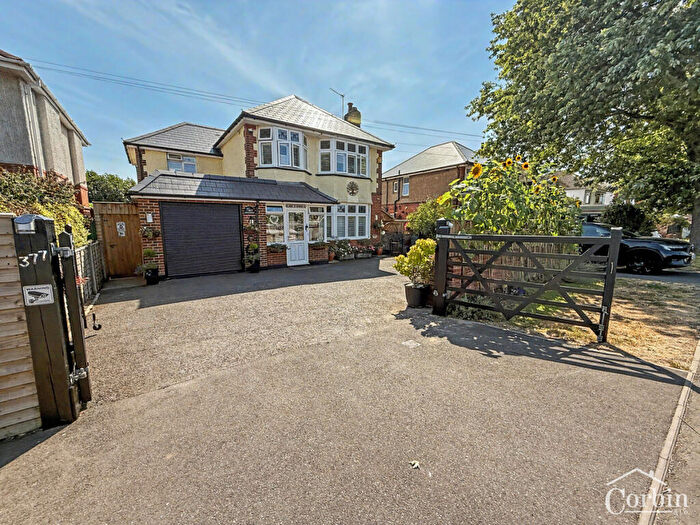
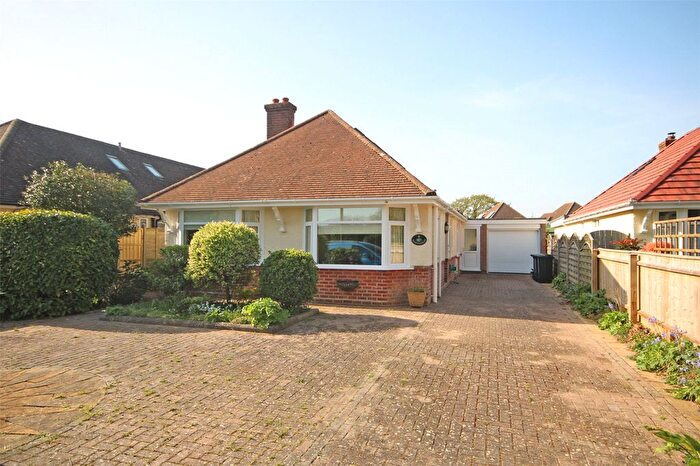
Houses and Flats for sale in BH, Bournemouth
There are 6,830 results. Property prices in BH range from £14k to £12.5M with an average price of £527k.
![]()
If you are looking to sell your house, let it out, or receive a property valuation, an expert can help you.
Click the button below to get started.
Postcode districts in BH, Bournemouth
Navigate through our locations to find the location of your next house in BH, Bournemouth, England for sale or to rent.
Transport in BH, Bournemouth
Please see below transportation links in this area:
-
 Bournemouth Station
 -
Branksome Station
-
Parkstone Station
-
Pokesdown Station
-
Poole Station
-
Christchurch Station
Frequently asked questions about BH
What is the average price for a property for sale in BH?
The average price for a property for sale in BH is £411,161. This amount is 14% higher than the average price in England. There are 6,830 property listings for sale in BH.
What locations have the most expensive properties for sale in BH?
The locations with the most expensive properties for sale in BH are BH13 at an average of £901,851, BH3 at an average of £605,050 and BH14 at an average of £548,704.
What locations have the most affordable properties for sale in BH?
The locations with the most affordable properties for sale in BH are BH2 at an average of £234,657, BH1 at an average of £242,767 and BH5 at an average of £310,968.
Which train stations are available in or near BH?
Some of the train stations available in or near BH are Bournemouth, Branksome and Parkstone.