
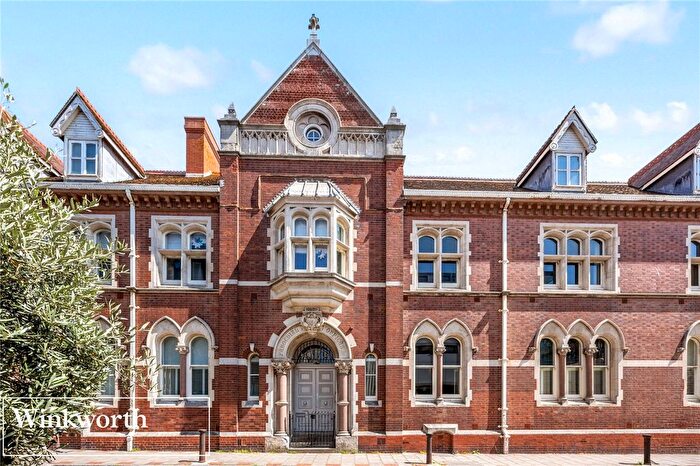
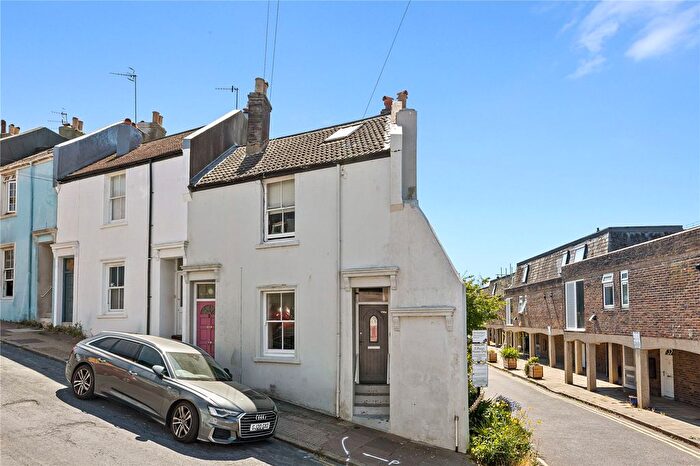
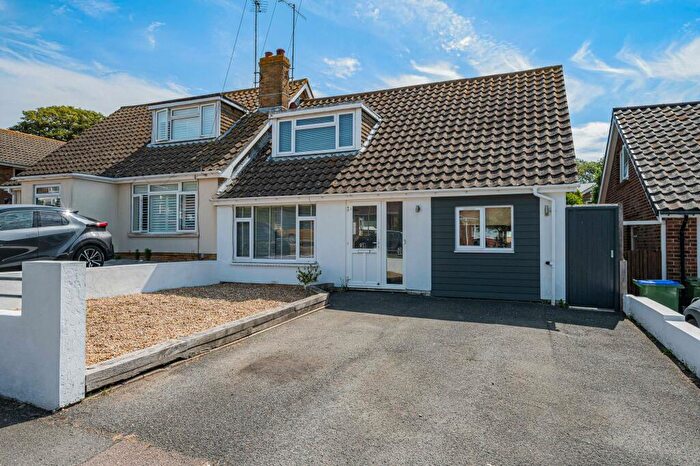
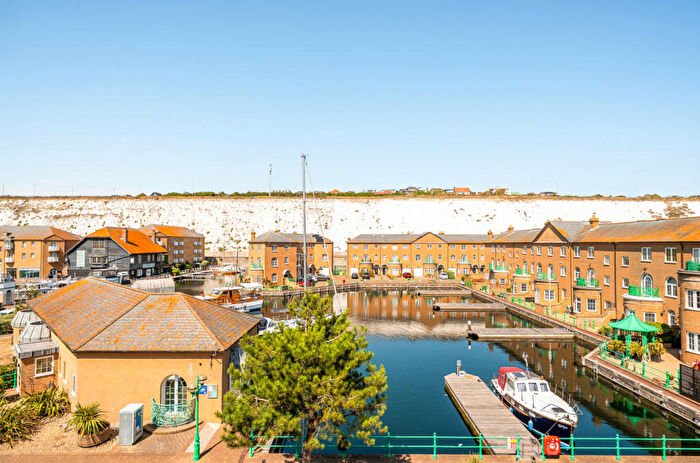
Properties for sale in BN2
Brighton, Bevendean, Brighton Marina, Kemptown, Moulsecoomb, Ovingdean, Rottingdean, Saltdean, Woodingdean
- Info
- Price Paid By Year
- Property Type Price
- Transport
House Prices in BN2
Properties in BN2 have an average house price of £443,842.00 and had 3380 Property Transactions within the last 3 years.
The most expensive property was sold for £3,850,000.00.
Property Price Paid in BN2 by Year
The average sold property price by year was:
| Year | Average Sold Price | Sold Properties |
|---|---|---|
| 2026 | £424,292.00 | 90 Properties |
| 2025 | £446,828.00 | 1,114 Properties |
| 2024 | £435,520.00 | 1,194 Properties |
| 2023 | £452,366.00 | 982 Properties |
| 2022 | £451,161.00 | 1,414 Properties |
| 2021 | £432,731.00 | 1,857 Properties |
| 2020 | £404,903.00 | 1,172 Properties |
| 2019 | £398,502.00 | 1,270 Properties |
| 2018 | £388,622.00 | 1,342 Properties |
| 2017 | £377,768.00 | 1,494 Properties |
| 2016 | £366,510.00 | 1,877 Properties |
| 2015 | £323,187.00 | 1,700 Properties |
| 2014 | £304,901.00 | 1,731 Properties |
| 2013 | £276,935.00 | 1,468 Properties |
| 2012 | £269,135.00 | 1,311 Properties |
| 2011 | £262,009.00 | 1,343 Properties |
| 2010 | £262,776.00 | 1,418 Properties |
| 2009 | £225,813.00 | 1,260 Properties |
| 2008 | £258,461.00 | 1,061 Properties |
| 2007 | £253,006.00 | 2,312 Properties |
| 2006 | £228,276.00 | 2,515 Properties |
| 2005 | £209,879.00 | 1,964 Properties |
| 2004 | £197,484.00 | 2,259 Properties |
| 2003 | £184,579.00 | 2,255 Properties |
| 2002 | £165,386.00 | 2,665 Properties |
| 2001 | £140,912.00 | 2,639 Properties |
| 2000 | £114,879.00 | 2,281 Properties |
| 1999 | £94,930.00 | 2,779 Properties |
| 1998 | £78,386.00 | 2,279 Properties |
| 1997 | £69,741.00 | 2,344 Properties |
| 1996 | £61,485.00 | 2,012 Properties |
| 1995 | £57,313.00 | 1,547 Properties |
Property Price per Property Type in BN2
Here you can find historic sold price data in order to help with your property search.
The average Property Paid Price for specific property types in the last three years are:
| Property Type | Average Sold Price | Sold Properties |
|---|---|---|
| Semi Detached House | £464,210.00 | 489 Semi Detached Houses |
| Terraced House | £493,769.00 | 1,204 Terraced Houses |
| Detached House | £624,151.00 | 497 Detached Houses |
| Flat | £309,653.00 | 1,190 Flats |

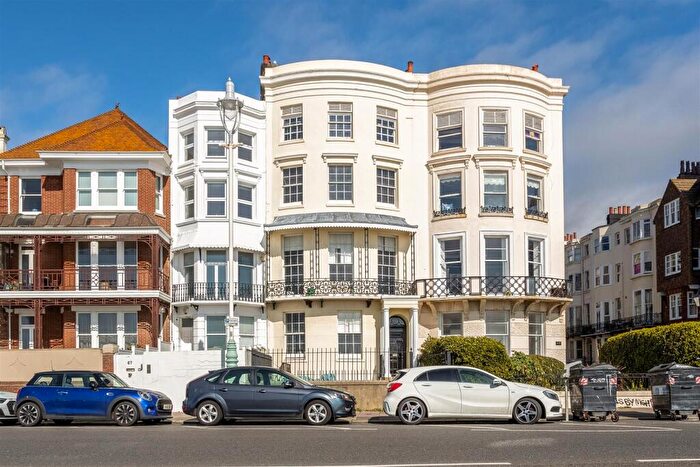
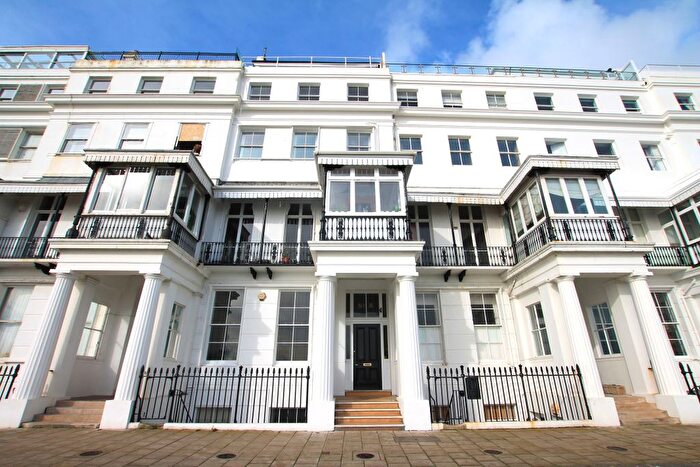
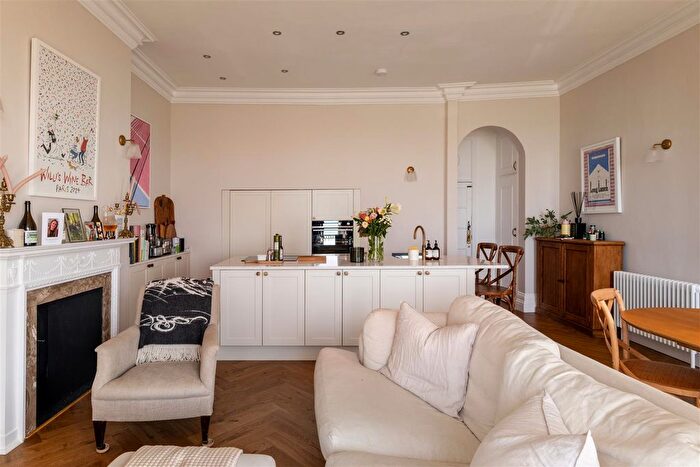
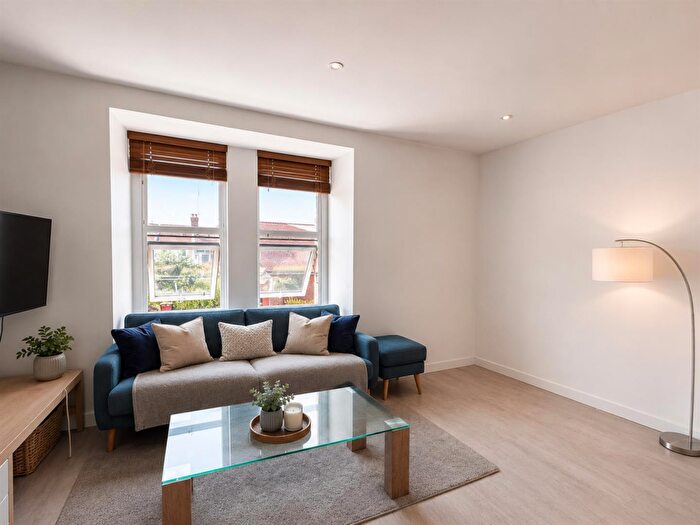
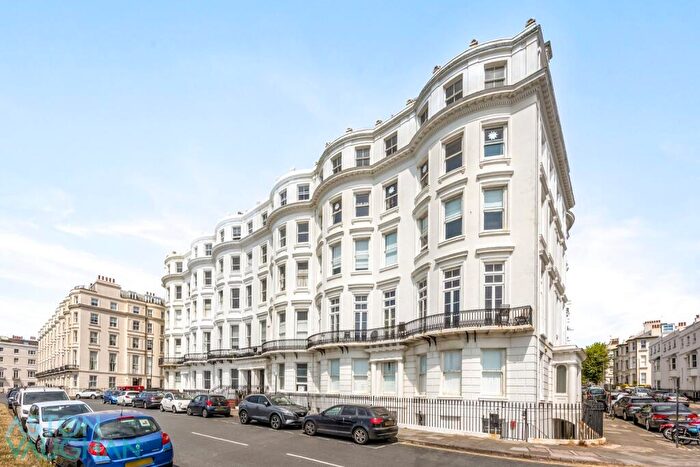
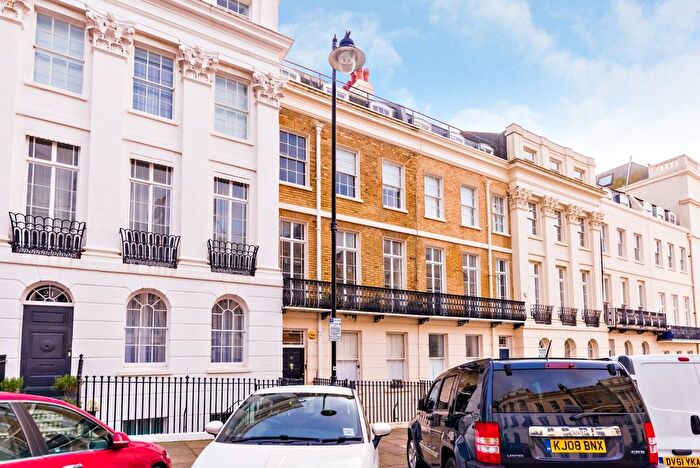
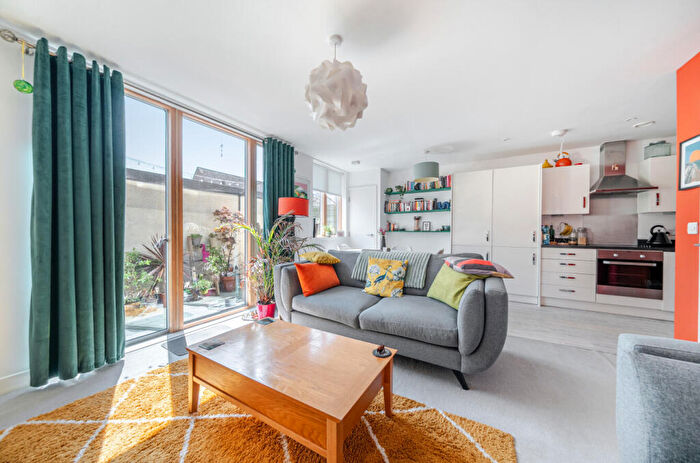
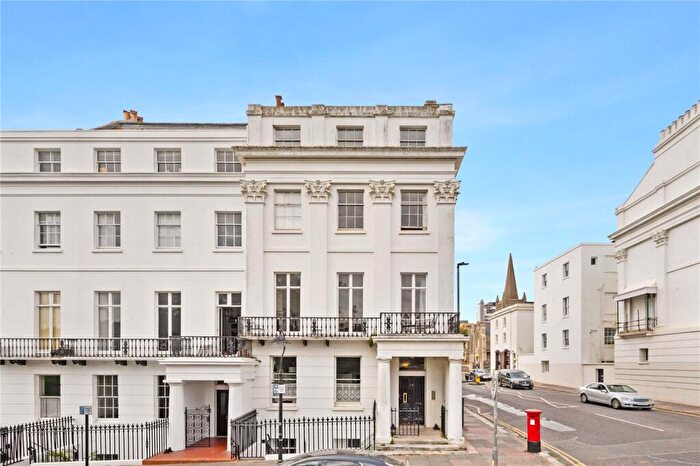
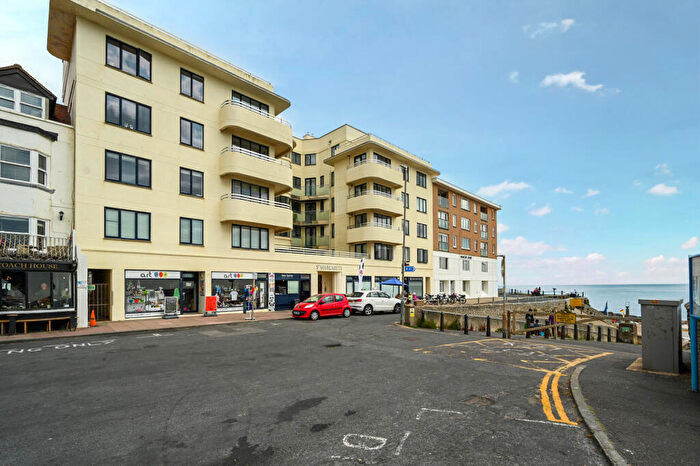
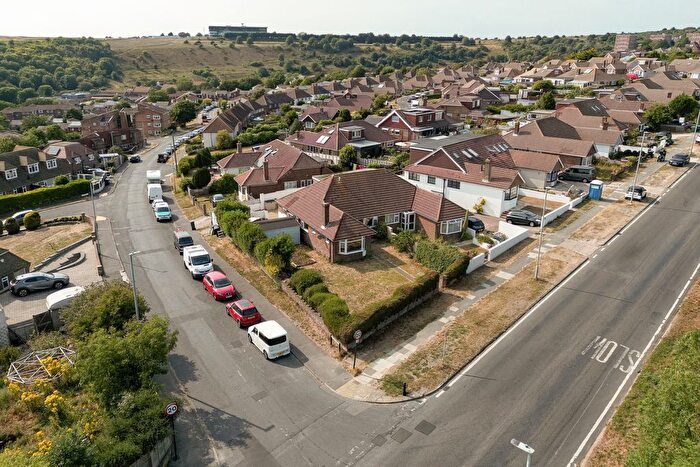
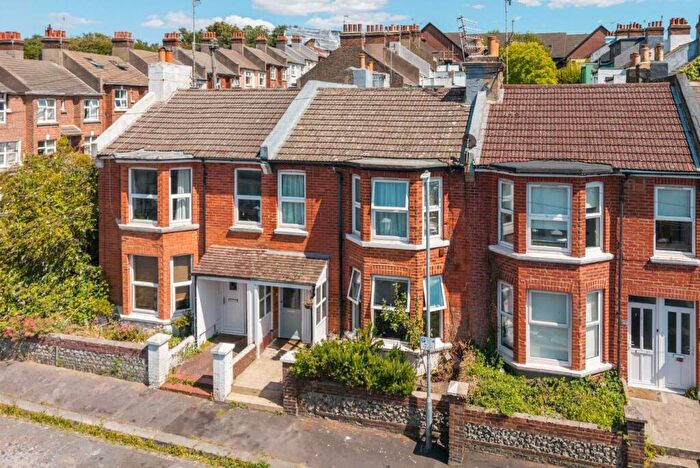
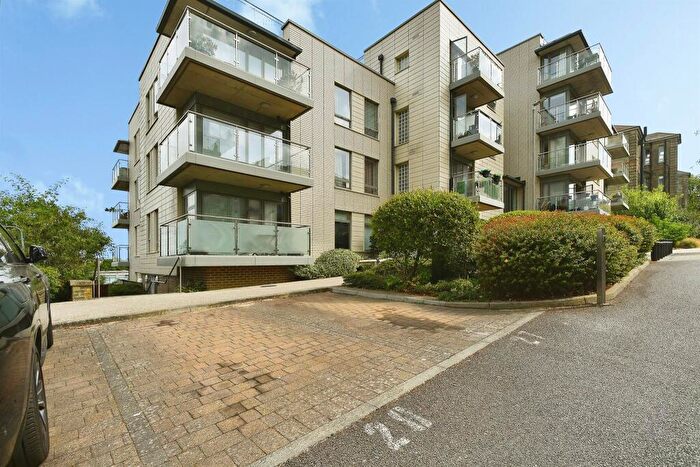
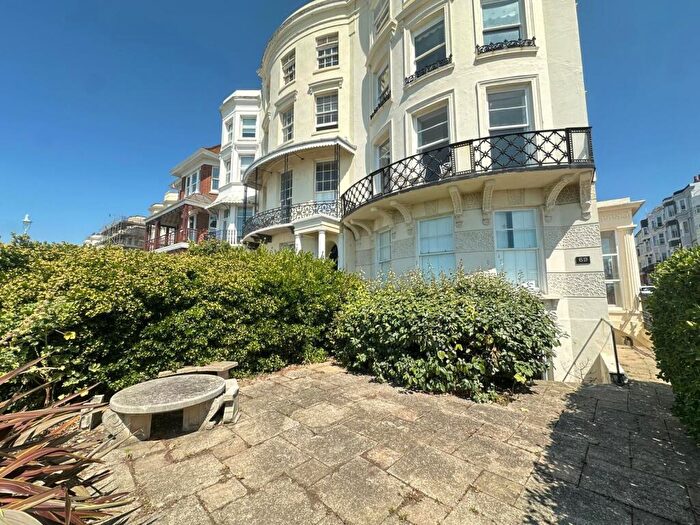
Houses and Flats for sale in BN2, Brighton, Bevendean, Brighton Marina, Kemptown
There are 744 results. Property prices in BN2 range from £22k to £4.5M with an average price of £520k.
![]()
If you are looking to sell your house, let it out, or receive a property valuation, an expert can help you.
Click the button below to get started.


Frequently Asked Questions about BN2
What is the average price for a property for sale in BN2?
The average price for a property for sale in BN2 is £443,842. There are 744 property listings for sale in BN2.
Which areas are included in the BN2 postcode district?
The main areas within BN2 include Brighton, Bevendean, Brighton Marina, Kemptown, Moulsecoomb, Ovingdean, Rottingdean, Saltdean and Woodingdean.
What are the most common property types in BN2?
The most common property types in BN2 are Terraced Houses, Flats, Detached Houses and Semi Detached Houses.
What has been the average sold property price in BN2 over the last three years?
Terraced Houses in BN2 have an average sold price of £493,769, while Flats have an average of £309,653. Detached Houses have an average of £624,151 and Semi Detached Houses have an average of £464,210. The average sold property price in BN2 over the last three years is approximately £435,547.
Which train stations are available in BN2?
The train stations available in BN2 are Berwick (Sussex) Station, Bishopstone Station, Eastbourne Station, Hampden Park Station, Moulsecoomb Station, Normans Bay Station, Pevensey and Westham Station, Pevensey Bay Station, Polegate Station and Seaford Station..