
Properties for sale in CO11
Manningtree
- Info
- Price Paid By Year
- Property Type Price
- Transport
House Prices in CO11
Properties in CO11 have an average house price of £367,626.00 and had 694 Property Transactions within the last 3 years.
The most expensive property was sold for £1,719,000.00.
Property Price Paid in CO11 by Year
The average sold property price by year was:
| Year | Average Sold Price | Sold Properties |
|---|---|---|
| 2026 | £339,833.00 | 15 Properties |
| 2025 | £370,802.00 | 217 Properties |
| 2024 | £354,777.00 | 254 Properties |
| 2023 | £382,008.00 | 208 Properties |
| 2022 | £365,065.00 | 274 Properties |
| 2021 | £328,631.00 | 402 Properties |
| 2020 | £325,502.00 | 317 Properties |
| 2019 | £332,045.00 | 243 Properties |
| 2018 | £325,064.00 | 290 Properties |
| 2017 | £311,289.00 | 300 Properties |
| 2016 | £280,561.00 | 282 Properties |
| 2015 | £251,553.00 | 238 Properties |
| 2014 | £224,164.00 | 250 Properties |
| 2013 | £215,418.00 | 226 Properties |
| 2012 | £207,882.00 | 185 Properties |
| 2011 | £217,343.00 | 210 Properties |
| 2010 | £218,633.00 | 210 Properties |
| 2009 | £188,493.00 | 192 Properties |
| 2008 | £230,145.00 | 153 Properties |
| 2007 | £212,572.00 | 301 Properties |
| 2006 | £209,540.00 | 349 Properties |
| 2005 | £183,075.00 | 289 Properties |
| 2004 | £181,333.00 | 264 Properties |
| 2003 | £159,139.00 | 246 Properties |
| 2002 | £139,292.00 | 349 Properties |
| 2001 | £102,687.00 | 299 Properties |
| 2000 | £95,898.00 | 321 Properties |
| 1999 | £81,725.00 | 357 Properties |
| 1998 | £75,186.00 | 324 Properties |
| 1997 | £64,629.00 | 316 Properties |
| 1996 | £62,226.00 | 288 Properties |
| 1995 | £56,632.00 | 271 Properties |
Property Price per Property Type in CO11
Here you can find historic sold price data in order to help with your property search.
The average Property Paid Price for specific property types in the last three years are:
| Property Type | Average Sold Price | Sold Properties |
|---|---|---|
| Semi Detached House | £318,316.00 | 244 Semi Detached Houses |
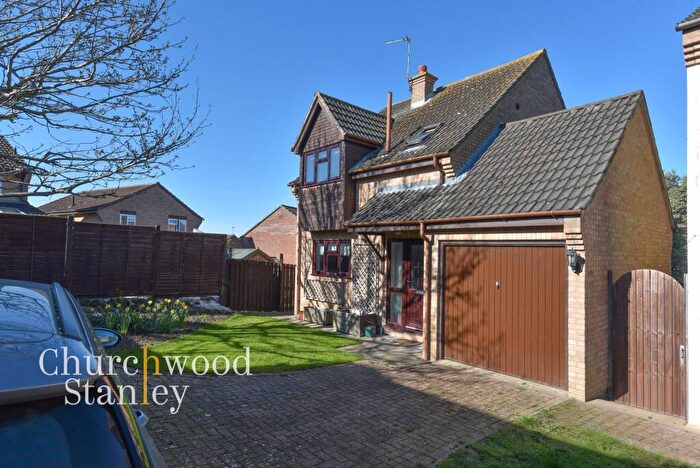
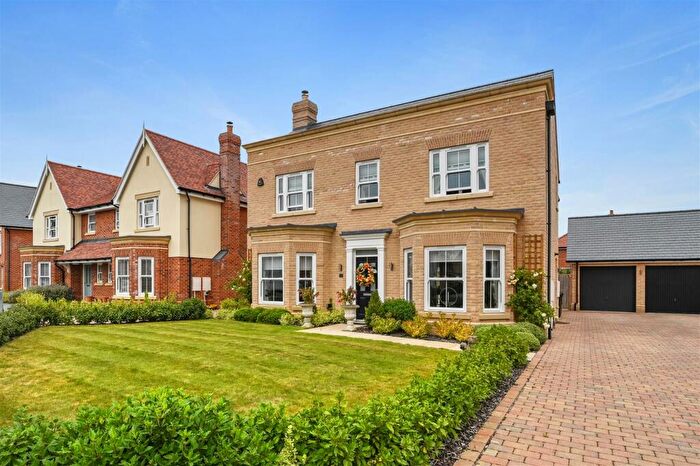
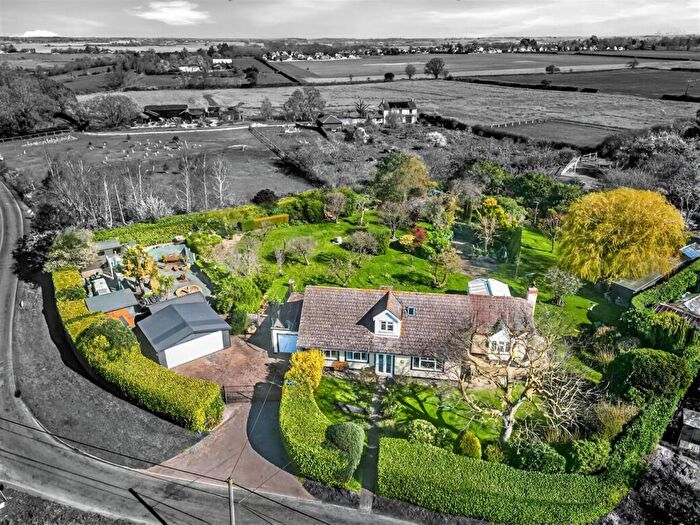
| Detached House | £491,912.00 | 268 Detached Houses |
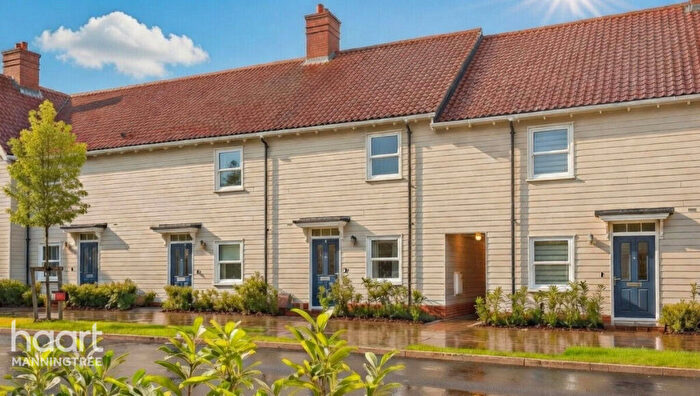
| Terraced House | £291,693.00 | 109 Terraced Houses |
| Flat | £189,540.00 | 73 Flats |
Transport near CO11

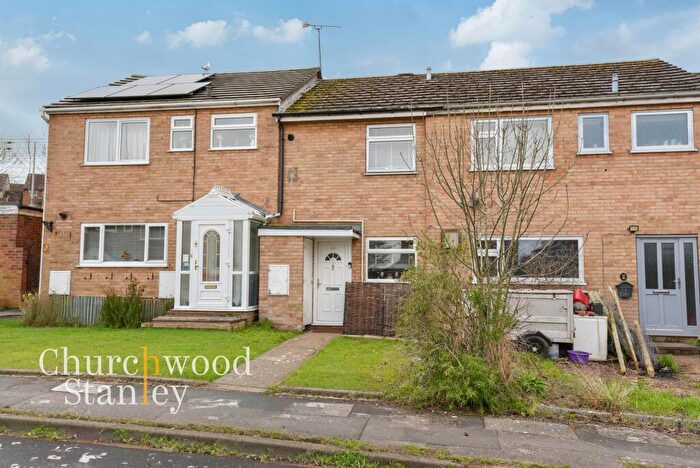
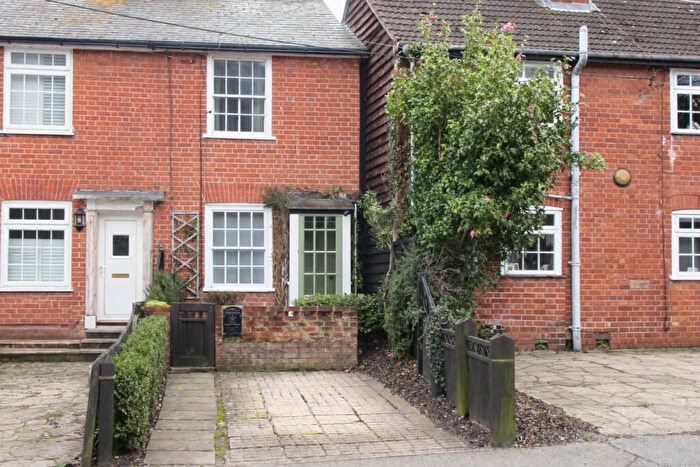
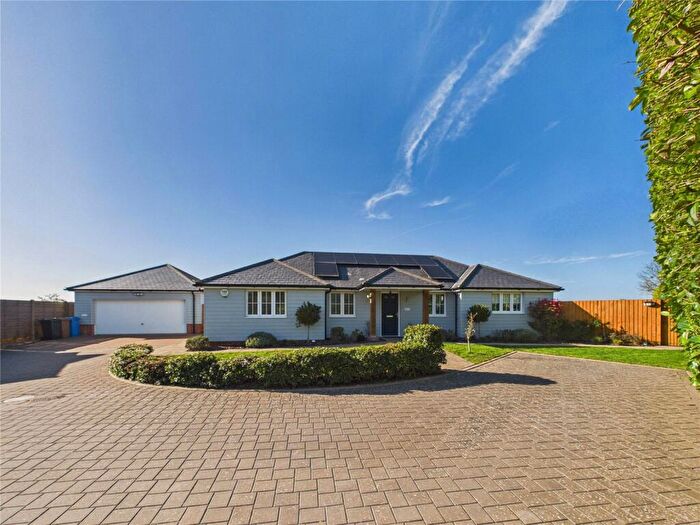
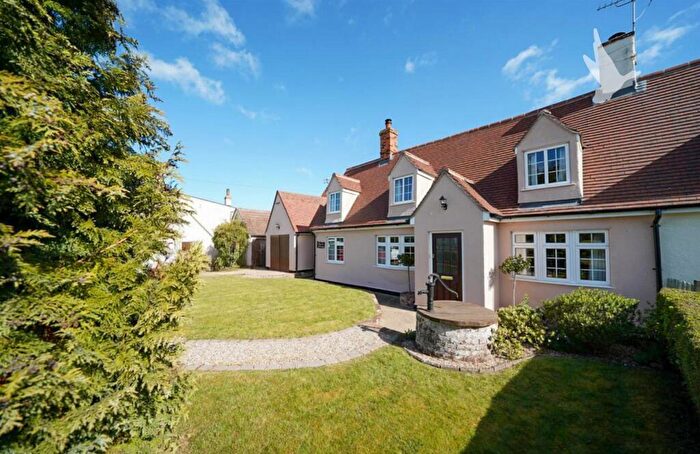
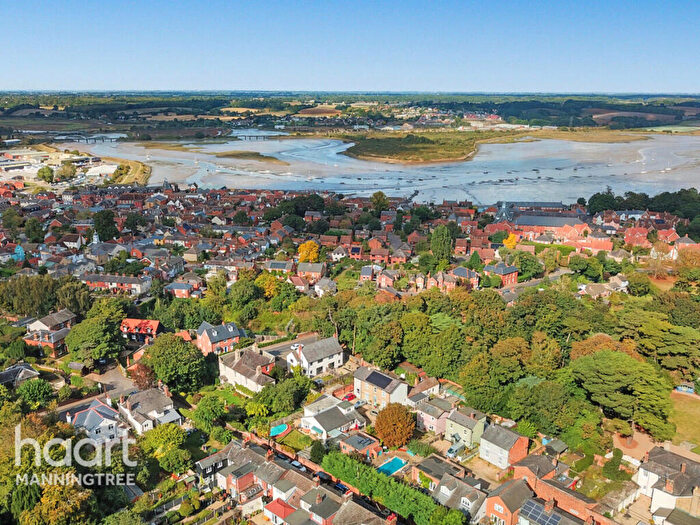
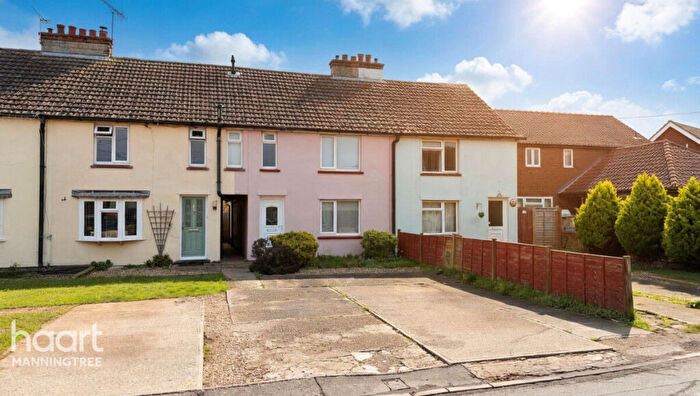
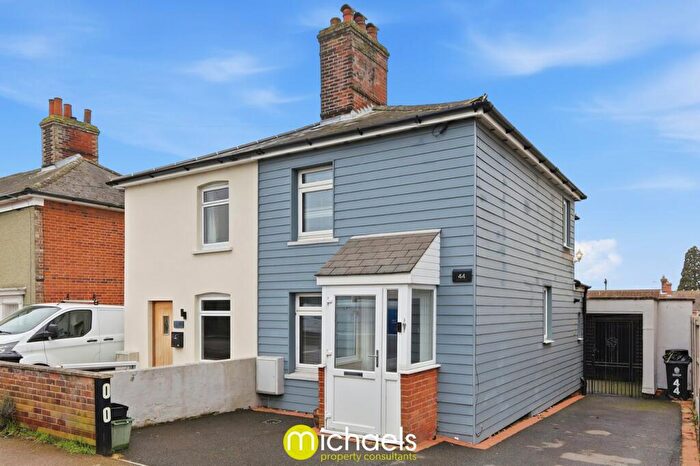
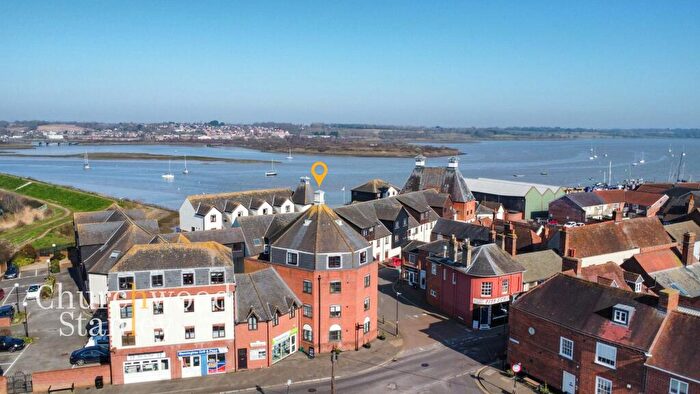
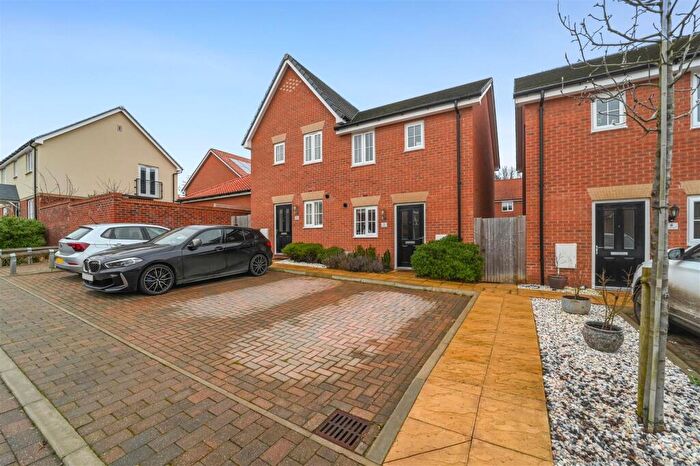
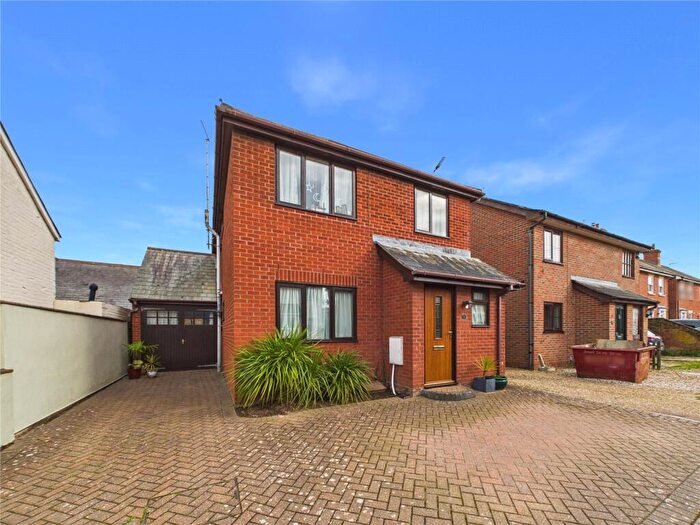
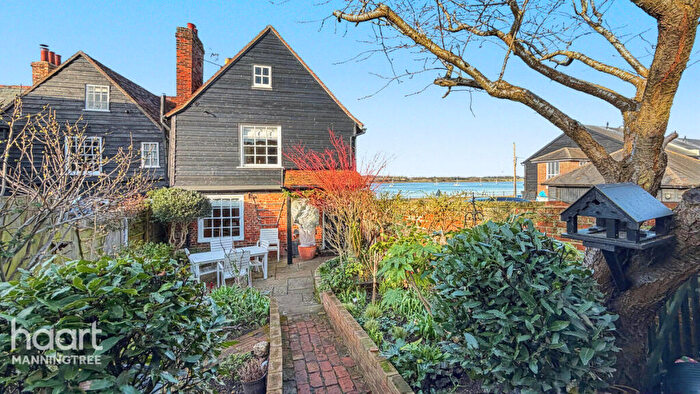
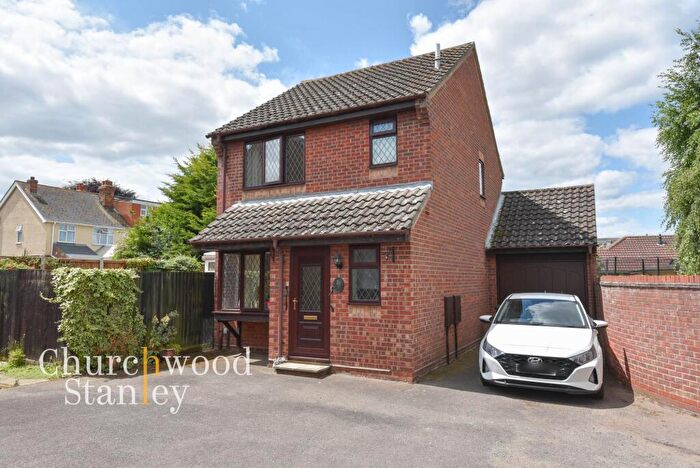
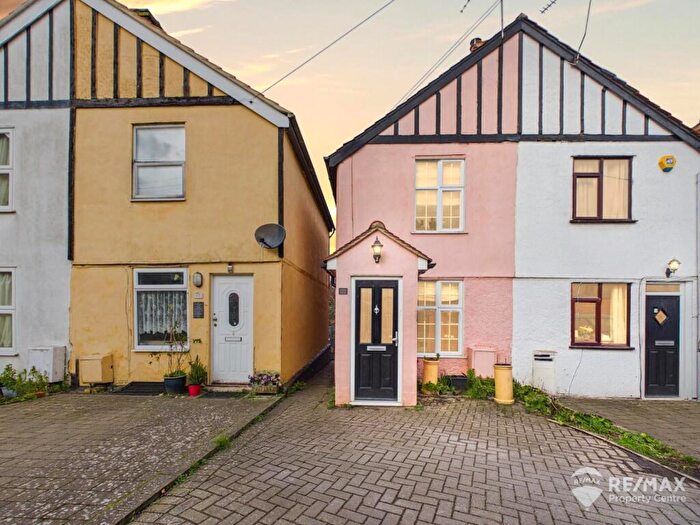
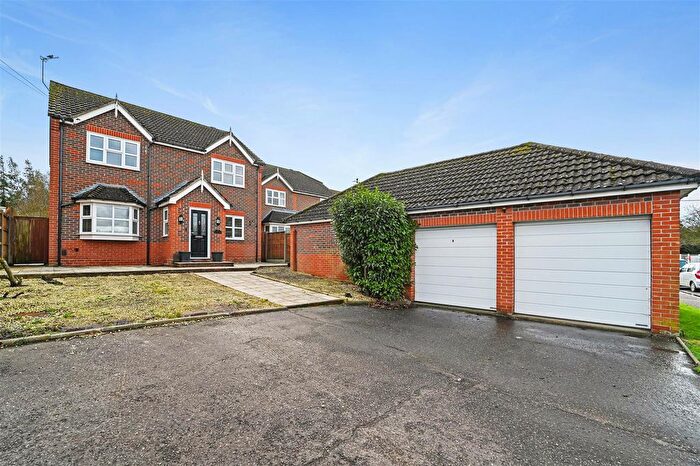
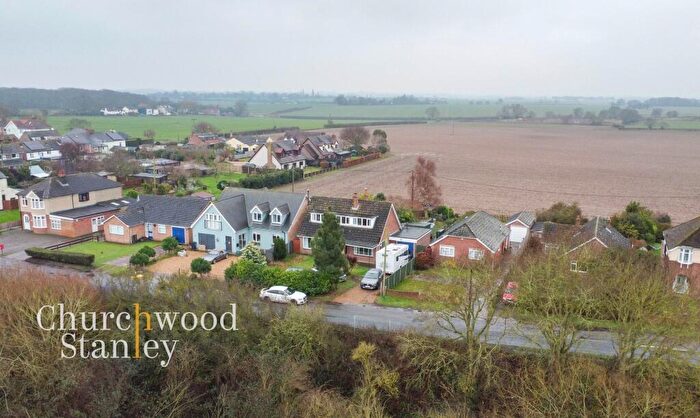
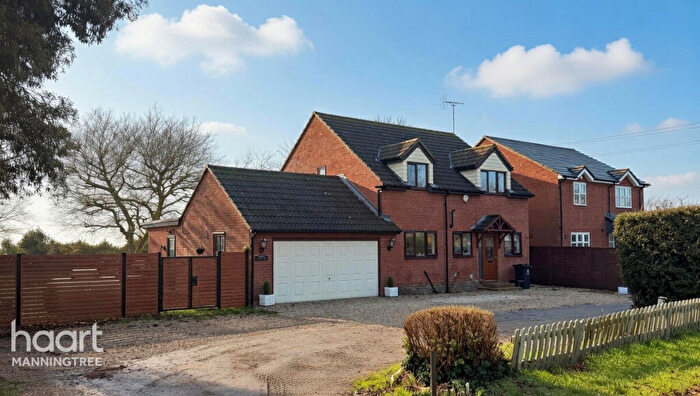
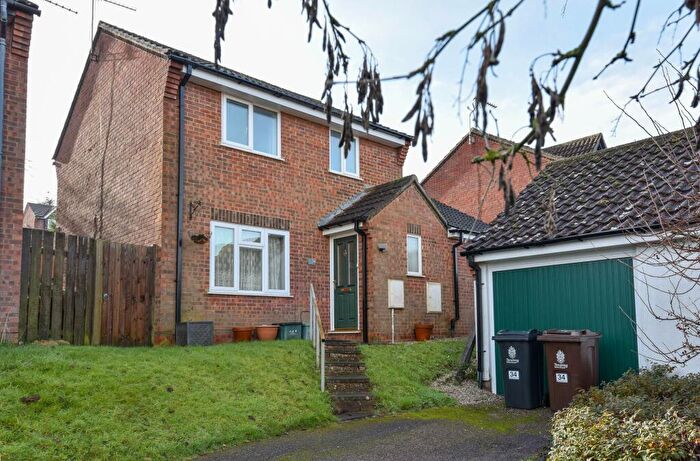
Houses and Flats for sale in CO11, Manningtree
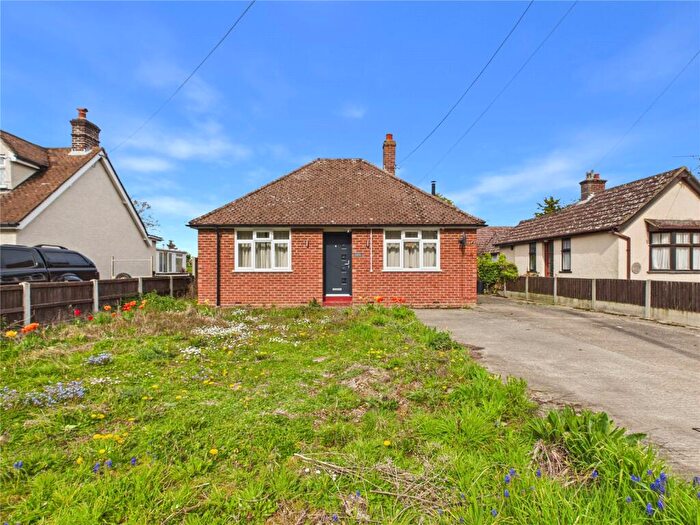
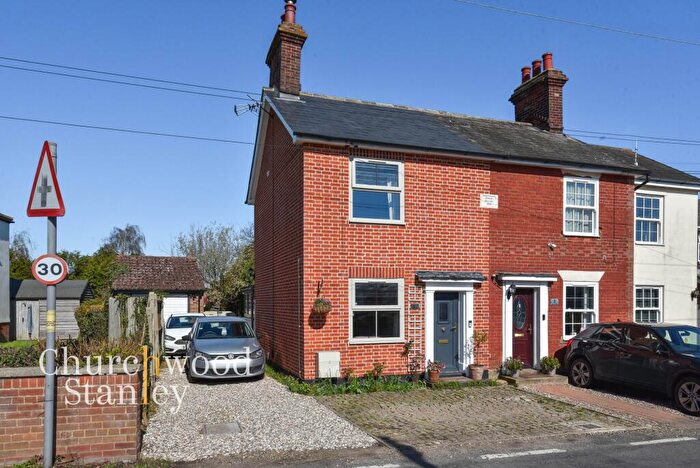
![]()
If you are looking to sell your house, let it out, or receive a property valuation, an expert can help you.
Click the button below to get started.
Frequently Asked Questions about CO11
What is the average price for a property for sale in CO11?
The average price for a property for sale in CO11 is £367,626. There are 125 property listings for sale in CO11.
Which areas are included in the CO11 postcode district?
The main area within CO11 is Manningtree.
What are the most common property types in CO11?
The most common property types in CO11 are Detached Houses, Semi Detached Houses, Terraced Houses and Flats.
What has been the average sold property price in CO11 over the last three years?
Detached Houses in CO11 have an average sold price of £491,912, while Semi Detached Houses have an average of £318,316. Terraced Houses have an average of £291,693 and Flats have an average of £189,540. The average sold property price in CO11 over the last three years is approximately £355,137.
Which train stations are available in CO11?
The train stations available in CO11 are Manningtree Station, Mistley Station and Wrabness Station..