
Properties for sale in DG11
Lockerbie
- Info
- Price Paid By Year
- Transport
House Prices in DG11
Properties in DG11 have an average house price of £166,237.00 and had 204 Property Transactions within the last 3 years.
The most expensive property was sold for £531,509.00.
Property Price Paid in DG11 by Year
The average sold property price by year was:
| Year | Average Sold Price | Sold Properties |
|---|---|---|
| 2025 | £181,517.00 | 63 Properties |
| 2024 | £147,702.00 | 65 Properties |
| 2023 | £169,424.00 | 76 Properties |
| 2022 | £195,724.00 | 172 Properties |
| 2021 | £184,962.00 | 217 Properties |
| 2020 | £151,504.00 | 153 Properties |
| 2019 | £156,682.00 | 207 Properties |
| 2018 | £153,609.00 | 203 Properties |
| 2017 | £145,777.00 | 191 Properties |
| 2016 | £147,187.00 | 195 Properties |
| 2015 | £156,680.00 | 171 Properties |
| 2014 | £144,000.00 | 135 Properties |
| 2013 | £150,875.00 | 169 Properties |
| 2012 | £157,740.00 | 163 Properties |
| 2011 | £139,744.00 | 149 Properties |
| 2010 | £169,589.00 | 121 Properties |
| 2009 | £149,669.00 | 131 Properties |
| 2008 | £168,887.00 | 172 Properties |
| 2007 | £148,104.00 | 224 Properties |
| 2006 | £136,827.00 | 207 Properties |
| 2005 | £137,231.00 | 196 Properties |
| 2004 | £113,771.00 | 249 Properties |
| 2003 | £76,556.00 | 228 Properties |
| 2002 | £66,872.00 | 275 Properties |
| 2001 | £52,482.00 | 23 Properties |
Transport near DG11

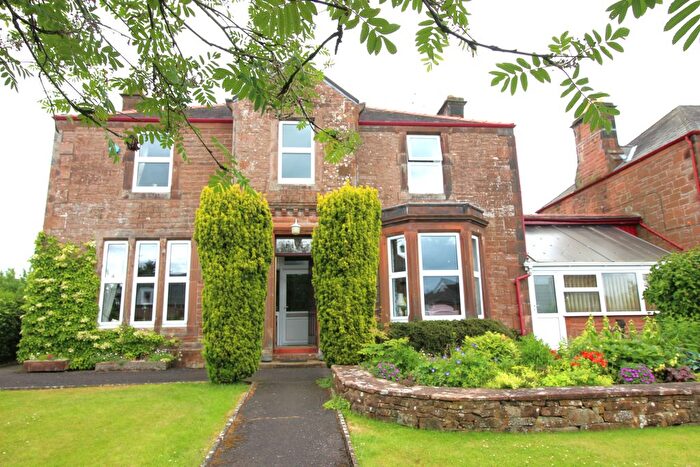
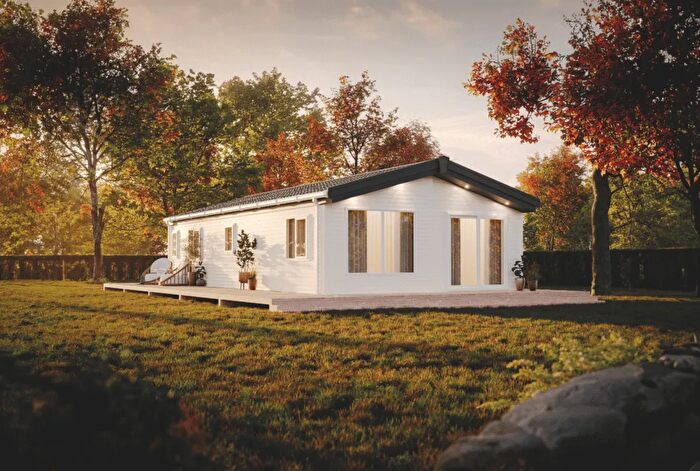
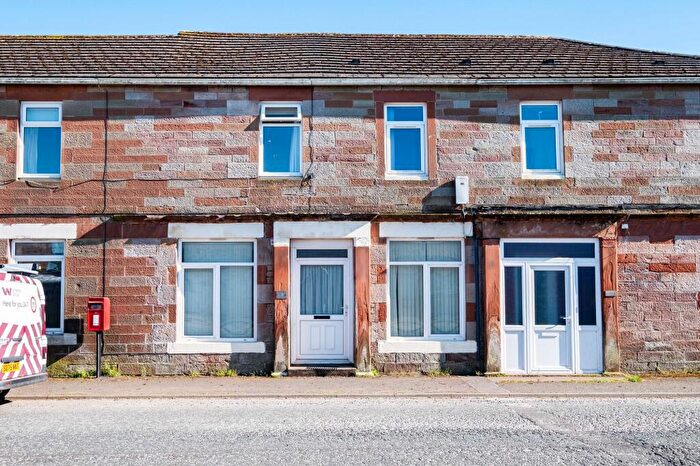
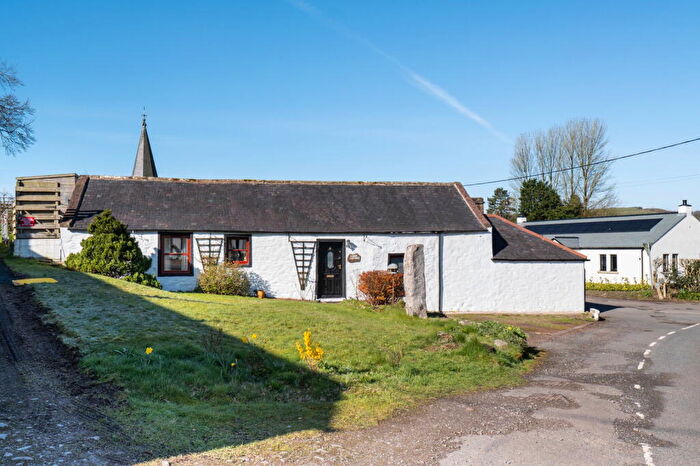
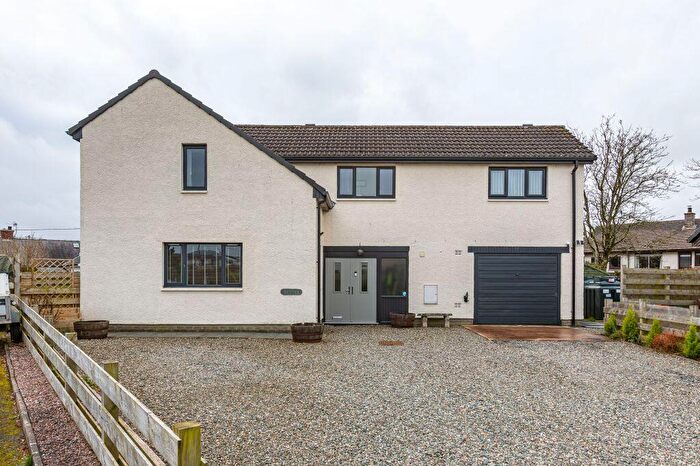
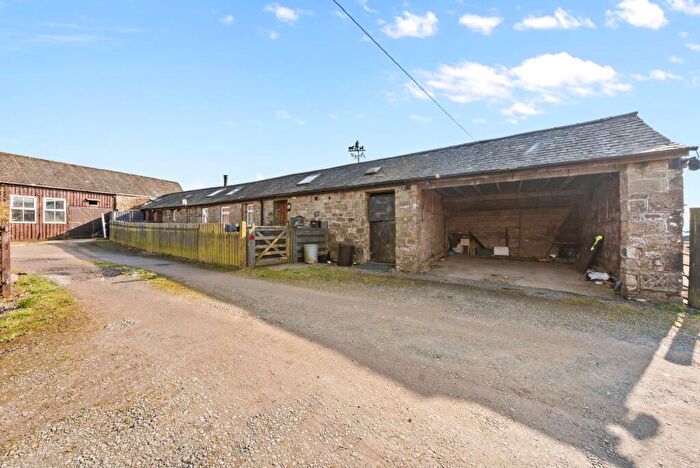
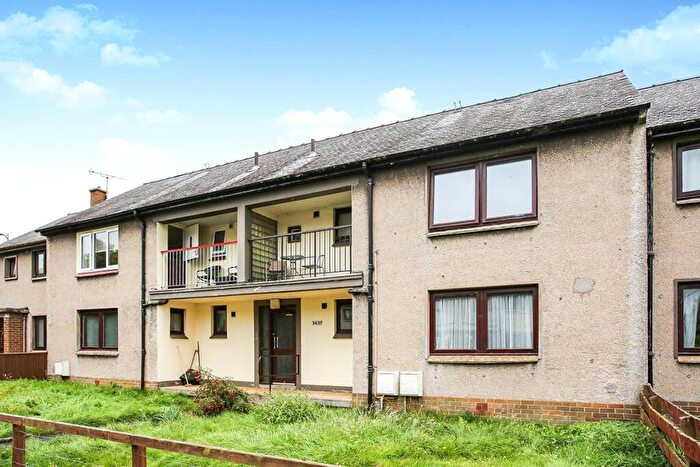
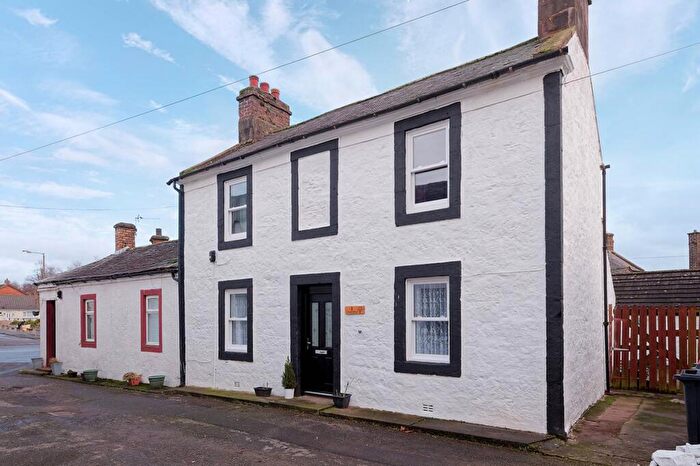
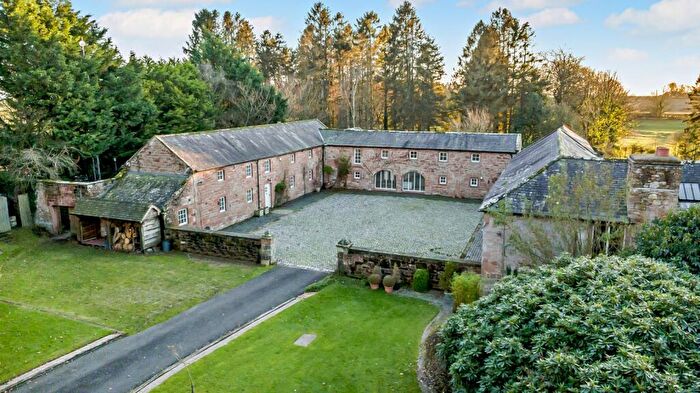
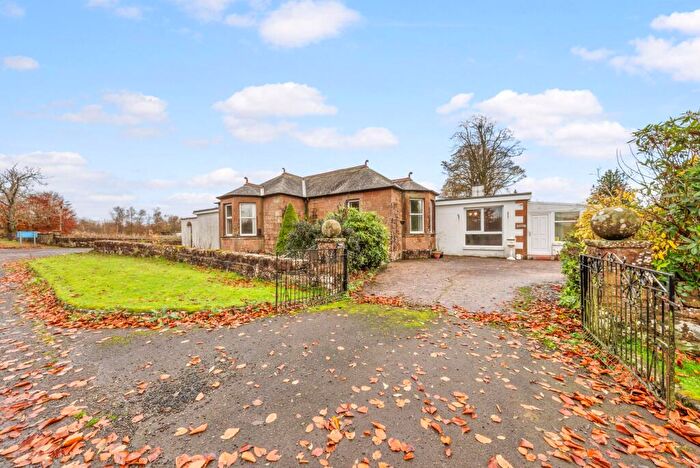
Houses and Flats for sale in DG11, Lockerbie
There are 157 results. Property prices in DG11 range from £36k to £850k with an average price of £245k.


![]()
If you are looking to sell your house, let it out, or receive a property valuation, an expert can help you.
Click the button below to get started.

Properties for sale near DG11
Frequently Asked Questions about DG11
What is the average price for a property for sale in DG11?
The average price for a property for sale in DG11 is £166,237. There are 23 property listings for sale in DG11.
Which areas are included in the DG11 postcode district?
The main area within DG11 is Lockerbie.
What are the most common property types in DG11?
The most common property types in DG11 are Unknowns.
What has been the average sold property price in DG11 over the last three years?
Unknowns in DG11 have an average sold price of £166,237. The average sold property price in DG11 over the last three years is approximately £166,214.
Which train stations are available in DG11?
The train station available in DG11 is Lockerbie Station..