
Properties for sale in GL2
Gloucester
- Info
- Price Paid By Year
- Property Type Price
- Transport
House Prices in GL2
Properties in GL2 have an average house price of £308,463.00 and had 2708 Property Transactions within the last 3 years.
The most expensive property was sold for £2,090,000.00.
Property Price Paid in GL2 by Year
The average sold property price by year was:
| Year | Average Sold Price | Sold Properties |
|---|---|---|
| 2026 | £337,892.00 | 54 Properties |
| 2025 | £309,392.00 | 916 Properties |
| 2024 | £306,644.00 | 929 Properties |
| 2023 | £307,537.00 | 809 Properties |
| 2022 | £307,595.00 | 996 Properties |
| 2021 | £279,642.00 | 1,293 Properties |
| 2020 | £272,941.00 | 1,123 Properties |
| 2019 | £254,471.00 | 1,199 Properties |
| 2018 | £249,410.00 | 1,327 Properties |
| 2017 | £239,239.00 | 1,360 Properties |
| 2016 | £225,416.00 | 1,347 Properties |
| 2015 | £211,722.00 | 1,372 Properties |
| 2014 | £196,041.00 | 1,321 Properties |
| 2013 | £186,441.00 | 1,095 Properties |
| 2012 | £183,633.00 | 864 Properties |
| 2011 | £182,150.00 | 779 Properties |
| 2010 | £180,545.00 | 892 Properties |
| 2009 | £169,649.00 | 838 Properties |
| 2008 | £181,275.00 | 702 Properties |
| 2007 | £203,900.00 | 1,360 Properties |
| 2006 | £181,838.00 | 1,711 Properties |
| 2005 | £170,499.00 | 1,014 Properties |
| 2004 | £166,560.00 | 1,207 Properties |
| 2003 | £148,686.00 | 1,258 Properties |
| 2002 | £126,749.00 | 1,501 Properties |
| 2001 | £106,903.00 | 1,375 Properties |
| 2000 | £87,187.00 | 1,185 Properties |
| 1999 | £78,786.00 | 1,474 Properties |
| 1998 | £72,876.00 | 1,347 Properties |
| 1997 | £67,645.00 | 1,349 Properties |
| 1996 | £61,236.00 | 1,057 Properties |
| 1995 | £61,289.00 | 759 Properties |
Property Price per Property Type in GL2
Here you can find historic sold price data in order to help with your property search.
The average Property Paid Price for specific property types in the last three years are:
| Property Type | Average Sold Price | Sold Properties |
|---|---|---|
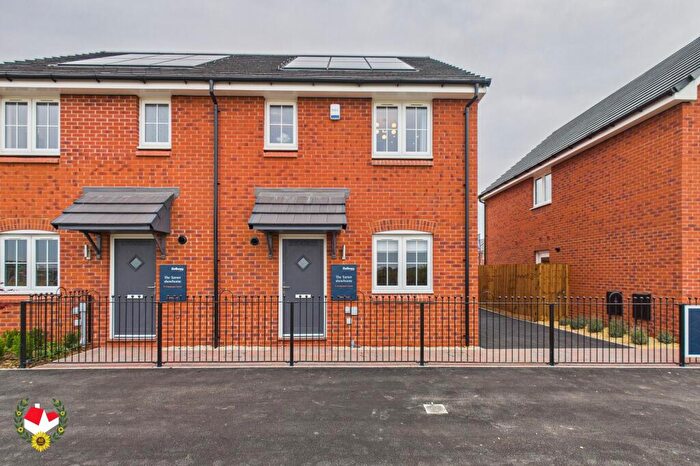
| Semi Detached House | £295,303.00 | 886 Semi Detached Houses |
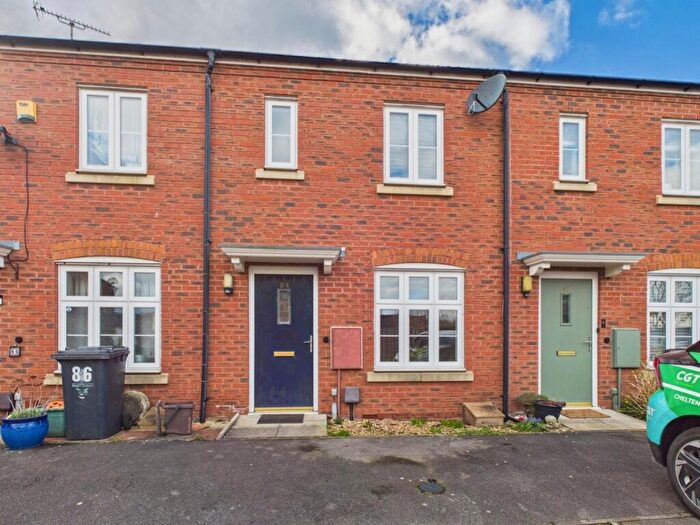
| Terraced House | £230,916.00 | 811 Terraced Houses |
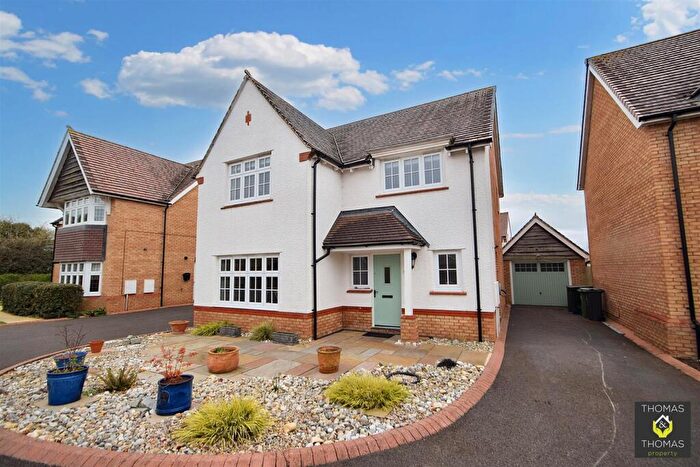
| Detached House | £450,225.00 | 788 Detached Houses |
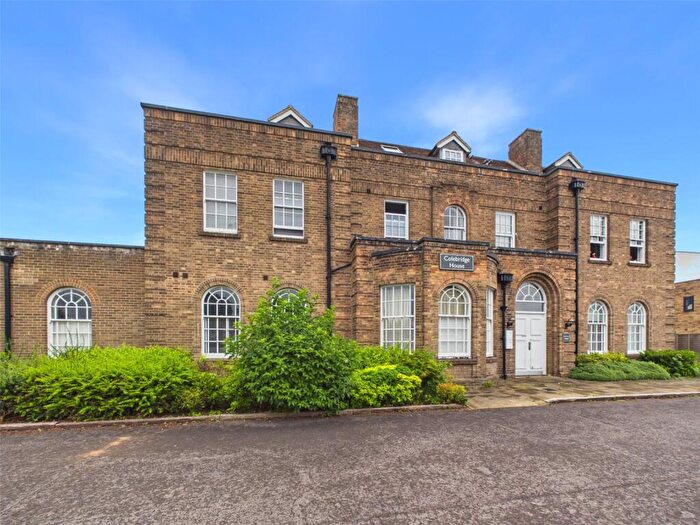
| Flat | £141,837.00 | 223 Flats |

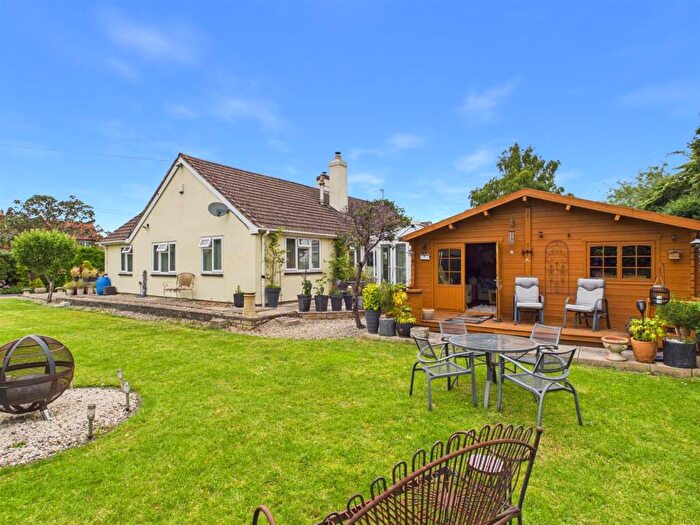
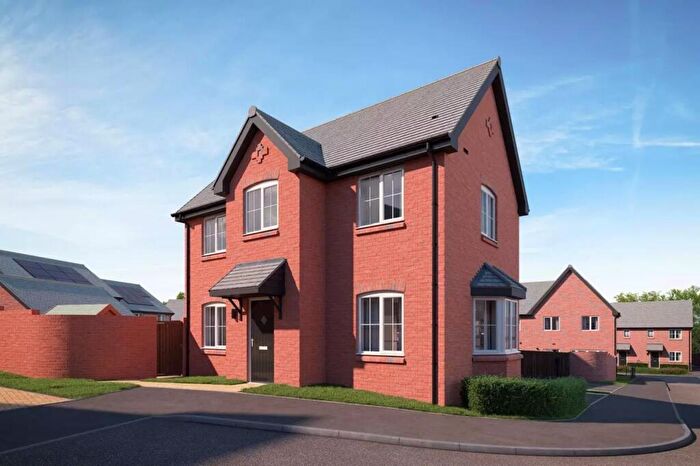
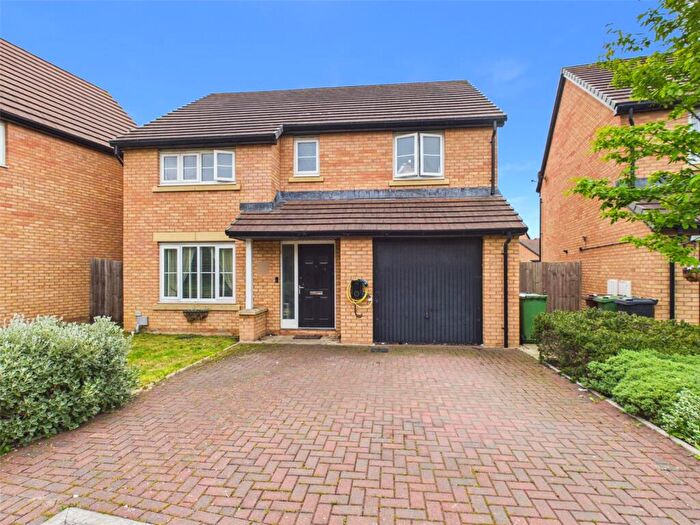
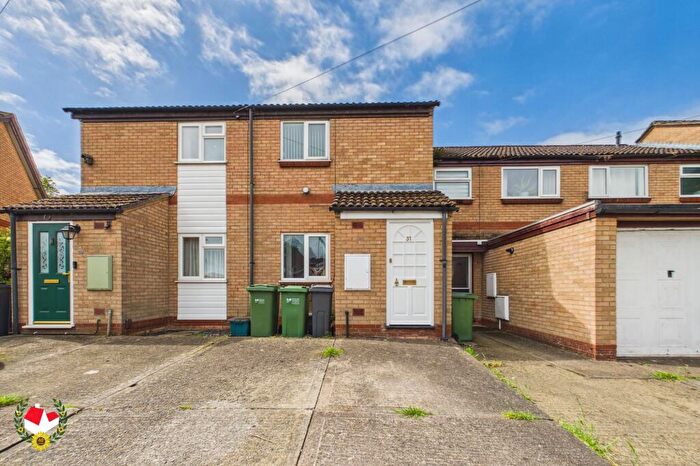
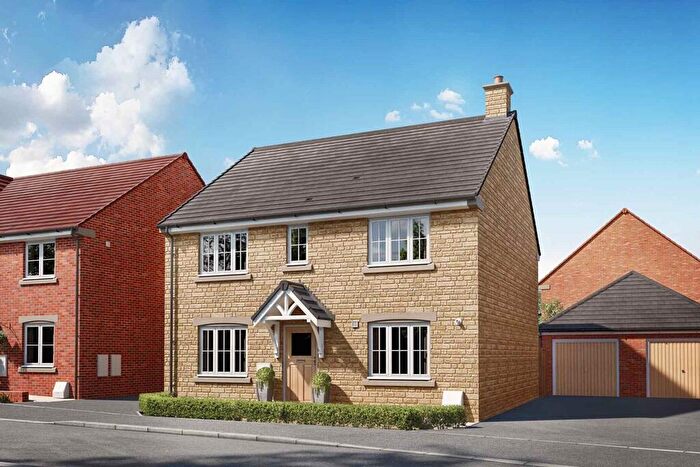
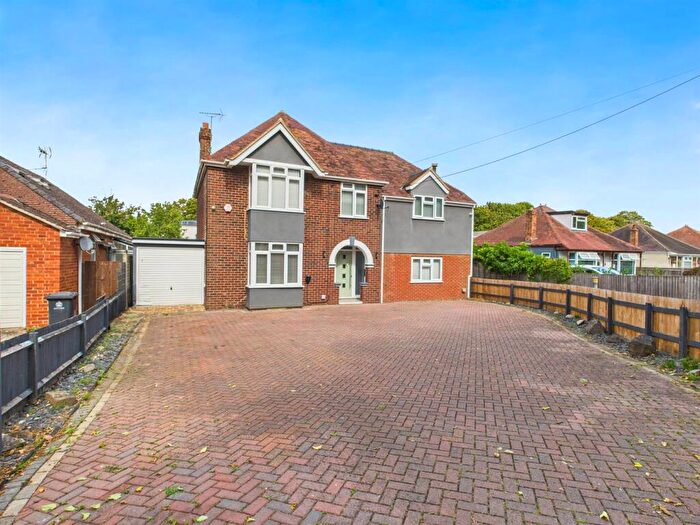
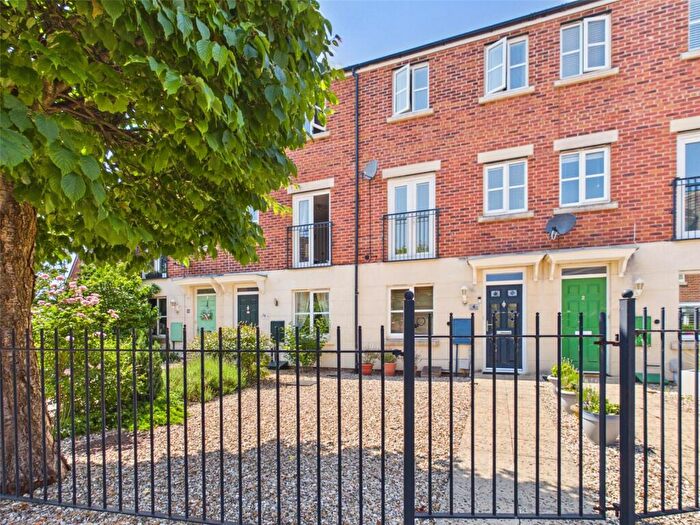
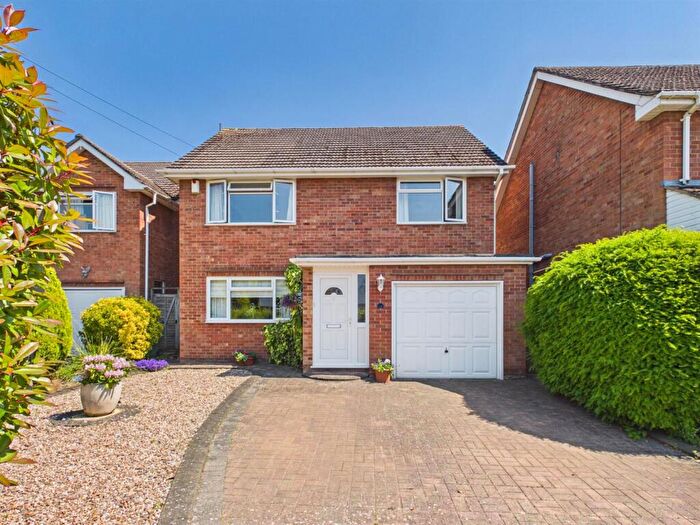
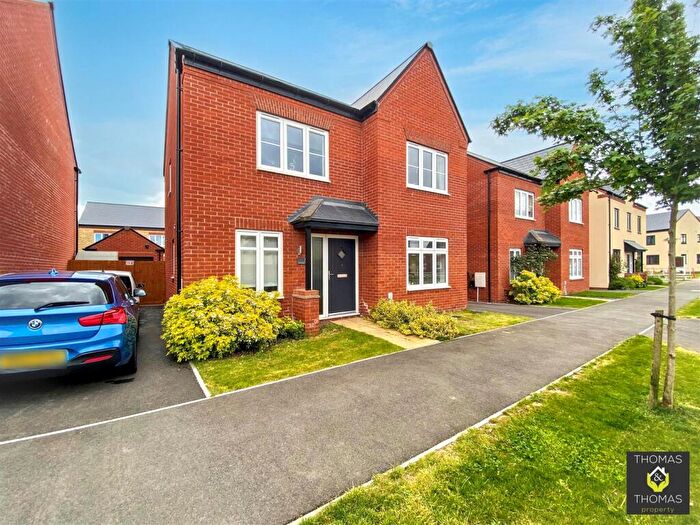
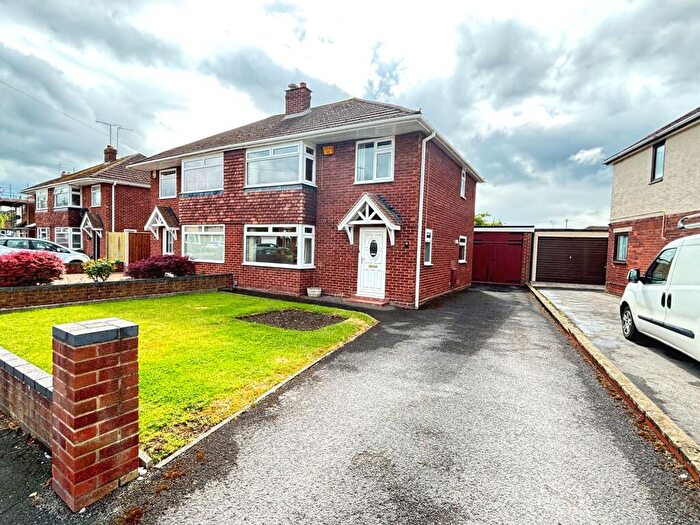
Houses and Flats for sale in GL2, Gloucester
There are 237 results. Property prices in GL2 range from £45k to £1.25M with an average price of £391k.
![]()
If you are looking to sell your house, let it out, or receive a property valuation, an expert can help you.
Click the button below to get started.

Frequently Asked Questions about GL2
What is the average price for a property for sale in GL2?
The average price for a property for sale in GL2 is £308,463. There are 237 property listings for sale in GL2.
Which areas are included in the GL2 postcode district?
The main area within GL2 is Gloucester.
What are the most common property types in GL2?
The most common property types in GL2 are Semi Detached Houses, Terraced Houses, Detached Houses and Flats.
What has been the average sold property price in GL2 over the last three years?
Semi Detached Houses in GL2 have an average sold price of £295,303, while Terraced Houses have an average of £230,916. Detached Houses have an average of £450,225 and Flats have an average of £141,837. The average sold property price in GL2 over the last three years is approximately £317,976.
Which train stations are available in GL2?
The train station available in GL2 is Ashchurch Station..