
Properties for sale in GL53
Cheltenham
- Info
- Price Paid By Year
- Property Type Price
- Transport
House Prices in GL53
Properties in GL53 have an average house price of £584,474.00 and had 976 Property Transactions within the last 3 years.
The most expensive property was sold for £3,850,000.00.
Property Price Paid in GL53 by Year
The average sold property price by year was:
| Year | Average Sold Price | Sold Properties |
|---|---|---|
| 2026 | £591,000.00 | 7 Properties |
| 2025 | £551,345.00 | 310 Properties |
| 2024 | £597,926.00 | 350 Properties |
| 2023 | £602,325.00 | 309 Properties |
| 2022 | £574,627.00 | 399 Properties |
| 2021 | £507,027.00 | 504 Properties |
| 2020 | £514,465.00 | 404 Properties |
| 2019 | £452,137.00 | 382 Properties |
| 2018 | £467,425.00 | 427 Properties |
| 2017 | £446,039.00 | 445 Properties |
| 2016 | £426,711.00 | 461 Properties |
| 2015 | £380,437.00 | 461 Properties |
| 2014 | £363,972.00 | 481 Properties |
| 2013 | £343,186.00 | 380 Properties |
| 2012 | £329,509.00 | 331 Properties |
| 2011 | £333,649.00 | 320 Properties |
| 2010 | £328,000.00 | 343 Properties |
| 2009 | £282,543.00 | 320 Properties |
| 2008 | £294,519.00 | 271 Properties |
| 2007 | £308,324.00 | 459 Properties |
| 2006 | £294,752.00 | 578 Properties |
| 2005 | £261,564.00 | 420 Properties |
| 2004 | £253,622.00 | 447 Properties |
| 2003 | £219,733.00 | 426 Properties |
| 2002 | £191,265.00 | 437 Properties |
| 2001 | £163,366.00 | 516 Properties |
| 2000 | £147,666.00 | 438 Properties |
| 1999 | £128,997.00 | 550 Properties |
| 1998 | £111,603.00 | 466 Properties |
| 1997 | £96,219.00 | 476 Properties |
| 1996 | £92,032.00 | 418 Properties |
| 1995 | £85,406.00 | 369 Properties |
Property Price per Property Type in GL53
Here you can find historic sold price data in order to help with your property search.
The average Property Paid Price for specific property types in the last three years are:
| Property Type | Average Sold Price | Sold Properties |
|---|---|---|
| Semi Detached House | £573,024.00 | 303 Semi Detached Houses |
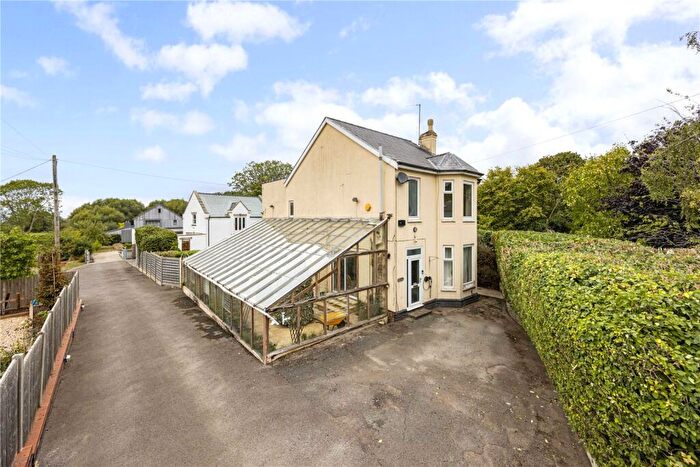
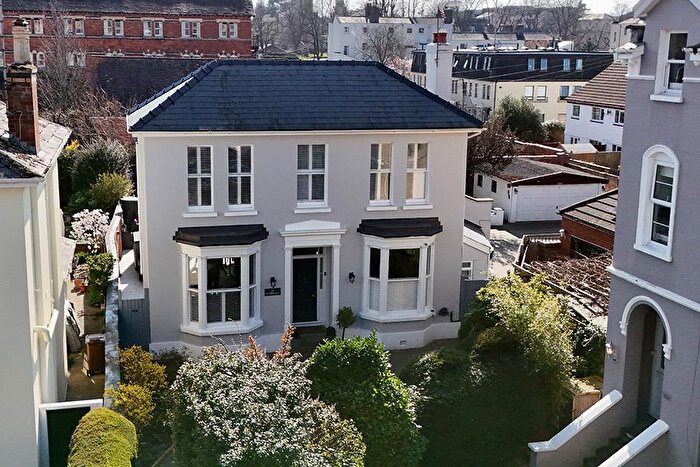
| Detached House | £891,681.00 | 296 Detached Houses |
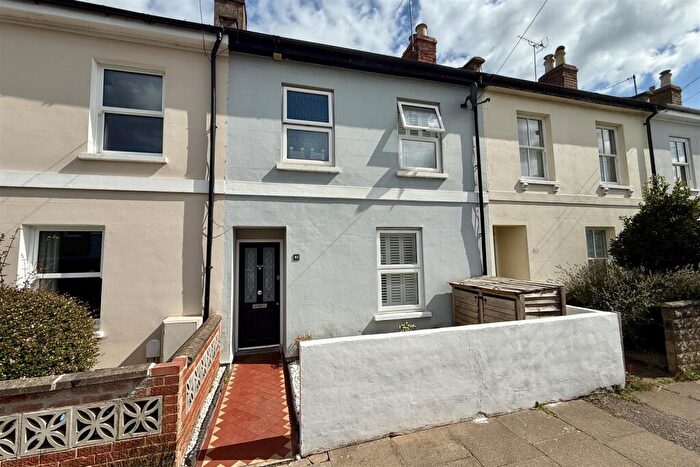
| Terraced House | £423,681.00 | 227 Terraced Houses |
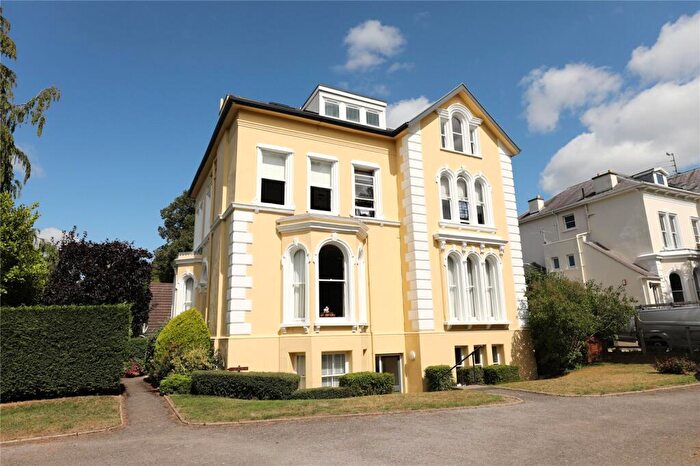
| Flat | £244,712.00 | 150 Flats |
Transport near GL53

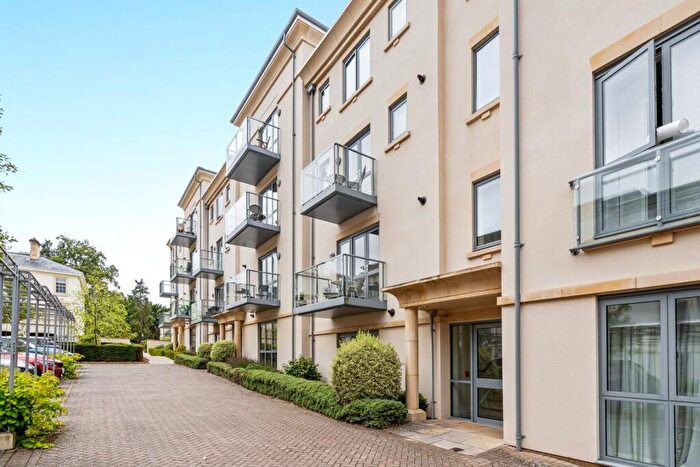
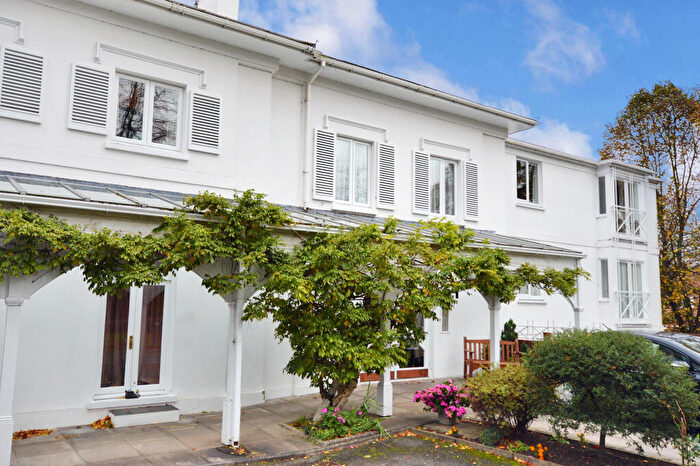
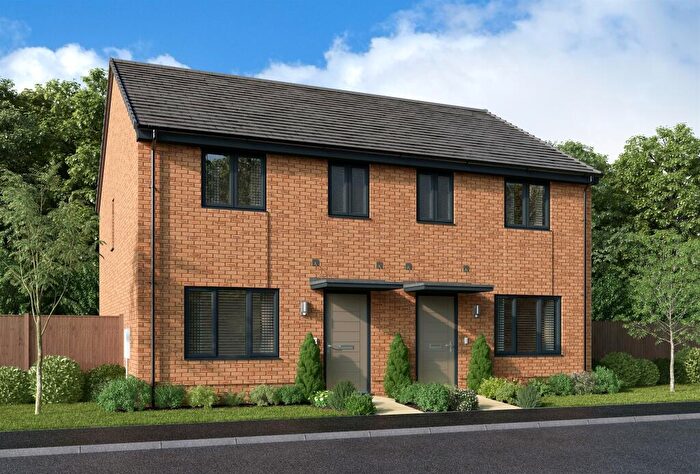
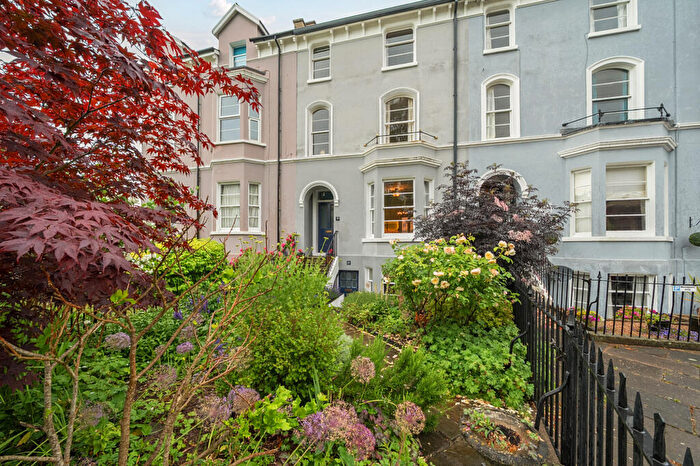
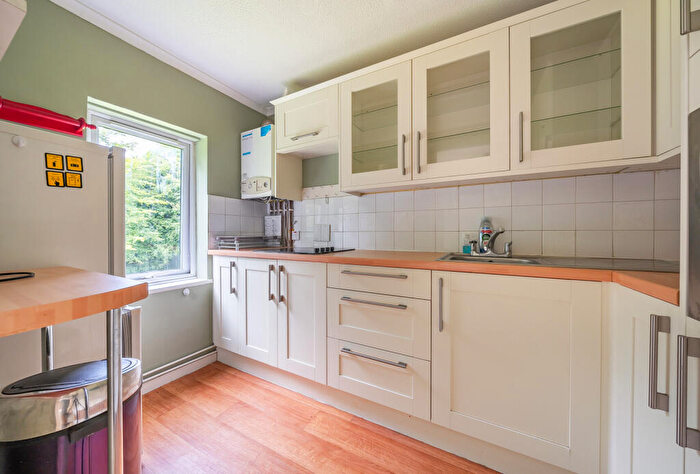
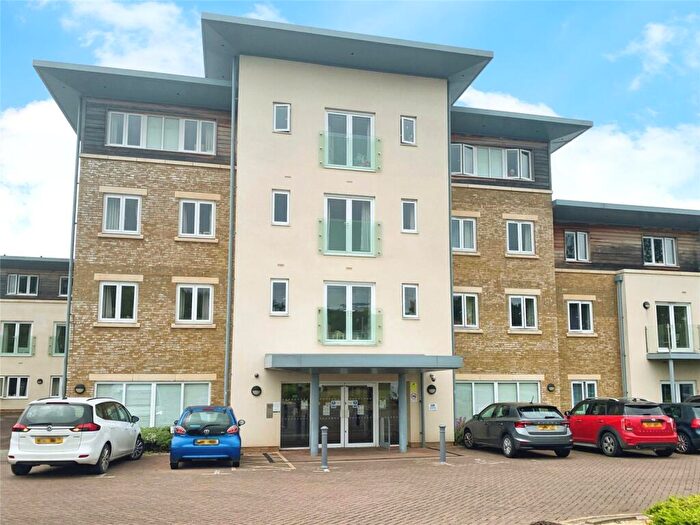
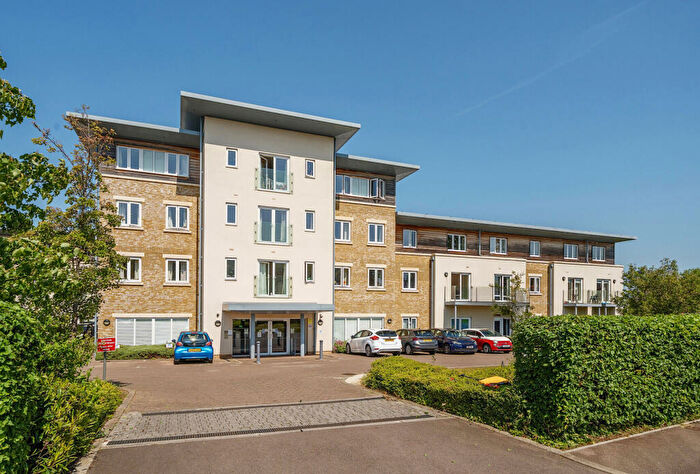
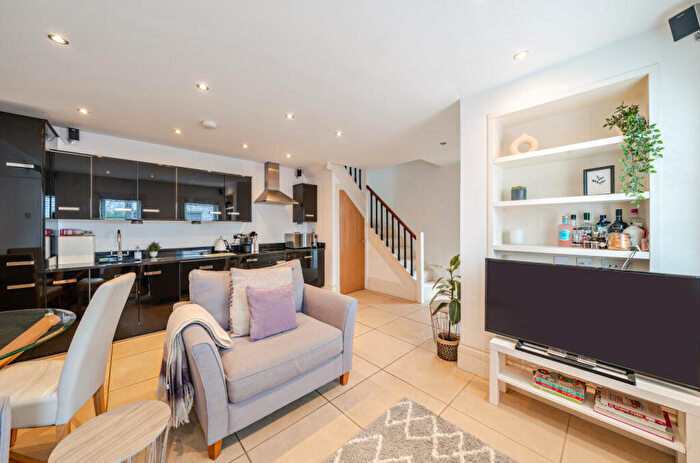
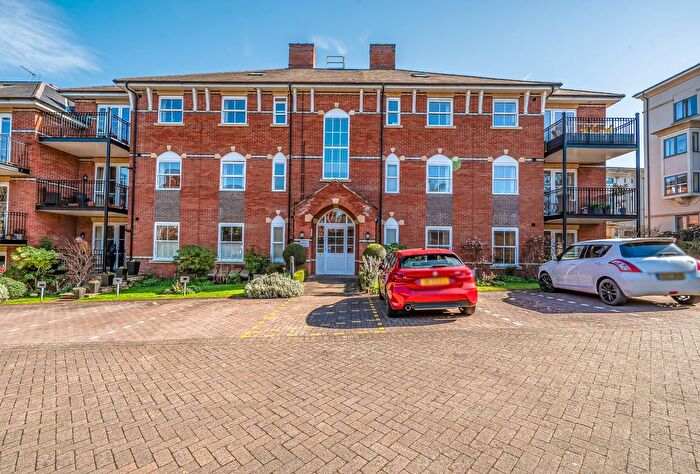
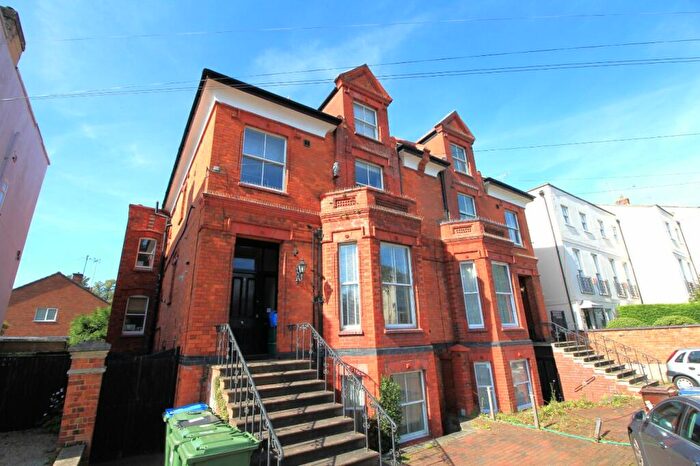
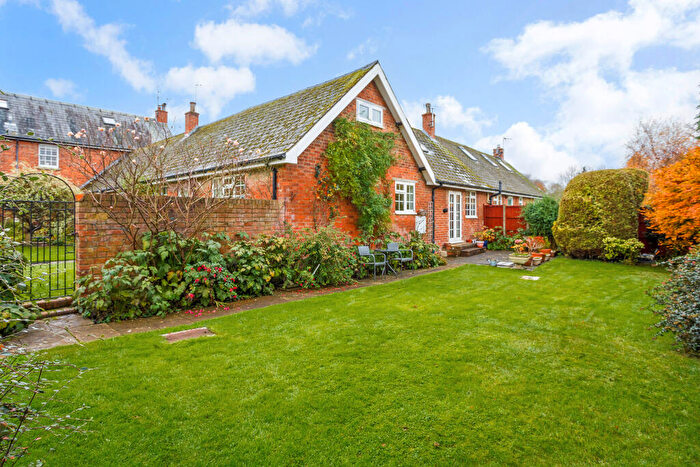
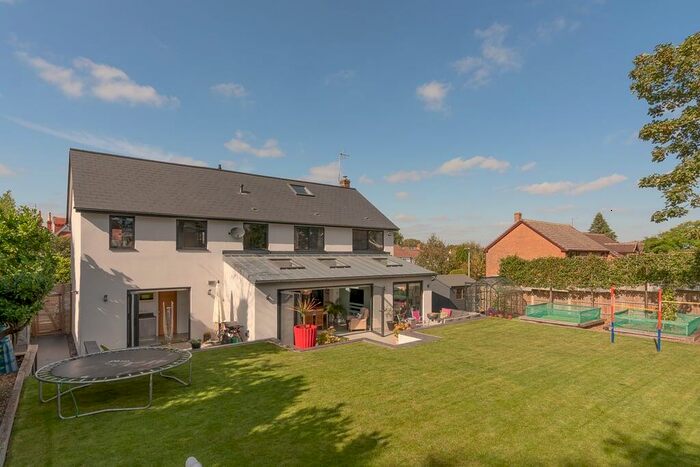
Houses and Flats for sale in GL53, Cheltenham
![]()
If you are looking to sell your house, let it out, or receive a property valuation, an expert can help you.
Click the button below to get started.

Frequently Asked Questions about GL53
What is the average price for a property for sale in GL53?
The average price for a property for sale in GL53 is £584,474. There are 163 property listings for sale in GL53.
Which areas are included in the GL53 postcode district?
The main area within GL53 is Cheltenham.
What are the most common property types in GL53?
The most common property types in GL53 are Semi Detached Houses, Detached Houses, Terraced Houses and Flats.
What has been the average sold property price in GL53 over the last three years?
Semi Detached Houses in GL53 have an average sold price of £573,024, while Detached Houses have an average of £891,681. Terraced Houses have an average of £423,681 and Flats have an average of £244,712. The average sold property price in GL53 over the last three years is approximately £580,090.