
Properties for sale in HP11
Wycombe Marsh
- Info
- Price Paid By Year
- Property Type Price
- Transport
House Prices in HP11
Properties in HP11 have an average house price of £387,173.00 and had 586 Property Transactions within the last 3 years.
The most expensive property was sold for £1,680,000.00.
Property Price Paid in HP11 by Year
The average sold property price by year was:
| Year | Average Sold Price | Sold Properties |
|---|---|---|
| 2025 | £407,709.00 | 198 Properties |
| 2024 | £390,768.00 | 222 Properties |
| 2023 | £357,872.00 | 166 Properties |
| 2022 | £390,459.00 | 268 Properties |
| 2021 | £381,649.00 | 401 Properties |
| 2020 | £374,584.00 | 257 Properties |
| 2019 | £355,635.00 | 312 Properties |
| 2018 | £352,569.00 | 298 Properties |
| 2017 | £370,905.00 | 418 Properties |
| 2016 | £358,909.00 | 450 Properties |
| 2015 | £281,553.00 | 320 Properties |
| 2014 | £268,364.00 | 285 Properties |
| 2013 | £260,683.00 | 259 Properties |
| 2012 | £243,853.00 | 202 Properties |
| 2011 | £238,141.00 | 262 Properties |
| 2010 | £266,896.00 | 150 Properties |
| 2009 | £205,593.00 | 133 Properties |
| 2008 | £230,705.00 | 140 Properties |
| 2007 | £227,420.00 | 346 Properties |
| 2006 | £221,490.00 | 387 Properties |
| 2005 | £210,541.00 | 200 Properties |
| 2004 | £201,752.00 | 336 Properties |
| 2003 | £194,161.00 | 295 Properties |
| 2002 | £166,093.00 | 342 Properties |
| 2001 | £138,919.00 | 319 Properties |
| 2000 | £132,763.00 | 293 Properties |
| 1999 | £101,329.00 | 390 Properties |
| 1998 | £85,224.00 | 298 Properties |
| 1997 | £79,282.00 | 344 Properties |
| 1996 | £77,462.00 | 280 Properties |
| 1995 | £76,917.00 | 241 Properties |
Property Price per Property Type in HP11
Here you can find historic sold price data in order to help with your property search.
The average Property Paid Price for specific property types in the last three years are:
| Property Type | Average Sold Price | Sold Properties |
|---|---|---|
| Semi Detached House | £476,790.00 | 123 Semi Detached Houses |
| Detached House | £717,479.00 | 99 Detached Houses |
| Terraced House | £373,523.00 | 101 Terraced Houses |
| Flat | £226,168.00 | 263 Flats |

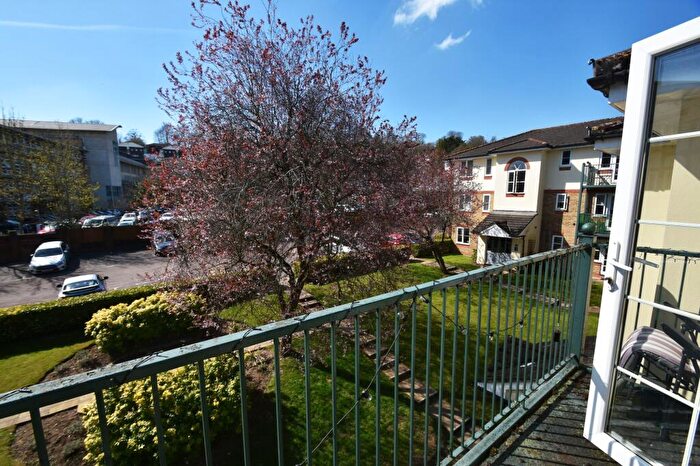
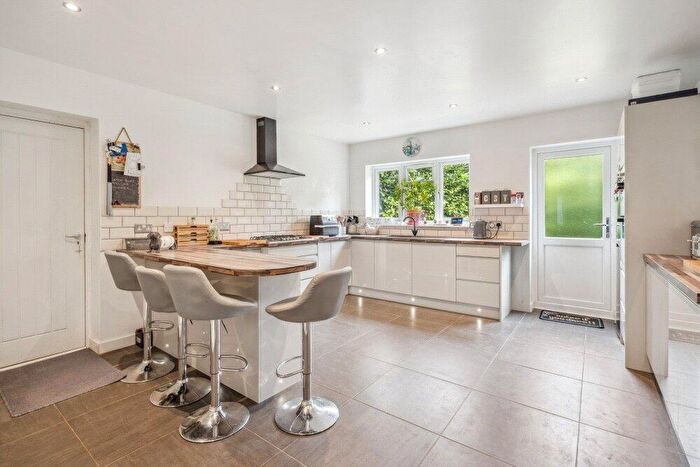
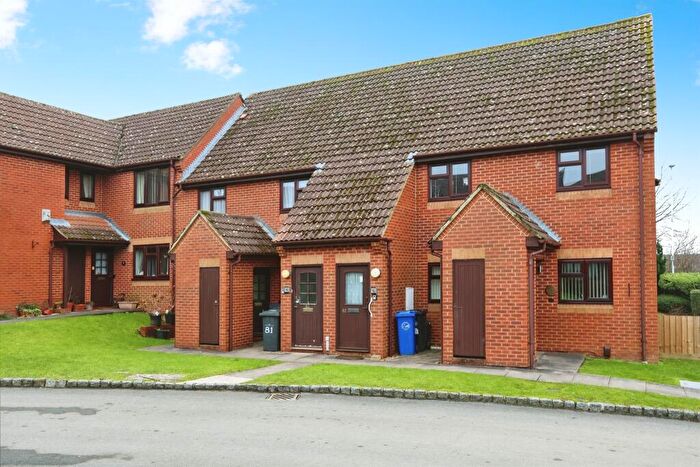
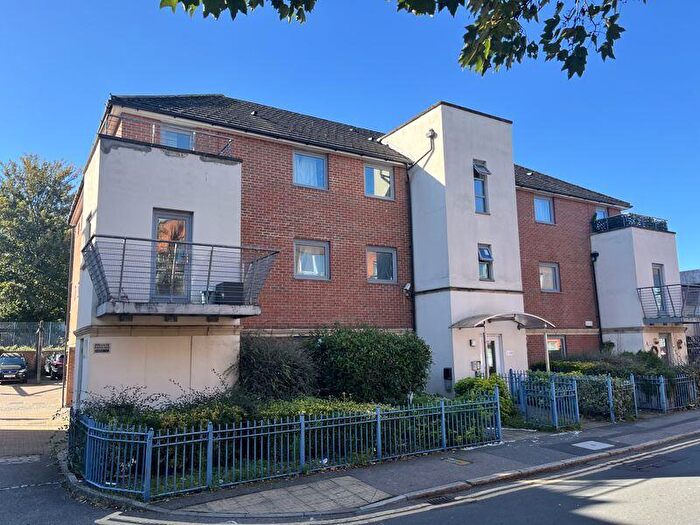
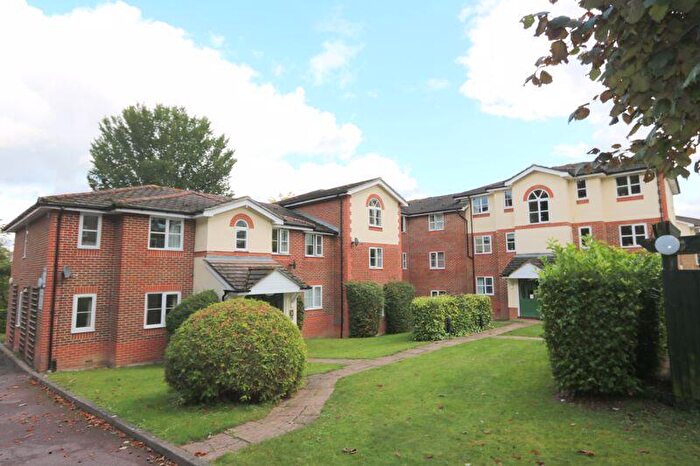
Houses and Flats for sale in HP11, Wycombe Marsh
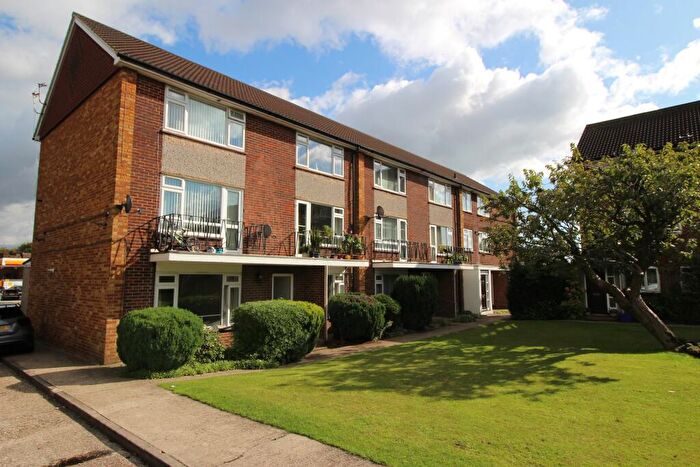
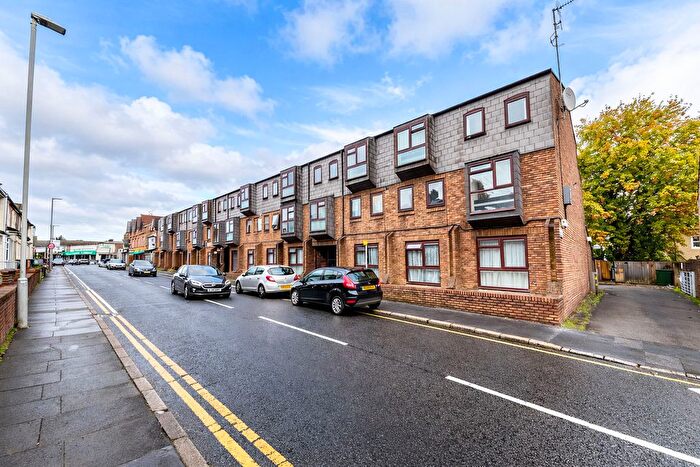
![]()
If you are looking to sell your house, let it out, or receive a property valuation, an expert can help you.
Click the button below to get started.
Frequently Asked Questions about HP11
What is the average price for a property for sale in HP11?
The average price for a property for sale in HP11 is £387,173. There are 127 property listings for sale in HP11.
Which areas are included in the HP11 postcode district?
The main area within HP11 is Wycombe Marsh.
What are the most common property types in HP11?
The most common property types in HP11 are Flats, Semi Detached Houses, Terraced Houses and Detached Houses.
What has been the average sold property price in HP11 over the last three years?
Flats in HP11 have an average sold price of £226,168, while Semi Detached Houses have an average of £476,790. Terraced Houses have an average of £373,523 and Detached Houses have an average of £717,479. The average sold property price in HP11 over the last three years is approximately £385,450.