
Properties for sale in KY5
Lochgelly
- Info
- Price Paid By Year
- Transport
House Prices in KY5
Properties in KY5 have an average house price of £137,924.00 and had 519 Property Transactions within the last 3 years.
The most expensive property was sold for £410,000.00.
Property Price Paid in KY5 by Year
The average sold property price by year was:
| Year | Average Sold Price | Sold Properties |
|---|---|---|
| 2025 | £141,305.00 | 172 Properties |
| 2024 | £138,757.00 | 147 Properties |
| 2023 | £134,404.00 | 200 Properties |
| 2022 | £141,439.00 | 344 Properties |
| 2021 | £132,698.00 | 318 Properties |
| 2020 | £122,315.00 | 269 Properties |
| 2019 | £109,942.00 | 317 Properties |
| 2018 | £111,753.00 | 294 Properties |
| 2017 | £103,374.00 | 265 Properties |
| 2016 | £104,151.00 | 249 Properties |
| 2015 | £98,924.00 | 260 Properties |
| 2014 | £93,845.00 | 245 Properties |
| 2013 | £89,621.00 | 226 Properties |
| 2012 | £100,067.00 | 233 Properties |
| 2011 | £104,067.00 | 261 Properties |
| 2010 | £100,660.00 | 239 Properties |
| 2009 | £100,222.00 | 258 Properties |
| 2008 | £99,469.00 | 327 Properties |
| 2007 | £99,673.00 | 479 Properties |
| 2006 | £90,725.00 | 386 Properties |
| 2005 | £59,061.00 | 437 Properties |
| 2004 | £46,728.00 | 427 Properties |
| 2003 | £39,768.00 | 465 Properties |
| 2002 | £37,467.00 | 376 Properties |
| 2001 | £30,577.00 | 30 Properties |
Transport near KY5

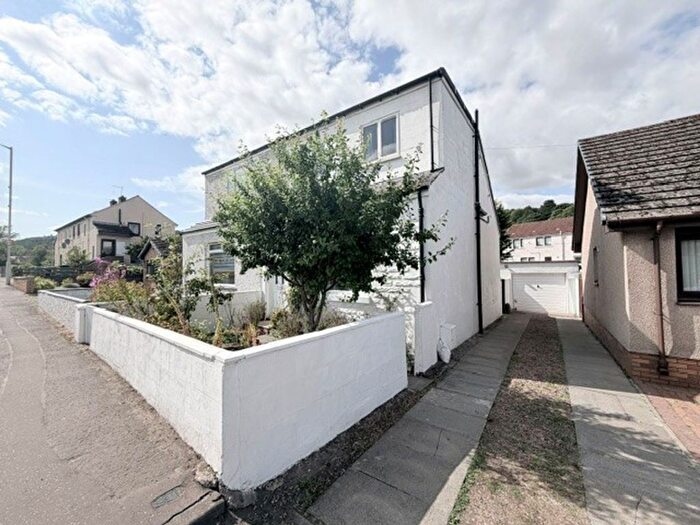
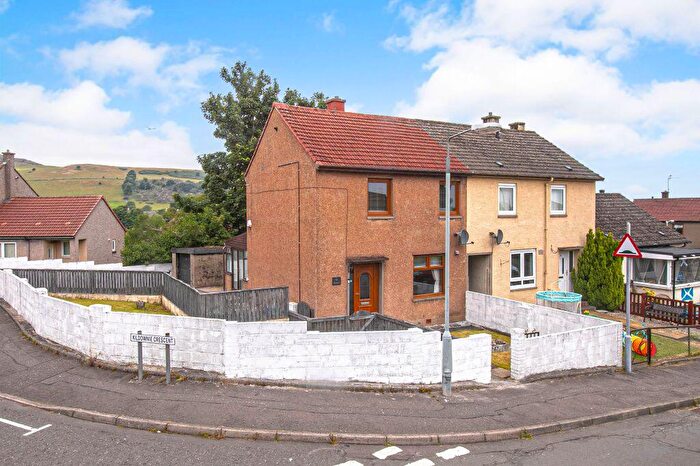
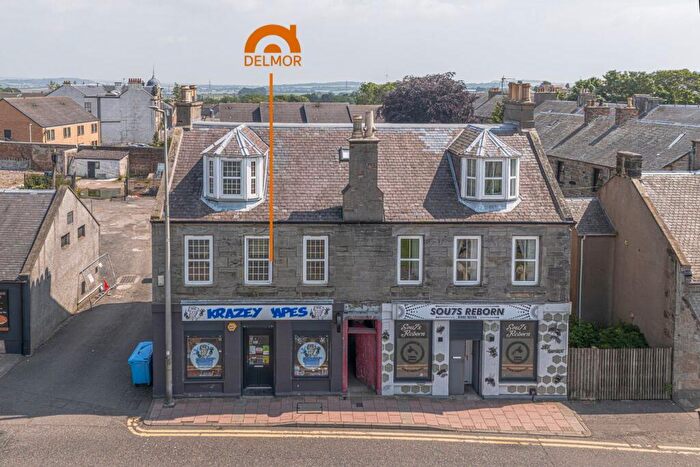
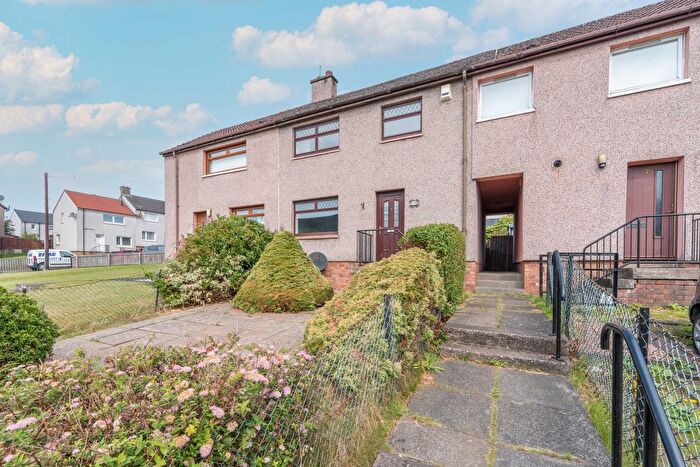
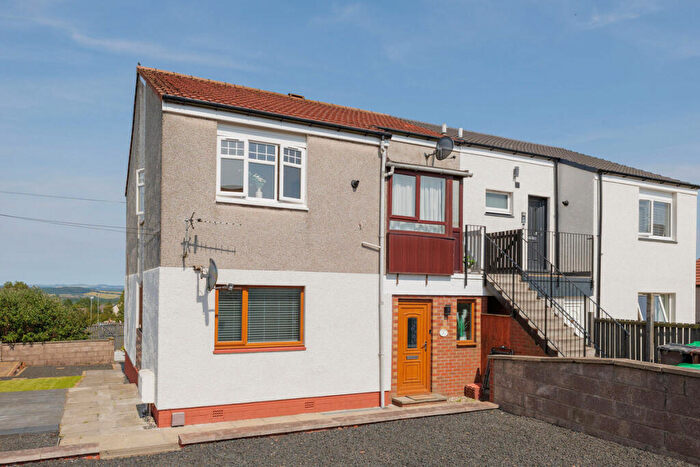
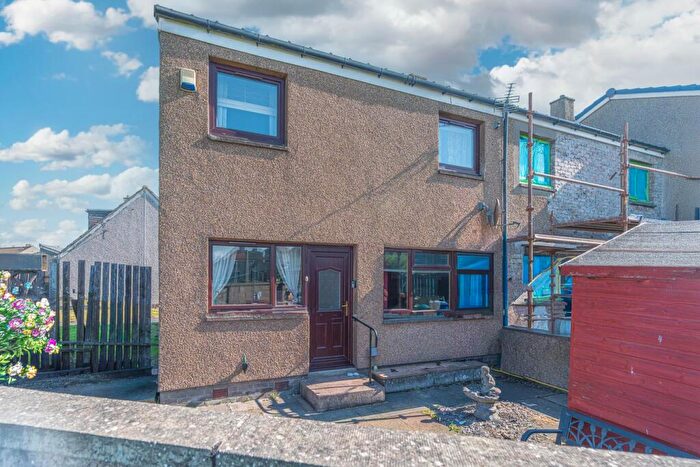
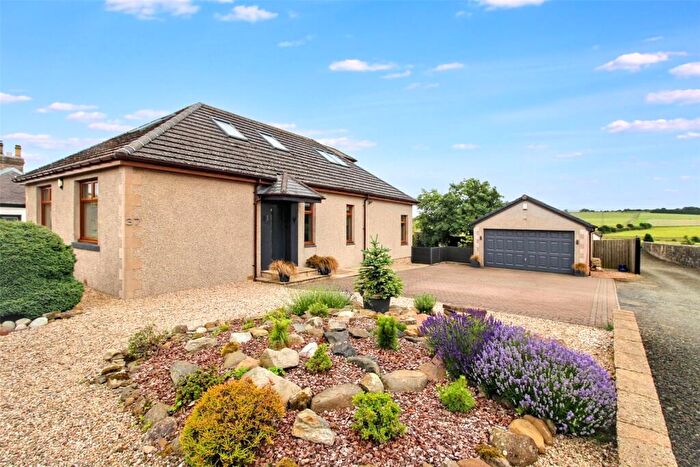
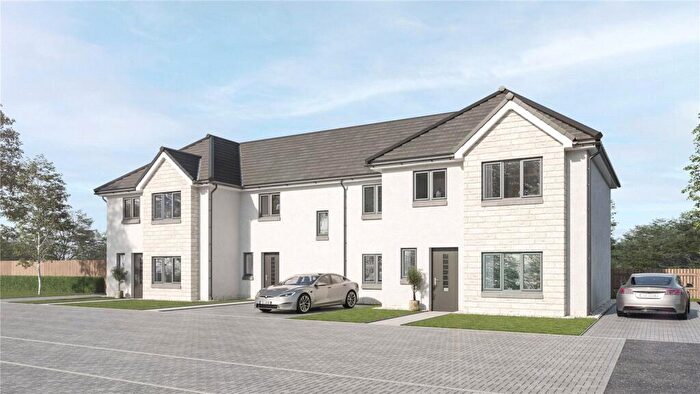
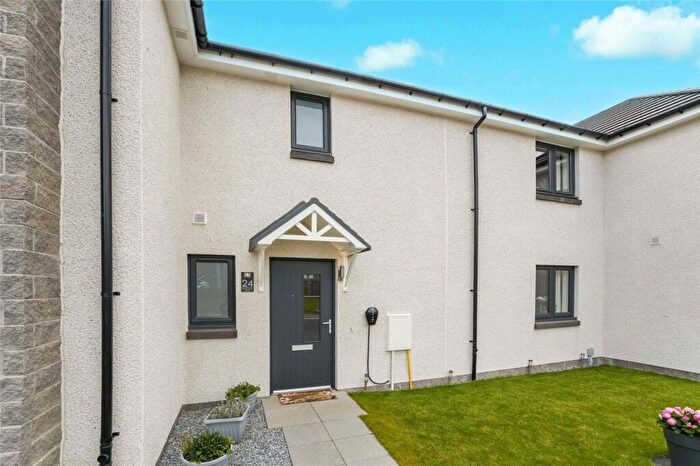
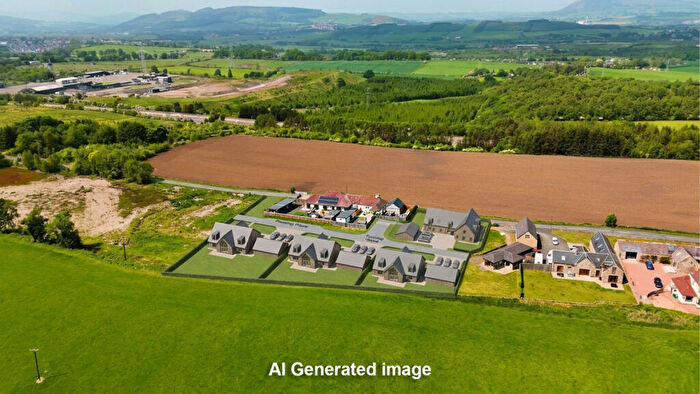
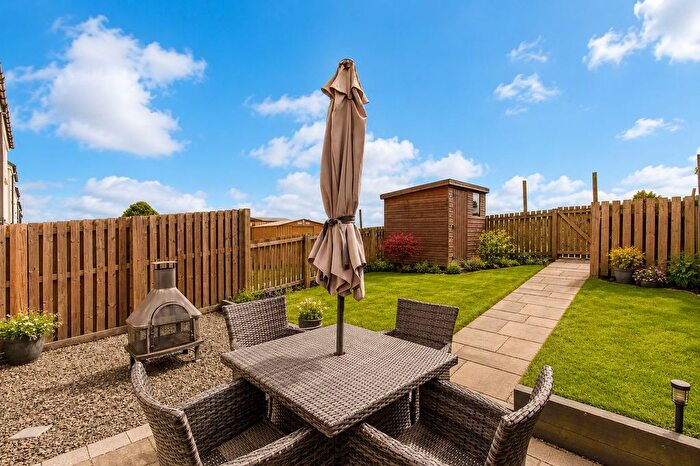
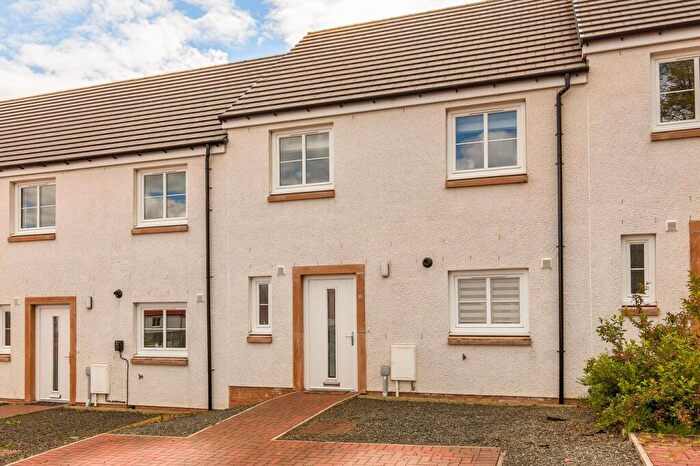
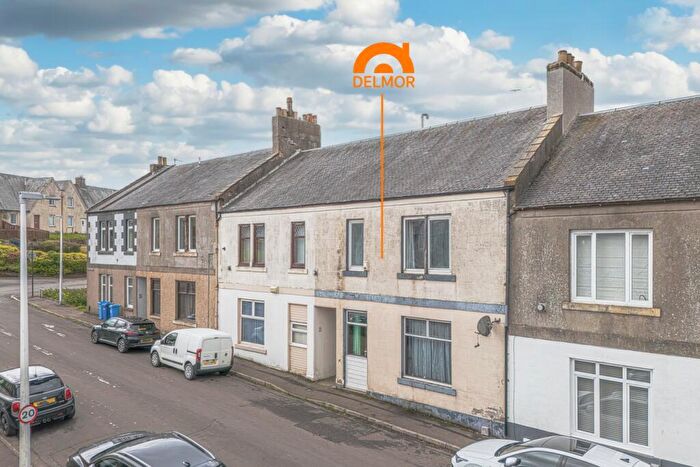
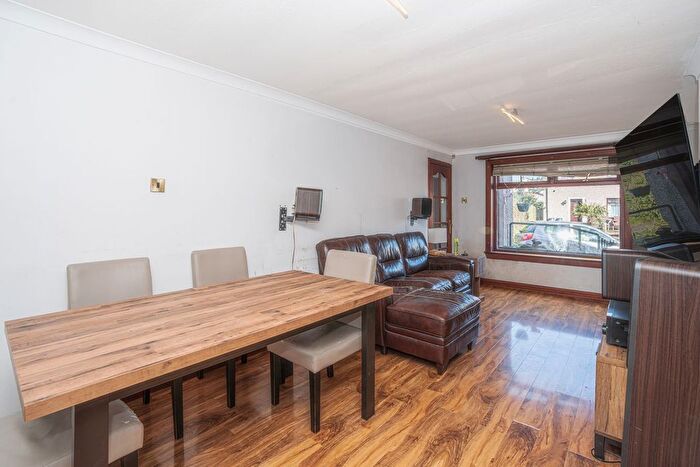
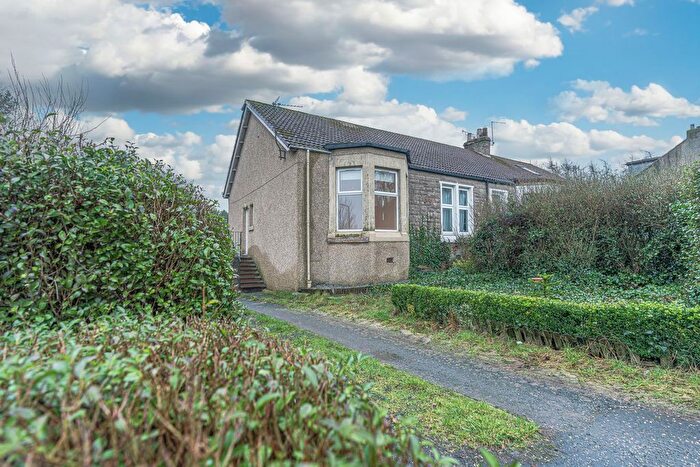
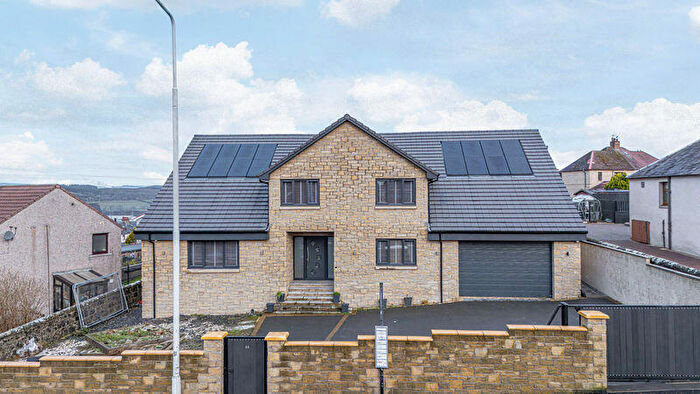
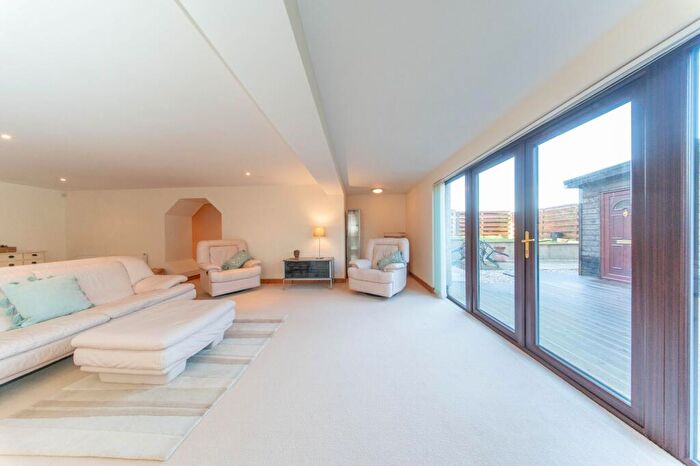
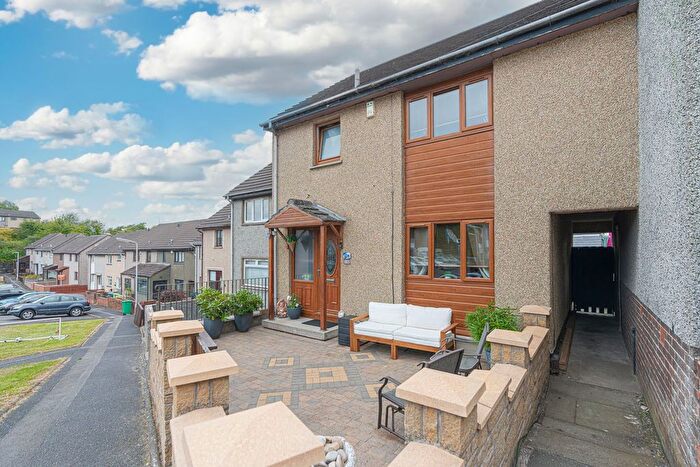
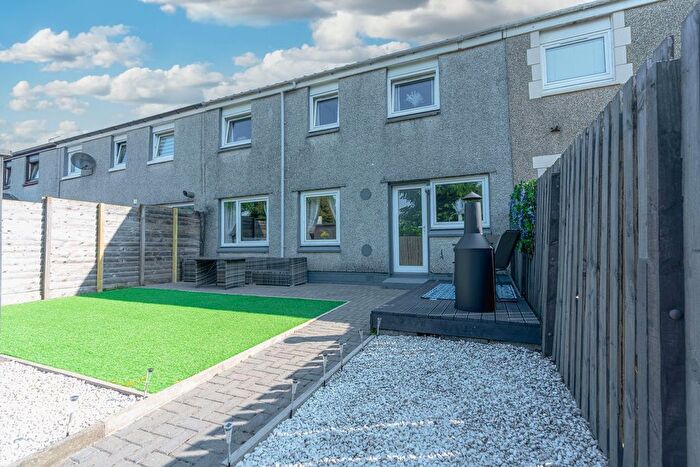
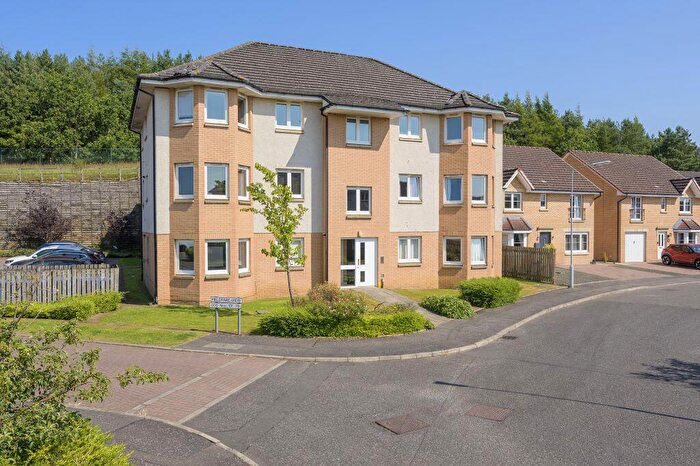
Houses and Flats for sale in KY5, Lochgelly
There are 234 results. Property prices in KY5 range from £60k to £550k with an average price of £178k.
![]()
If you are looking to sell your house, let it out, or receive a property valuation, an expert can help you.
Click the button below to get started.
Properties for sale near KY5
Frequently Asked Questions about KY5
What is the average price for a property for sale in KY5?
The average price for a property for sale in KY5 is £137,924. There are 21 property listings for sale in KY5.
Which areas are included in the KY5 postcode district?
The main area within KY5 is Lochgelly.
What are the most common property types in KY5?
The most common property types in KY5 are Unknowns.
What has been the average sold property price in KY5 over the last three years?
Unknowns in KY5 have an average sold price of £137,924. The average sold property price in KY5 over the last three years is approximately £138,155.
Which train stations are available in KY5?
The train stations available in KY5 are Cardenden Station and Lochgelly Station..